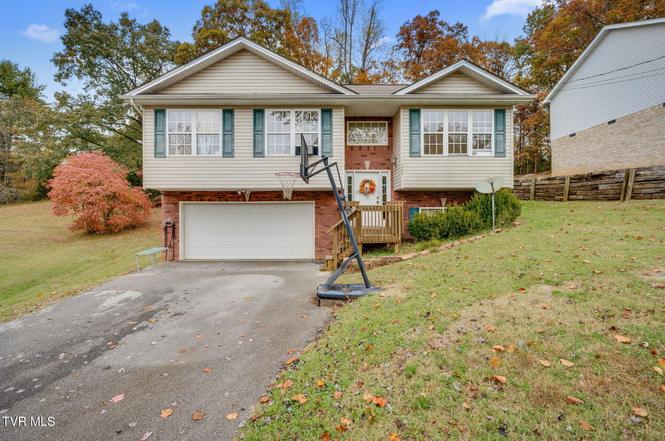
1000 Faye St · Kingsport, TN
Flood risk 1/10 · Minimal
- FEMA flood zone
- X (unshaded)
- Chance of flooding over 30 yrs
- 0.0%
- Est. flood insurance / yr
- $473 – $860
Fire risk 4/10 · Minor
- Est. fire insurance / yr
- $949 – $1,763
Heat risk 5/10 · Moderate
- Hot days now (above 99°F)
- 7 days/yr
- Hot days in 30 yrs
- 22 days/yr
Wind risk 2/10 · Minimal
- Chance of severe wind over 30 yrs
- —
Air-quality risk 1/10 · Minimal
- Unhealthy air days now
- 0 days/yr
- Unhealthy air days in 30 yrs
- 0 days/yr
Risk factors via First Street. Map © Google.
Why this score? — see what drove the D- grade
The composite is a weighted blend of 9 inputs, each scored 0–100. Each bar is that input's sub-score; the figure is the points it added to the 100-point composite (weight × sub-score).
- Cash flow +11.8/30.0
- ARV discount +5.9/15.0
- Rent growth +4.5/5.0
- Livability +3.6/5.0
- DSCR +3.5/10.0
- Schools +3.0/10.0
- 1% rule +2.6/10.0
- Condition / age +2.5/5.0
- Appreciation +0.0/10.0
$285,000
🖨 Deal sheet 📄 Offer letter ✓ Due diligence
Listing remarks
Spacious 4-Bedroom Home in a Great Location! Conveniently located near I-26 in a well-maintained neighborhood, this 4-bedroom, 3-bath split-foyer home offers 1,821 sq. ft. of comfortable living space and a full two-car garage. The upper level features a spacious master suite with a private bath and a large walk-in closet—complete with washer and dryer hookups for added convenience. Three additional bedrooms and another full bath provide plenty of space for family or guests. The kitchen boasts a large island, abundant cabinet storage, and ample room for a full-size dining table. Downstairs, you'll find a generous family room or den—perfect for entertaining, relaxing, or creating
Key facts
- Private bath
- Large island
- Large walk in closet
Tags
Property features AI
Finance
- HOA & community: Landscaping (association amenity)
Exterior
- Parking: Attached garage; Driveway; Garage door opener
- Security: Smoke detector(s)
- Utilities: Public water; Public sewer; Cable available
- Home design: Single family residence; Two levels; House
- Construction: Vinyl siding; Block foundation; Built with shingle roof
- Exterior features: Balcony; Dock; Deck; Front porch; Patio; Shingle roof; Level topography
Interior
- Kitchen: Dishwasher; Electric range; Microwave; Refrigerator
- Flooring: Carpet; Hardwood
- Bathrooms: Three full bathrooms
- Heating & cooling: Central heating; Heat pump heating; Central air conditioning; Heat pump cooling
- Interior features: Entrance foyer; Open floorplan; Pantry; Soaking tub; Double pane windows
- Laundry & utility: Washer hookup; Electric dryer hookup; Finished and partially finished basement
Neighborhood map
What this means for you Summary
Snapshot
- This is a 4-bed/2.0-bath single-family listed at $285k.
Deal economics
- At list price, monthly cash flow is $-77 ($-924/yr) — negative.
- To cash-flow at today's rent, offer at most $271k (4.8% below list).
- To meet the 1% rule (rent ≥ 1% of price), the offer needs to be $217k (23.9% below list).
- Recommended offer: $217k (23.9% below list) — sets the bar for 1% rule.
- Cap rate 6.0% vs local median 3.8% in Kingsport — top-decile yield for the area; either an underpriced asset or a hidden risk that comps aren't pricing in. Stress-test before assuming the spread holds.
Location & tenants
- Location reads 71/100 on livability (#39 in TN) — a middle-class / working-renter tenant base. Strengths: cost of living A+, health & safety A+, housing A; Watch: amenities C-, crime F, commute F.
- Kingsport (urban): math 35% / reading 38% proficiency, ranked #26 of 139 in TN (top 19%) — families likely to look elsewhere, expect single-tenant / working-renter base with shorter leases.
- Zoned schools: John Sevier Middle School (math 21% / reading 24%, grade F, #172 of 333 statewide, top 52%, 750 students, 0% FRL); Dobyns - Bennett High School (math 23% / reading 56%, grade F, #28 of 332 statewide, top 9%, 2,514 students, 0% FRL) — zoned schools average 0% FRL vs 47% district-wide (47 pts lower); this property's tenant base skews higher-income than the district average.
- Market conditions: Rents rising fast (+8.0%/yr); 239 active listings in the ZIP; 3 comparable units currently listed for rent nearby; rentals leasing fast (median 14d on market — plan ~1-2 weeks tenant-placement turnaround); 151 units permitted in Hawkins County in 2024 (0 in 5+ unit buildings).
- At $2,167/mo this rent would consume 53% of the median local household income ($49k/yr) (locally 1384% of renters already pay >50% of income on rent) — very limited rent-growth headroom before tenants either downsize or default.
Forward outlook
- Local home prices are declining (-3.0%/yr); year-one equity from $2k of loan paydown is wiped out by about $9k of value loss. Plan a longer hold.
- Hawkins County population projected at -17% by 2050 — secular population decline; favor cash flow + early exit over multi-decade hold.
Negotiation context
- It's been on market 215 days — a 12% lower offer ($251k) is reasonable based on typical stale-listing flexibility.
- Current owner paid $143k; list at $285k implies a 99% gain — meaningful room to come down on a strong offer.
Risks & watch-outs
- Climate carrying-cost: extreme-heat days projected 7→22/yr by 2055 (HVAC capex compounding) — expect insurance premiums to compound above CPI over the hold.
Questions for the listing agent
- What do current leases actually rent for vs. the listed asking? Can we see a recent rent roll and the last 12 months of T-12 income?
- It's been on market 215 days. Have you received any prior offers? Is the seller open to a 24% concession, seller financing, or rate buy-down credit?
- Why hasn't it sold? Are there any deal-killer items the seller is aware of (foundation, flood, title, zoning, code violations)?
- Is there a deadline driving the sale (1031 exchange, divorce, estate, relocation)? That informs how much negotiation room exists.
- Schools are D-rated, which usually means shorter tenancies and higher turnover. Who's the typical renter profile here, and what's been the actual vacancy rate?
- Crime grade is F in this area — have there been break-ins, vandalism, or insurance claims at this property in the last 3 years? What carrier currently insures it and at what premium?
- The area grade is low — what's the realistic commute time and amenity access for the typical tenant pool here? Any planned neighborhood developments (good or bad) we should know about?
- What's the average days-on-market for RENTAL listings here right now (not sales)? A rising rental-DOM trend means longer vacancies and softer asking-rent achievability than the comps imply.
- What's the recent tenant-quality profile in this submarket — average credit score on applications, eviction rate, late-payment / NSF rate, and stable-employment percentage? A property-management company in the area should have these aggregated.
- How much new for-sale + rental construction is in the pipeline within 1–3 miles? Heavy new supply typically softens prices + rents 12–24 months out; constrained supply supports both.
Investment metrics
- 1% rule
- 0.76% ✗
- Cap rate
- 5.97%
- Cash-on-cash
- -1.16%
- DSCR
- 0.95
- GRM
- 11.0
CMA / ARV
- ARV (on-the-fly)
- $275,144
- Comps found
- 6
Show comp detail 6 sales within ~0.75 mi
| Address | Dist | Beds/Ba | Sqft | Sold | Price | $/sf | Match |
|---|---|---|---|---|---|---|---|
| 316 Ferndale Ln | 0.24mi | 3/2.0 (-1) | 1,685 (-0%) | 0mo | $310,000 | $184 | 83 |
| 1008 Bryan Ct | 0.04mi | 3/2.5 (-1) | 1,836 (+9%) | 9mo | $299,900 | $163 | 69 |
| 340 Lewis Ln | 0.18mi | 3/2.5 (-1) | 1,868 (+11%) | 3mo | $365,000 | $195 | 64 |
| 1033 Bryan Ct | 0.11mi | 3/3.0 (-1) | 1,822 (+8%) | 17mo | $295,000 | $162 | 58 |
| 3510 Stafford St | 0.43mi | 4/2.0 | 1,620 (-4%) | 20mo | $180,000 | $111 | 57 |
| 4049 Black Oak Dr | 0.75mi | 3/2.0 (-1) | 1,600 (-5%) | 22mo | $250,000 | $156 | 33 |
Match score weights: distance 35% · size 25% · config 20% · recency 20%. Top-matched comps best support the ARV.
Projected returns pro-forma
-3.0% appreciation · 7.95% rent growth · sell at horizon
- IRR
- -13.3%
- Equity multiple
- 0.50×
- Total profit
- $-39,830
- Equity at exit
- $42,494
- IRR
- 1.5%
- Equity multiple
- 1.13×
- Total profit
- $10,219
- Equity at exit
- $24,642
Cash invested: $79,800 (down + closing). Projections, not guarantees.
Landlord ↔ Tenant lean methodology
- Overall (STATE)
- 87 Strongly Landlord-Friendly
- State Tennessee
- 87 Strongly Landlord-Friendly · R+13
- County
- — inherits STATE
- City
- — inherits STATE
ZIP-level market 37660
- Home prices YoY
- -24.2%
- Rents YoY
- 8.0%
- Active inventory
- 239
- Price-to-rent
- 11.0×
Monthly cashflow live
- Estimated rent
- $2,167 medium interval (Pro) →
- Mortgage (P&I)
- −$1,495
- Tax from tax record
- −$176 /mo · $2,112/yr
- Insurance
- −$119
- HOA
- −$0
- Vacancy / Maint / Mgmt
- −$455
- Net cashflow
- $-77
Break-even live
UW: 25.0% down · 7.5% · 30yr · 1.5% tax · 5.0% vac · 8.0% maint · 8.0% mgmt
Financing live
Cash to close
- Down payment
- $71,250
- Closing costs
- $8,550
- Reserves months
- —
- Total cash needed
- —
Loan-product check · same deal, 3 products live
Conventional
25% down · 7.5% · 30yr
- Down + closing
- —
- Monthly P&I
- —
- Monthly cashflow
- —
- DSCR
- —
- Eligible?
- —
Personal DTI + credit; lowest rate.
DSCR
20% down · 8.5% · 30yr
- Down + closing
- —
- Monthly P&I
- —
- Monthly cashflow
- —
- DSCR
- —
- Eligible?
- —
No personal income docs; deal must DSCR.
Hard money
10% down · 12.0% · 12mo
- Down + closing
- —
- Monthly P&I
- —
- Monthly cashflow
- —
- DSCR
- —
- Eligible?
- —
Short-term bridge; refi at stabilization.
Rent comps 3 comps
| Address | Beds | Baths | Sqft | Rent | $/sqft | DOM | Units | Dist |
|---|---|---|---|---|---|---|---|---|
| 1125 Faye St Kingsport, TN | 3.0 | 3.0 | 1712 | $2,400 | $1.40 | 13d | 1 | 0.17mi |
| 1504 Quartz Pl Kingsport, TN | 3.0 | 2.5 | 1418 | $1,859 | $1.31 | 13d | 6 | 0.50mi |
| 432 Cypress St Mount Carmel, TN | 3.0 | 1.0 | 1152 | $1,800 | $1.56 | 13d | 1 | 1.11mi |
Listing history 22 events
-
2026-06-19days on market $285,000 Active 215 DOM
-
2026-06-18days on market $285,000 Active 214 DOM
-
2026-06-17days on market $285,000 Active 213 DOM
-
2026-06-16days on market $285,000 Active 212 DOM
-
2026-06-15days on market $285,000 Active 211 DOM
-
2026-06-14days on market $285,000 Active 209 DOM
-
2026-06-13days on market $285,000 Active 208 DOM
-
2026-06-10days on market $285,000 Active 206 DOM
-
2026-06-09days on market $285,000 Active 205 DOM
-
2026-06-08days on market $285,000 Active 204 DOM
-
2026-06-07days on market $285,000 Active 203 DOM
-
2026-06-05days on market $285,000 Active 200 DOM
-
2026-06-03days on market $285,000 Active 199 DOM
-
2026-06-02days on market $285,000 Active 198 DOM
-
2026-06-01days on market $285,000 Active 197 DOM
-
2026-05-31days on market $285,000 Active 196 DOM
-
2026-05-30days on market $285,000 Active 195 DOM
-
2026-03-14price $285,000
-
2025-11-17price $315,000
-
2025-11-16$285,000 Active
-
2010-03-04soldstatus $143,000
-
2001-04-25soldstatus $24,100
ⓘ Source: listings_history table (triggers on properties + properties_extension) + one-shot
backfill from property_details.listing_events for pre-trigger history.
Tax reassessment forecast TN · Resets to sale price
- Current annual tax
- $2,112 · $176/mo
- Projected year-2 tax
- $2,112 · $176/mo
- Expected delta
- $0/yr ($0/mo · 0.0%)
ⓘ Screening estimate from a state-policy table — verify with the county assessor before closing.
Climate risk First Street
- Flood 1/10 Low FEMA zone X (unshaded) · 0% chance over 30 yrs
- Wildfire 4/10 Moderate
- Heat 5/10 Major 7 d/yr ≥99°F today · 22 d/yr by 30 yrs out
- Wind 2/10 Low
- Air quality 1/10 Low 0 unhealthy d/yr today · 0 by 30 yrs out
Nearby sold comps map
Loading sold comps map…
Walkable amenities ~0.75 mi
Loading nearby amenities…
Taxation est. · year 1
- Rental income
- $26,010
- − Mortgage interest
- −$15,964
- − Property taxes
- −$2,112
- − Insurance
- −$1,425
- − Repairs & maintenance
- −$2,081
- − Management
- −$2,081
- − Depreciation
- −$8,291
- Taxable loss
- −$5,944
- Est. tax savings @ 24.0%
- +$1,427
- After-tax cash flow
- $503/yr
For passive investors: Depreciation is non-cash, so a rental often shows a tax loss while cash-flowing — sheltering income. Rental losses are passive: they offset passive income freely, and up to $25,000/yr can offset ordinary (W-2) income if you actively participate and your MAGI is under $100k (phasing out to $0 by $150k); unused losses carry forward. On sale, claimed depreciation is recaptured at up to 25%, and gains may owe capital-gains tax (a 1031 exchange can defer both). Figures are a year-1 estimate at your 24.0% rate — not tax advice; consult a CPA.
Schools (NCES district)
- District
- Kingsport
- NCES district ID
- 4702190
- Math proficiency
- 35% ▼ -12.00%
- Reading proficiency
- 38% ▼ -5.00%
- Median HH income
- $38,017
- Composite
- 30.44/100
- National rank
- #6233
- State rank
- #26 of 139 in TN
Livability — Kingsport
- Score
- 71/100
- State rank
- #39
- US rank
- #6587
Category grades
Schools grade is shown separately in the Schools card above.
Census & demographics
- Census place
- Kingsport, TN
- County
- Sullivan County · 121,987 people
- City population
- 83,493
- Metro
- Kingsport-Bristol, TN-VA
- Population (ZIP)
- 40,996
- Household income
- $49,191
- Rent vs Own
- Severe rent burden
- 1384.0
Population outlook (Hawkins County) Hauer SSP2
- Today (2025)
- 55,226 people
- By 2030
- 53,784 · -2.6%
- By 2040
- 50,015 · -9.4%
- By 2050
- 45,682 · -17.3%
- By 2075
- 36,211 · -34.4%
- By 2100
- 26,536 · -52.0%
Race, ethnicity, and origin ACS 2023
- Neighborhood character
- Predominantly White (88%)
- Race & ethnicity
- White 88% Two or more races 4% Black 4% Hispanic / Latino 3%
- Common ancestry
- Serbian 3% Slovak 3% Italian 1%
- Foreign-born
- 2% · Canada
- Languages at home
- 98% English-only · Spanish 2%
Political lean MEDSL · Hawkins
- 2024 margin
- Solid R (+68.8) · D 15.2% · R 84.0%
- 2008→2024 swing
- -26.9pp toward R · 2008: -42.0pp · 2024: -68.8pp
- All cycles
- 2024: R+68.8 2020: R+65.8 2016: R+63.4 2012: R+47.0 2008: R+42.0
Not yet ingested
- Civics
- —
Market trends
- HPI YoY
- ▼ -80.93%
- Current HPI
- 252.9821
- Rent YoY
- ▲ 7.95%
- Metro
- Kingsport-Bristol, TN-VA
- State GDP YoY
- ▲ 2.78%
- F500 in state
- 22
Industry mix (Fortune 500 HQ in TN)
| Industry | F500 HQs | Revenue |
|---|---|---|
| Healthcare | 3 | $91B |
|
||
| Retail | 3 | $72B |
|
||
| Transportation / Logistics | 1 | $88B |
|
||
| Paper / Packaging | 1 | $19B |
|
||
| Insurance | 1 | $13B |
|
||
| Energy | 1 | $12B |
|
||
Price history
+1082.6% since first listed5 events — show timeline
- 2026-03-14 Price Changed $285,000 TVRMLS
- 2025-11-17 Price Changed $315,000 TVRMLS
- 2025-11-16 Listed $285,000 TVRMLS
- 2010-03-04 Sold (Public Records) $143,000 Public Records
- 2001-04-25 Sold (Public Records) $24,100 Public Records
Property tax history
+2.5%/yrLatest (2025): $2,112 · +10.8% YoY. Source: county tax records.
Cash-flow waterfall
monthlySold comps — $/sqft
last 12 mo · ≤1 miLoading sold comps…