 🏗️ New Construction
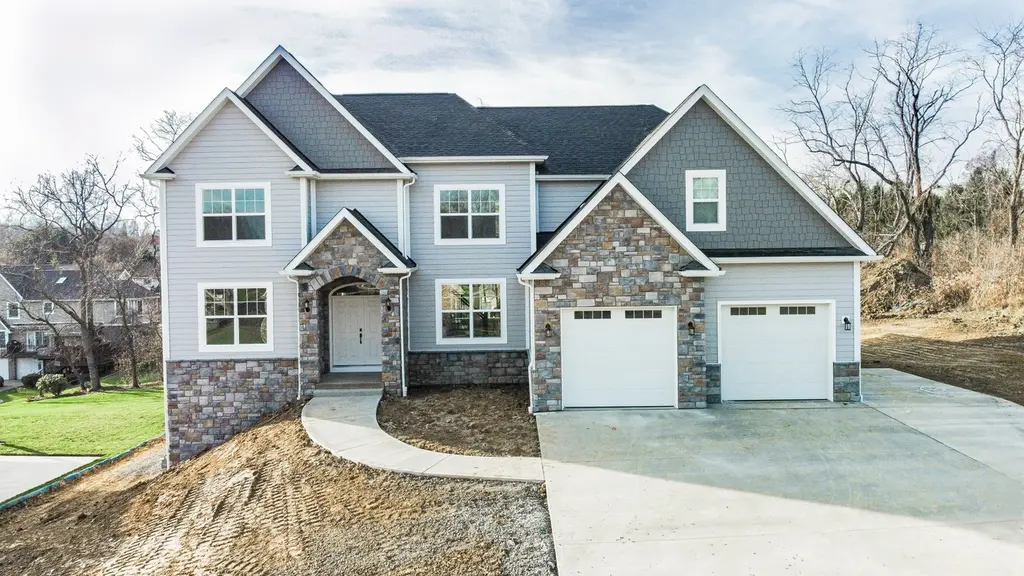
The Charleston (Custom) - Build On Your Land Plan · Cranberry, PA
Flood risk No data
- FEMA flood zone
- —
- Chance of flooding over 30 yrs
- —
- Est. flood insurance / yr
- —
Fire risk No data
- Est. fire insurance / yr
- —
Heat risk No data
- Hot days now (above threshold)
- —
- Hot days in 30 yrs
- —
Wind risk No data
- Chance of severe wind over 30 yrs
- —
Air-quality risk No data
- Unhealthy air days now
- —
- Unhealthy air days in 30 yrs
- —
Risk factors via First Street. Map © Google.
Why this score? — see what drove the F grade
The composite is a weighted blend of 9 inputs, each scored 0–100. Each bar is that input's sub-score; the figure is the points it added to the 100-point composite (weight × sub-score).
- ARV discount +7.5/15.0
- Schools +5.2/10.0
- Cash flow +4.8/30.0
- Condition / age +4.8/5.0
- Livability +2.5/5.0
- Rent growth +2.0/5.0
- 1% rule +0.6/10.0
- DSCR +0.0/10.0
- Appreciation +0.0/10.0
$459,000
🖨 Deal sheet 📄 Offer letter ✓ Due diligence
Listing remarks MLS
BUILD ON YOUR LAND: High-quailty construction, upgraded interior features and a builder with over 95% customer satisfaction - all included when you choose Parry Custom Homes to build on your land in the Pittsburgh and Greater Pittsburgh Areas! We are the top-rated local On Your Homesite builder with showrooms in Cranberry, Washington and North Huntingdon serving all counties in the Southwestern Pennsylvania area! This home can be customized to your taste, needs and price point - all at no cost to you. Parry Custom Homes does not own land but can help you determine if the homesite you are considering purchasing is right for the home of your dreams. If you already own property, we make the custom design process transparent, easy and fun! Any home plan can be modified as much or as little as you want to meet your needs. We can build from your own custom plans with no cost for design work! With inclusions like granite countertops, hardwood floors, tile showers, upgraded trim work, Kraftmaid cabinetry and solid-pour foundations with steel beams included, you can rest assured you're getting the best built home for your investment! Click below to learn more about how Parry Custom Homes, a family-owned business, can help get you started designing the custom home of your dreams at an amazing price point. To read what our past customers have said about their experience, please visit GuildQuality.com/ParryCustomHomes and see why 95% of them would recommend us to their friends!
Key facts
- 2 parking spots
- Listed 953 days
Neighborhood map
What this means for you Summary
Snapshot
- This is a 4-bed/2.5-bath single-family listed at $459k. Condition is rated excellent.
Deal economics
- At list price, monthly cash flow is $-2k ($-21k/yr) — negative.
- To cash-flow at today's rent, offer at most $457k (0.4% below list).
- To meet the 1% rule (rent ≥ 1% of price), the offer needs to be $400k (12.9% below list).
- Recommended offer: $400k (12.9% below list) — sets the bar for 1% rule.
Location & tenants
- Location reads: area grade F — affects rentability + tenant quality, not the cash-flow math above.
- Seneca Valley SD (rural): math 48% / reading 67% proficiency, ranked #73 of 539 in PA (top 14%) — acceptable for families but not a draw, mixed tenant base, ~2y average lease; only 12% free/reduced lunch — higher-income household profile.
- Market conditions: Rents soft (-1.9%/yr); 288 active listings in the ZIP; 4 comparable units currently listed for rent nearby; rentals at typical pace (median 24d on market — plan ~3-4 weeks tenant-placement turnaround); high-income renter base; 987 units permitted in Butler County in 2024 (0 in 5+ unit buildings).
- This rent runs 39% of the median local income ($124k/yr) — at the standard rent-burdened threshold; future hikes will face affordability resistance.
Forward outlook
- Local home prices are declining (-3.0%/yr); year-one equity from $5k of loan paydown is wiped out by about $21k of value loss. Plan a longer hold.
- Butler County population projected to shrink 5% by 2050 — rents likely to lag national; underwrite the cash flow, not the appreciation.
Negotiation context
- It's been on market 953 days — a 12% lower offer ($404k) is reasonable based on typical stale-listing flexibility.
Questions for the listing agent
- What do current leases actually rent for vs. the listed asking? Can we see a recent rent roll and the last 12 months of T-12 income?
- It's been on market 953 days. Have you received any prior offers? Is the seller open to a 13% concession, seller financing, or rate buy-down credit?
- Why hasn't it sold? Are there any deal-killer items the seller is aware of (foundation, flood, title, zoning, code violations)?
- Is there a deadline driving the sale (1031 exchange, divorce, estate, relocation)? That informs how much negotiation room exists.
- The area grade is low — what's the realistic commute time and amenity access for the typical tenant pool here? Any planned neighborhood developments (good or bad) we should know about?
- What's the average days-on-market for RENTAL listings here right now (not sales)? A rising rental-DOM trend means longer vacancies and softer asking-rent achievability than the comps imply.
- What's the recent tenant-quality profile in this submarket — average credit score on applications, eviction rate, late-payment / NSF rate, and stable-employment percentage? A property-management company in the area should have these aggregated.
- How much new for-sale + rental construction is in the pipeline within 1–3 miles? Heavy new supply typically softens prices + rents 12–24 months out; constrained supply supports both.
Investment metrics
- 1% rule
- 0.56% ✗
- Cap rate
- 3.34%
- Cash-on-cash
- -10.55%
- DSCR
- 0.53
- GRM
- 14.8
CMA / ARV
- ARV (median comp)
- $710,296
- List price
- $459,000
- Delta
- -35.38%
- Verdict
- UNDERPRICED
- Comps
- 20 within 1.0 mi
Show comp detail 2 sales within ~0.75 mi
| Address | Dist | Beds/Ba | Sqft | Sold | Price | $/sf | Match |
|---|---|---|---|---|---|---|---|
| 307 Harlequin St | 0.72mi | 5/4.5 (+1) | 3,088 (-8%) | 3mo | $739,900 | $240 | 37 |
| 309 Harlequin St | 0.73mi | 4/3.5 | 2,906 (-14%) | 13mo | $735,000 | $253 | 29 |
Match score weights: distance 35% · size 25% · config 20% · recency 20%. Top-matched comps best support the ARV.
Projected returns pro-forma
-3.0% appreciation · 0.0% rent growth · sell at horizon
- IRR
- -38.7%
- Equity multiple
- -0.20×
- Total profit
- $-238,133
- Equity at exit
- $105,907
- IRR
- -81.4%
- Equity multiple
- -0.99×
- Total profit
- $-395,829
- Equity at exit
- $61,413
Cash invested: $198,883 (down + closing). Projections, not guarantees.
Landlord ↔ Tenant lean methodology
- Overall (STATE)
- 62 Landlord-Friendly
- State Pennsylvania
- 62 Landlord-Friendly · EVEN
- County
- — inherits STATE
- City
- — inherits STATE
ZIP-level market 16066
- Rents YoY
- -1.9%
- Active inventory
- 288
- Price-to-rent
- 9.6×
Monthly cashflow live
- Estimated rent
- $4,000 medium interval (Pro) →
- Mortgage (P&I)
- −$3,725
- Tax est. 1.5%
- −$888 /mo · $10,654/yr
- Insurance
- −$296
- HOA
- −$0
- Vacancy / Maint / Mgmt
- −$840
- Net cashflow
- $-1,749
Break-even live
UW: 25.0% down · 7.5% · 30yr · 1.5% tax · 5.0% vac · 8.0% maint · 8.0% mgmt
Financing live
Cash to close
- Down payment
- $177,574
- Closing costs
- $21,309
- Reserves months
- —
- Total cash needed
- —
Loan-product check · same deal, 3 products live
Conventional
25% down · 7.5% · 30yr
- Down + closing
- —
- Monthly P&I
- —
- Monthly cashflow
- —
- DSCR
- —
- Eligible?
- —
Personal DTI + credit; lowest rate.
DSCR
20% down · 8.5% · 30yr
- Down + closing
- —
- Monthly P&I
- —
- Monthly cashflow
- —
- DSCR
- —
- Eligible?
- —
No personal income docs; deal must DSCR.
Hard money
10% down · 12.0% · 12mo
- Down + closing
- —
- Monthly P&I
- —
- Monthly cashflow
- —
- DSCR
- —
- Eligible?
- —
Short-term bridge; refi at stabilization.
Rent comps 4 comps
| Address | Beds | Baths | Sqft | Rent | $/sqft | DOM | Units | Dist |
|---|---|---|---|---|---|---|---|---|
| 114 Main St Cranberry Township, PA | 4.0 | 3.5 | 2900 | $5,995 | $2.07 | 12d | 1 | 0.55mi |
| 417 Roebling Ct Cranberry Township, PA | 3.0 | 2.5 | 2500 | $3,100 | $1.24 | 2d | 1 | 0.60mi |
| 509 High Crescent Rd Cranberry Township, PA | 3.0 | 2.5 | 3170 | $5,500 | $1.74 | 23d | 1 | 0.77mi |
| 108 Whitney Dr Cranberry Township, PA | 4.0 | 3.0 | 2600 | $2,600 | $1.00 | 43d | 1 | 0.89mi |
Listing history 15 events
-
2026-06-18days on market $459,000 Active 953 DOM
-
2026-06-17days on market $459,000 Active 952 DOM
-
2026-06-16days on market $459,000 Active 951 DOM
-
2026-06-15days on market $459,000 Active 950 DOM
-
2026-06-13days on market $459,000 Active 948 DOM
-
2026-06-13days on market $459,000 Active 947 DOM
-
2026-06-09days on market $459,000 Active 944 DOM
-
2026-06-08days on market $459,000 Active 943 DOM
-
2026-06-07days on market $459,000 Active 942 DOM
-
2026-06-05days on market $459,000 Active 939 DOM
-
2026-06-03days on market $459,000 Active 938 DOM
-
2026-06-02days on market $459,000 Active 937 DOM
-
2026-06-01days on market $459,000 Active 936 DOM
-
2026-05-31days on market $459,000 Active 935 DOM
-
2023-11-08$459,000 Active 1490-char remark
Show marketing remark (1490 chars)
BUILD ON YOUR LAND: High-quailty construction, upgraded interior features and a builder with over 95% customer satisfaction - all included when you choose Parry Custom Homes to build on your land in the Pittsburgh and Greater Pittsburgh Areas! We are the top-rated local On Your Homesite builder with showrooms in Cranberry, Washington and North Huntingdon serving all counties in the Southwestern Pennsylvania area! This home can be customized to your taste, needs and price point - all at no cost to you. Parry Custom Homes does not own land but can help you determine if the homesite you are considering purchasing is right for the home of your dreams. If you already own property, we make the custom design process transparent, easy and fun! Any home plan can be modified as much or as little as you want to meet your needs. We can build from your own custom plans with no cost for design work! With inclusions like granite countertops, hardwood floors, tile showers, upgraded trim work, Kraftmaid cabinetry and solid-pour foundations with steel beams included, you can rest assured you're getting the best built home for your investment! Click below to learn more about how Parry Custom Homes, a family-owned business, can help get you started designing the custom home of your dreams at an amazing price point. To read what our past customers have said about their experience, please visit GuildQuality.com/ParryCustomHomes and see why 95% of them would recommend us to their friends!
ⓘ Source: listings_history table (triggers on properties + properties_extension) + one-shot
backfill from property_details.listing_events for pre-trigger history.
Nearby sold comps map
Loading sold comps map…
Walkable amenities ~0.75 mi
Loading nearby amenities…
Taxation est. · year 1
- Rental income
- $48,001
- − Mortgage interest
- −$39,788
- − Property taxes
- −$10,654
- − Insurance
- −$3,551
- − Repairs & maintenance
- −$3,840
- − Management
- −$3,840
- − Depreciation
- −$20,663
- Taxable loss
- −$34,336
- Est. tax savings @ 24.0%
- +$8,241
- After-tax cash flow
- $-12,743/yr
For passive investors: Depreciation is non-cash, so a rental often shows a tax loss while cash-flowing — sheltering income. Rental losses are passive: they offset passive income freely, and up to $25,000/yr can offset ordinary (W-2) income if you actively participate and your MAGI is under $100k (phasing out to $0 by $150k); unused losses carry forward. On sale, claimed depreciation is recaptured at up to 25%, and gains may owe capital-gains tax (a 1031 exchange can defer both). Figures are a year-1 estimate at your 24.0% rate — not tax advice; consult a CPA.
Condition & rehab AI · 13 photos
This custom-built home in Cranberry, PA is in excellent condition with no visible repairs needed. It offers a high-end interior with granite countertops and marble bathrooms, and a well-maintained exterior. Potential buyers will appreciate the curb appeal and smart home features.
Value-add opportunities
- Resale Painting exterior siding — Enhances curb appeal
- Resale Landscaping front yard — Improves curb appeal
- Both Install smart home security system — Enhances safety and convenience
Renovation cost estimate screening
Value-add ROI direction
- Resale Painting exterior siding — Enhances curb appeal ↑
- Resale Landscaping front yard — Improves curb appeal ↑
- Both Install smart home security system — Enhances safety and convenience ↑
ⓘ Cost ranges are severity-bucket heuristics (US national rule-of-thumb). Get contractor quotes + a written scope before underwriting a rehab budget.
Schools (NCES district)
- District
- Seneca Valley SD
- NCES district ID
- 4222440
- Math proficiency
- 48% ▼ -15.00%
- Reading proficiency
- 67% ▼ -12.00%
- Median HH income
- $80,381
- Composite
- 51.84/100
- National rank
- #1666
- State rank
- #73 of 539 in PA
Livability — Cranberry
No livability data for this city. (Only ~50 U.S. cities are tracked.)
Census & demographics
- County
- Butler County · 73,107 people
- Metro
- Pittsburgh, PA
- Population (ZIP)
- 33,873
- Household income
- $124,189
- Rent vs Own
- Severe rent burden
- 536.0
Population outlook (Butler County) Hauer SSP2
- Today (2025)
- 190,777 people
- By 2030
- 191,476 · +0.4%
- By 2040
- 189,474 · -0.7%
- By 2050
- 182,050 · -4.6%
- By 2075
- 159,526 · -16.4%
- By 2100
- 129,028 · -32.4%
Race, ethnicity, and origin ACS 2023
- Neighborhood character
- Predominantly White (90%)
- Race & ethnicity
- White 90% Asian 4% Two or more races 3% Hispanic / Latino 2% Black 1%
- Common ancestry
- Romanian 10% Slovak 1% Italian 1%
- Foreign-born
- 5% · Canada, China
- Languages at home
- 93% English-only · Other Indo-European 2% Spanish 1% Other Asian/Pacific 1%
Political lean MEDSL · Butler
- 2024 margin
- Solid R (+32.2) · D 33.5% · R 65.7%
- 2008→2024 swing
- -4.8pp toward R · 2008: -27.4pp · 2024: -32.2pp
- All cycles
- 2024: R+32.2 2020: R+32.5 2016: R+37.5 2012: R+34.9 2008: R+27.4
Not yet ingested
- Civics
- —
Market trends
- HPI YoY
- ▼ -154.35%
- Current HPI
- 276.4597
- Rent YoY
- ▼ -1.93%
- Metro
- Pittsburgh, PA
- State GDP YoY
- ▲ 1.68%
- F500 in state
- 34
Industry mix (Fortune 500 HQ in PA)
| Industry | F500 HQs | Revenue |
|---|---|---|
| Healthcare | 2 | $309B |
|
||
| Insurance | 2 | $27B |
|
||
| Telecommunications / Media | 1 | $124B |
|
||
| Industrial Distribution | 1 | $22B |
|
||
| Financial Services | 1 | $20B |
|
||
| Chemicals / Materials | 1 | $18B |
|
||
Price history
1 event — show timeline
- 2023-11-08 Listed $459,000 Zillow
Cash-flow waterfall
monthlySold comps — $/sqft
last 12 mo · ≤1 miLoading sold comps…