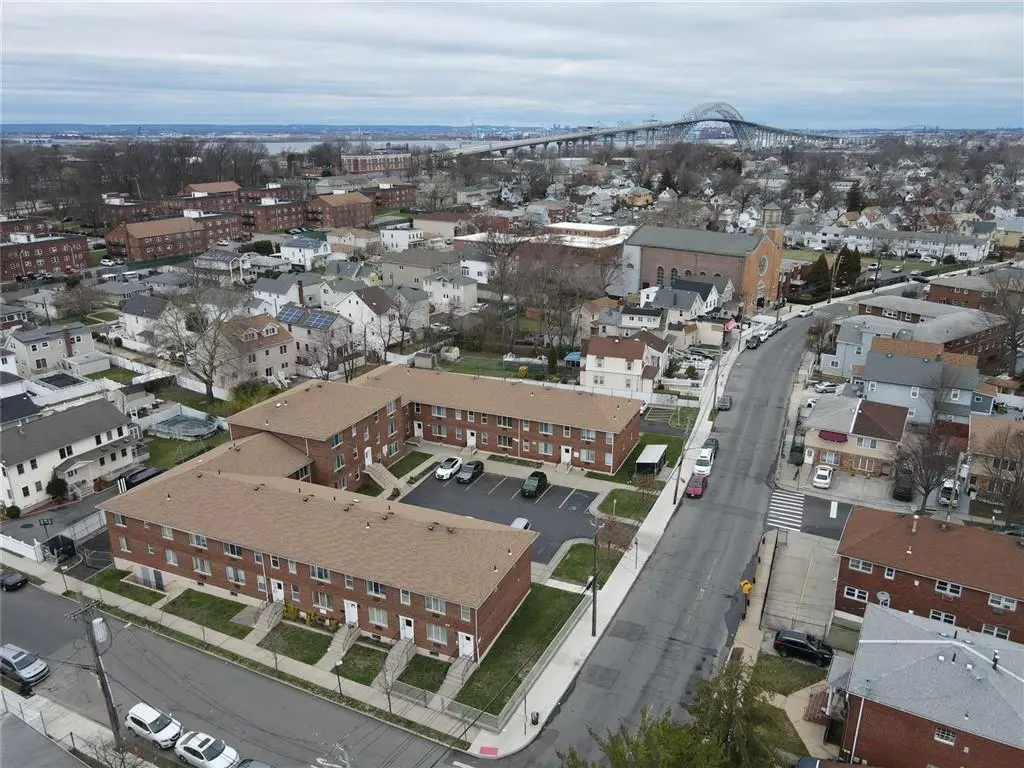
 43-Plex
646-662 Port Richmond Ave · New York, NY
Flood risk 8/10 · Major
- FEMA flood zone
- X (unshaded)
- Chance of flooding over 30 yrs
- 0.78%
- Est. flood insurance / yr
- $507 – $1,088
Fire risk 1/10 · Minimal
- Est. fire insurance / yr
- $691 – $1,283
Heat risk 7/10 · Major
- Hot days now (above 98°F)
- 7 days/yr
- Hot days in 30 yrs
- 15 days/yr
Wind risk 6/10 · Moderate
- Chance of severe wind over 30 yrs
- 27.0%
Air-quality risk 4/10 · Minor
- Unhealthy air days now
- 5 days/yr
- Unhealthy air days in 30 yrs
- 7 days/yr
Risk factors via First Street. Map © Google.
Why this score? — see what drove the B- grade
The composite is a weighted blend of 9 inputs, each scored 0–100. Each bar is that input's sub-score; the figure is the points it added to the 100-point composite (weight × sub-score).
- Cash flow +27.3/30.0
- DSCR +9.5/10.0
- ARV discount +7.5/15.0
- 1% rule +7.4/10.0
- Schools +5.0/10.0
- Condition / age +4.2/5.0
- Livability +3.8/5.0
- Rent growth +2.5/5.0
- Appreciation +0.0/10.0
$10,800,000
🖨 Deal sheet 📄 Offer letter ✓ Due diligence
Multi-family units
County records classify this as Multi-Family (5+ Unit). Listing-text estimate: 43 units. confirmed
5+ unit building — per-unit beds/baths from public records are typically unavailable; the breakdown below (if shown) is an estimate from the listing text.
Listing remarks
PRESENTING AN AMAZING OPPORTUNITY TO OWN A 43 UNIT - NOT RENT STABILIZED ! ALL BRICK U SHAPE GARDEN STYLE APARTMENT BUILDING COMPLEX! WITH 39 PARKING SPACES ON PROPERTY! High Income * Gross Income: $1,007,460. Total Expense: $283,000. Net Income: $724,460 yearly. THIS SPECTACULAR ALL BRICK 27,152 FT² BUILDING FEATURES: 3 YR YOUNG ROOF, A 6YR YOUNG STATE OF THE ART HEATING SYSTEM, AND A LARGE 6,000 SQ FT. BASEMENT WITH LAUNDRY AREA ON A 200' × 180' LOT . THE BUILDING CONSIST OF 1 LARGE 1ST FLOOR OFFICE, 13 TWO BEDROOMS APARTMENTS, 17 ONE BEDROOMS APARTMENTS AND 12 STUDIO APARTMENTS. UTILIZE THE ADVANTAGES OF BEING PART OF NEW YORK CITY YET LOCATED IN THE BEAUTIFUL BOROUGH OF S
Key facts
- 43 unit all brick
- Large basement
- 0.74 acre lot
Tags
Property features AI
Finance
- Other: Property type: Residential; Total building area reported: 27,152 sq ft; Tax amount reported
- Financial info: Rent income reported: 83,955; Financing options considered: exchange, bank mortgage, cash
Exterior
- Parking: Community drive parking; Defined parking area
- Utilities: 220V electrical service with circuit breakers; Gas hot water; Gas heating
- Home design: Detached residential building; 3 levels (rooms and baths reported by level)
- Construction: Brick construction; Shingle roof; Poured concrete foundation; Building footprint approximately 21,840 sq ft; Building dimensions approximately 168.00 x 130.00
- Exterior features: Other yard (see remarks); Lot size is irregular; Zoning: R3A
Interior
- Bedrooms: 22 bedrooms on level 1; 18 bedrooms on level 2; 3 bedrooms on level 3
- Flooring: Hardwood floors
- Bathrooms: 43 full bathrooms; 1 half bathroom; 19 baths on level 1; 21 baths on level 2; 3 baths on level 3
- Heating & cooling: Gas heating; Baseboard heat; Hot water heat; 220V electrical service with circuit breakers
- Interior features: Laundry area; Full basement; Hardwood floors; No AC units reported
- Laundry & utility: Card-operated laundry in building; Gas hot water
Neighborhood map
What this means for you Summary
Snapshot
- This is a 43 × 43-bed/?-bath units multifamily listed at $10.80M. Condition is rated good.
Deal economics
- At list price, monthly cash flow is $31k ($373k/yr) — positive. Per door: $722/mo.
- The deal already cash-flows at list — no discount required.
- Meets the 1% rule at list price ($134k rent vs $10.80M).
- Recommended offer: $10.15M (6.0% below list) — sets the bar for market timing.
- Cap rate 9.8% vs local median 2.6% in New York — top-decile yield for the area; either an underpriced asset or a hidden risk that comps aren't pricing in. Stress-test before assuming the spread holds.
Location & tenants
- Location reads 75/100 on livability (#268 in NY, #4,188 nationally) — a middle-class / working-renter tenant base. Strengths: amenities A+, commute A+, health & safety A; Watch: crime F, cost of living F.
- Market conditions: 69 active listings in the ZIP; 480 units permitted in Richmond County in 2024 (22 in 5+ unit buildings).
Forward outlook
- Local home prices are declining (-3.0%/yr); year-one equity from $75k of loan paydown is wiped out by about $324k of value loss. Plan a longer hold.
- Richmond County population projected to shrink 5% by 2050 — rents likely to lag national; underwrite the cash flow, not the appreciation.
- At projected returns (-3.0% appreciation + 3.0% rent growth), your $3.02M cash investment doubles in ~10 years — after that, you're playing with house money.
Negotiation context
- It's been on market 80 days — a 6% lower offer ($10.15M) is reasonable based on typical stale-listing flexibility.
- 4 sale attempts since 6y ago with the ask held roughly flat each time — persistent listings suggest the price (not the market) is what's stuck; bring a comps-based counter.
Risks & watch-outs
- Watch-outs: flood insurance adds $66/mo.
- Climate carrying-cost: severe flood risk; major wind risk, 27% chance of damaging wind over 30y; extreme-heat days projected 7→15/yr by 2055 (HVAC capex compounding) — expect insurance premiums to compound above CPI over the hold.
Questions for the listing agent
- It's been on market 80 days. Have you received any prior offers? Is the seller open to a 6% concession, seller financing, or rate buy-down credit?
- Can we see the unit-by-unit rent roll, current vacancy, and any below-market leases? What's the average tenancy length?
- What capital expenditures (roof, boiler, parking lot, exteriors) have been made in the last 5 years, and what's planned in the next 2?
- Built in 1971 — when were the roof, HVAC, electrical panel, plumbing, and water heater last replaced?
- What's the actual annual flood-insurance premium (NFIP or private), and is the property in a SFHA with mandatory coverage?
- Why hasn't it sold? Are there any deal-killer items the seller is aware of (foundation, flood, title, zoning, code violations)?
- Is there a deadline driving the sale (1031 exchange, divorce, estate, relocation)? That informs how much negotiation room exists.
- Schools are B-rated — typically a magnet for longer-tenancy family renters. What's the average tenant stay here, and is there a school-zone premium baked into asking?
- Crime grade is F in this area — have there been break-ins, vandalism, or insurance claims at this property in the last 3 years? What carrier currently insures it and at what premium?
- What's the average days-on-market for RENTAL listings here right now (not sales)? A rising rental-DOM trend means longer vacancies and softer asking-rent achievability than the comps imply.
- What's the recent tenant-quality profile in this submarket — average credit score on applications, eviction rate, late-payment / NSF rate, and stable-employment percentage? A property-management company in the area should have these aggregated.
- How much new apartment / multifamily construction is in the pipeline within 1–3 miles? Heavy new supply (>2% of stock underway) typically softens rents 12–24 months out; light construction supports rent growth.
Investment metrics
- 1% rule
- 1.24% ✓
- Cap rate
- 9.75%
- Cash-on-cash
- 12.35%
- DSCR
- 1.55
- GRM
- 6.7
CMA / ARV
No comps found within radius.
Projected returns pro-forma
-3.0% appreciation · 3.0% rent growth · sell at horizon
- IRR
- 2.0%
- Equity multiple
- 1.08×
- Total profit
- $229,571
- Equity at exit
- $1,610,315
- IRR
- 11.6%
- Equity multiple
- 1.91×
- Total profit
- $2,754,721
- Equity at exit
- $933,787
Cash invested: $3,024,000 (down + closing). Projections, not guarantees.
Landlord ↔ Tenant lean methodology
- Overall (CITY)
- 0 Strongly Tenant-Friendly
- State New York
- 15 Strongly Tenant-Friendly · D+10
- County
- — inherits STATE
- City New York
- 0 Strongly Tenant-Friendly · D+34
ZIP-level market 10302
- Home prices YoY
- -31.0%
- Active inventory
- 69
- Price-to-rent
- 289.1×
Monthly cashflow live
- Estimated rent
- $133,864 medium interval (Pro) →
- Mortgage (P&I)
- −$56,636
- Tax est. 1.5%
- −$13,500 /mo · $162,000/yr
- Insurance
- −$4,500
- Flood insurance flood zone
- −$66 /mo · $798/yr
- HOA
- −$0
- Vacancy / Maint / Mgmt
- −$28,111
- Net cashflow
- $31,050
Break-even live
43-unit breakdown (identical units grouped — click to expand)
| Units | Beds | Baths | Est. rent |
|---|---|---|---|
| 43× units | 43 | — | $133,859 |
| #1 | 43 | — | $3,113 |
| #2 | 43 | — | $3,113 |
| #3 | 43 | — | $3,113 |
| #4 | 43 | — | $3,113 |
| #5 | 43 | — | $3,113 |
| #6 | 43 | — | $3,113 |
| #7 | 43 | — | $3,113 |
| #8 | 43 | — | $3,113 |
| #9 | 43 | — | $3,113 |
| #10 | 43 | — | $3,113 |
| #11 | 43 | — | $3,113 |
| #12 | 43 | — | $3,113 |
| #13 | 43 | — | $3,113 |
| #14 | 43 | — | $3,113 |
| #15 | 43 | — | $3,113 |
| #16 | 43 | — | $3,113 |
| #17 | 43 | — | $3,113 |
| #18 | 43 | — | $3,113 |
| #19 | 43 | — | $3,113 |
| #20 | 43 | — | $3,113 |
| #21 | 43 | — | $3,113 |
| #22 | 43 | — | $3,113 |
| #23 | 43 | — | $3,113 |
| #24 | 43 | — | $3,113 |
| #25 | 43 | — | $3,113 |
| #26 | 43 | — | $3,113 |
| #27 | 43 | — | $3,113 |
| #28 | 43 | — | $3,113 |
| #29 | 43 | — | $3,113 |
| #30 | 43 | — | $3,113 |
| #31 | 43 | — | $3,113 |
| #32 | 43 | — | $3,113 |
| #33 | 43 | — | $3,113 |
| #34 | 43 | — | $3,113 |
| #35 | 43 | — | $3,113 |
| #36 | 43 | — | $3,113 |
| #37 | 43 | — | $3,113 |
| #38 | 43 | — | $3,113 |
| #39 | 43 | — | $3,113 |
| #40 | 43 | — | $3,113 |
| #41 | 43 | — | $3,113 |
| #42 | 43 | — | $3,113 |
| #43 | 43 | — | $3,113 |
| Total (43 units) | $133,864 | ||
UW: 25.0% down · 7.5% · 30yr · 1.5% tax · 5.0% vac · 8.0% maint · 8.0% mgmt
Financing live
Cash to close
- Down payment
- $2,700,000
- Closing costs
- $324,000
- Reserves months
- —
- Total cash needed
- —
Loan-product check · same deal, 3 products live
Conventional
25% down · 7.5% · 30yr
- Down + closing
- —
- Monthly P&I
- —
- Monthly cashflow
- —
- DSCR
- —
- Eligible?
- —
Personal DTI + credit; lowest rate.
DSCR
20% down · 8.5% · 30yr
- Down + closing
- —
- Monthly P&I
- —
- Monthly cashflow
- —
- DSCR
- —
- Eligible?
- —
No personal income docs; deal must DSCR.
Hard money
10% down · 12.0% · 12mo
- Down + closing
- —
- Monthly P&I
- —
- Monthly cashflow
- —
- DSCR
- —
- Eligible?
- —
Short-term bridge; refi at stabilization.
Listing history 21 events
-
2026-06-18days on market $10,800,000 Active 80 DOM
-
2026-06-17days on market $10,800,000 Active 79 DOM
-
2026-06-15days on market $10,800,000 Active 77 DOM
-
2026-06-13days on market $10,800,000 Active 75 DOM
-
2026-06-10days on market $10,800,000 Active 71 DOM
-
2026-06-08days on market $10,800,000 Active 70 DOM
-
2026-06-08days on market $10,800,000 Active 69 DOM
-
2026-06-04days on market $10,800,000 Active 66 DOM
-
2026-06-03days on market $10,800,000 Active 65 DOM
-
2026-06-01days on market $10,800,000 Active 63 DOM
-
2026-05-31days on market $10,800,000 Active 62 DOM
-
2026-03-30$10,800,000 Active
-
2023-03-27historical
-
2022-09-30price $10,999,999
-
2022-06-10price $11,100,000
-
2022-03-24$10,999,999 Active
-
2022-03-14historical
-
2021-09-09$11,500,000 Active
-
2020-10-28historical
-
2020-09-09price $13,400,000
-
2020-07-01$13,900,000 Active
ⓘ Source: listings_history table (triggers on properties + properties_extension) + one-shot
backfill from property_details.listing_events for pre-trigger history.
Climate risk First Street
- Flood 8/10 Severe FEMA zone X (unshaded) · 78% chance over 30 yrs
- Wildfire 1/10 Low
- Heat 7/10 Severe 7 d/yr ≥98°F today · 15 d/yr by 30 yrs out
- Wind 6/10 Major 27% chance of damaging wind over 30 yrs
- Air quality 4/10 Moderate 5 unhealthy d/yr today · 7 by 30 yrs out
Nearby sold comps map
Loading sold comps map…
Walkable amenities ~0.75 mi
Loading nearby amenities…
Taxation est. · year 1
- Rental income
- $1,606,368
- − Mortgage interest
- −$604,968
- − Property taxes
- −$162,000
- − Insurance
- −$54,798
- − Repairs & maintenance
- −$128,509
- − Management
- −$128,509
- − Depreciation
- −$314,182
- Taxable income
- $213,402
- Est. tax owed @ 24.0%
- −$51,216
- After-tax cash flow
- $321,380/yr
For passive investors: Depreciation is non-cash, so a rental often shows a tax loss while cash-flowing — sheltering income. Rental losses are passive: they offset passive income freely, and up to $25,000/yr can offset ordinary (W-2) income if you actively participate and your MAGI is under $100k (phasing out to $0 by $150k); unused losses carry forward. On sale, claimed depreciation is recaptured at up to 25%, and gains may owe capital-gains tax (a 1031 exchange can defer both). Figures are a year-1 estimate at your 24.0% rate — not tax advice; consult a CPA.
Condition & rehab AI · 12 photos
This multi-family property is in good condition with no visible repairs or maintenance needed. Painting and landscaping can further enhance its curb appeal and value.
Value-add opportunities
- Both Painting the exterior and interior walls — Painting can enhance the curb appeal and interior aesthetics, making the property more attractive to potential buyers and renters.
- Both Landscaping the front yard — Landscaping can improve the curb appeal and add value to the property, making it more attractive to potential buyers and renters.
Renovation cost estimate screening
Value-add ROI direction
- Both Painting the exterior and interior walls — Painting can enhance the curb appeal and interior aesthetics, making the property more attractive to potential buyers and renters. ↑
- Both Landscaping the front yard — Landscaping can improve the curb appeal and add value to the property, making it more attractive to potential buyers and renters. ↑
ⓘ Cost ranges are severity-bucket heuristics (US national rule-of-thumb). Get contractor quotes + a written scope before underwriting a rehab budget.
Schools (NCES district)
No district data.
Livability — New York
- Score
- 75/100
- State rank
- #268
- US rank
- #4188
Category grades
Schools grade is shown separately in the Schools card above.
Census & demographics
- Census place
- New York, NY
- City population
- 7,731,280
- Population (ZIP)
- 19,693
Population outlook (Richmond County) Hauer SSP2
- Today (2025)
- 482,784 people
- By 2030
- 481,831 · -0.2%
- By 2040
- 473,159 · -2.0%
- By 2050
- 457,242 · -5.3%
- By 2075
- 408,029 · -15.5%
- By 2100
- 341,459 · -29.3%
Race, ethnicity, and origin ACS 2023
- Neighborhood character
- Diverse neighborhood (Simpson 0.69)
- Race & ethnicity
- Hispanic / Latino 43% White 27% Black 21% Two or more races 15% Asian 6% Native American 2%
- Hispanic origin (detail)
- Mexican 23% Puerto Rican 11% Dominican 4%
- Common ancestry
- Lithuanian 1% Romanian 1% Portuguese 1%
- Foreign-born
- 28% · Canada, China, Jamaica
- Languages at home
- 58% English-only · Spanish 29% Other Indo-European 3% Arabic 2%
Political lean MEDSL · Richmond
- 2024 margin
- Strong R (+29.8) · D 35.1% · R 64.9%
- 2008→2024 swing
- -25.7pp toward R · 2008: -4.0pp · 2024: -29.8pp
- All cycles
- 2024: R+29.8 2020: R+14.9 2016: R+16.8 2012: D+0.8 2008: R+4.0
Not yet ingested
- Civics
- —
Market trends
- HPI YoY
- ▼ -153.26%
- Current HPI
- 340.4458
- Rent YoY
- —
- Metro
- —
- State GDP YoY
- ▲ 2.60%
- F500 in state
- 92
Industry mix (Fortune 500 HQ in NY)
| Industry | F500 HQs | Revenue |
|---|---|---|
| Financial Services | 10 | $950B |
|
||
| Consumer Goods | 9 | $162B |
|
||
| Insurance | 4 | $225B |
|
||
| Telecommunications | 2 | $144B |
|
||
| Pharmaceuticals | 2 | $112B |
|
||
| Media / Entertainment | 2 | $69B |
|
||
Price history
-22.3% since first listed10 events — show timeline
- 2026-03-30 Listed $10,800,000 BNYMLS
- 2023-03-27 Listing Removed — OneKey® MLS as Distributed by MLS Grid
- 2022-09-30 Price Changed $10,999,999 BNYMLS
- 2022-06-10 Price Changed $11,100,000 BNYMLS
- 2022-03-24 Listed $10,999,999 OneKey® MLS as Distributed by MLS Grid
- 2022-03-14 Listing Removed — SIBORMLS
- 2021-09-09 Listed $11,500,000 SIBORMLS
- 2020-10-28 Listing Removed — SIBORMLS
- 2020-09-09 Price Changed $13,400,000 SIBORMLS
- 2020-07-01 Listed $13,900,000 SIBORMLS
Cash-flow waterfall
monthlySold comps — $/sqft
last 12 mo · ≤1 miLoading sold comps…