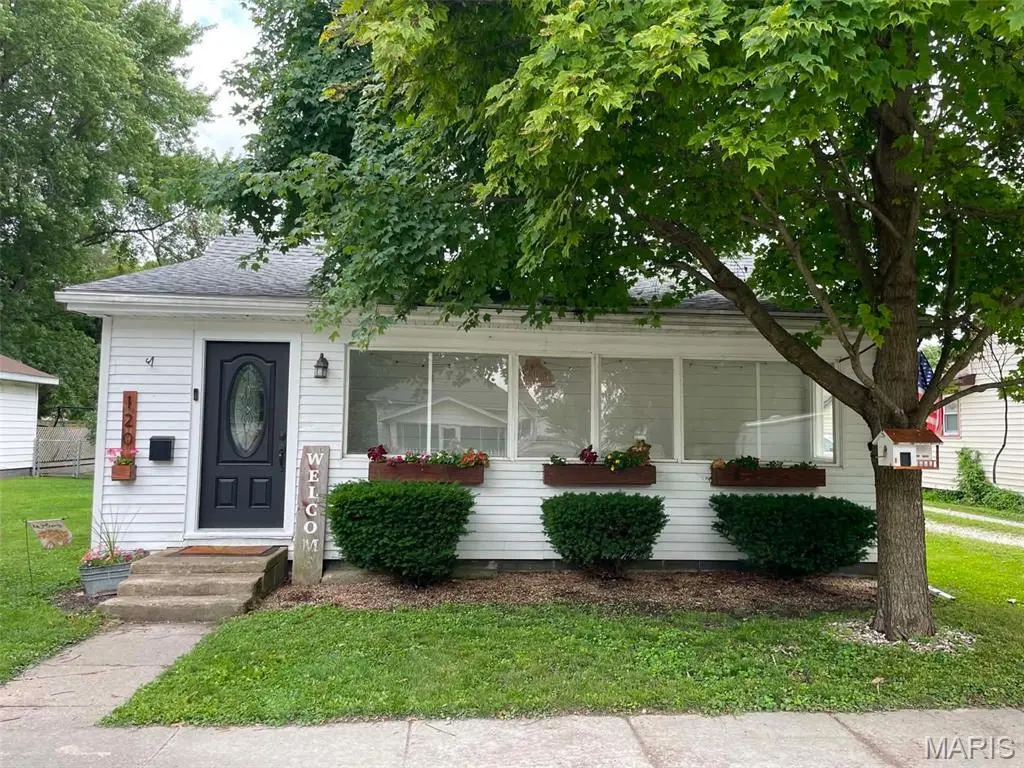
120 E Warren St · Moweaqua, IL
Flood risk 1/10 · Minimal
- FEMA flood zone
- —
- Chance of flooding over 30 yrs
- 0.0%
- Est. flood insurance / yr
- —
Fire risk 1/10 · Minimal
- Est. fire insurance / yr
- $804 – $1,492
Heat risk 4/10 · Minor
- Hot days now (above 105°F)
- 7 days/yr
- Hot days in 30 yrs
- 19 days/yr
Wind risk 2/10 · Minimal
- Chance of severe wind over 30 yrs
- 2.0%
Air-quality risk 4/10 · Minor
- Unhealthy air days now
- 3 days/yr
- Unhealthy air days in 30 yrs
- 6 days/yr
Risk factors via First Street. Map © Google.
Why this score? — see what drove the D grade
The composite is a weighted blend of 9 inputs, each scored 0–100. Each bar is that input's sub-score; the figure is the points it added to the 100-point composite (weight × sub-score).
- Cash flow +12.0/30.0
- Appreciation +8.4/10.0
- ARV discount +7.3/15.0
- DSCR +3.6/10.0
- 1% rule +3.3/10.0
- Livability +3.2/5.0
- Rent growth +2.5/5.0
- Condition / age +2.5/5.0
- Schools +1.5/10.0
$145,000
🖨 Deal sheet (PDF) 📄 Offer letter ✓ Due diligence
Listing remarks MLS
Moweaqua- Central A&M Schools and 3 bedroom home. This is a great home with large living room, large bedrooms with 1 and 1/2 baths. This home has some bonus features like the enclosed front porch and a carport that would be good for storage or use for outdoor entertaining as a covered patio. Close to downtown and old city Route 51. This is the home you have been waiting home at a price that will not dent the budget. So many possibilities in this home. Call today and have your financing ready. See HUDhomestore.com for bidding timelines and seller addenda.
Key facts
- New flooring
- Patio area
- Cathedral ceiling
Tags
Property features AI
Finance
- Other: Above-grade finished area reported by assessor
- Financial info: Lease not considered; Second mortgage: no
- HOA & community: Community has park, playground, restaurant access, sidewalks, and street lights
Exterior
- Parking: Off-street parking
- Utilities: Public water; Public sewer; 220 volts electric; Cable available; Phone available
- Home design: Single family residence; One level; House
- Construction: Vinyl siding; Architectural shingle roof; Block foundation; Built (year source: Assessor)
- Exterior features: Back yard; Asphalt road frontage on a city street
Interior
- Kitchen: Dishwasher; Microwave; Electric oven; Refrigerator; Eat-in kitchen
- Bedrooms: 3 bedrooms, all on the main level
- Bathrooms: 1 full bathroom on the main level
- Heating & cooling: Forced air heating (natural gas); Central air conditioning
- Interior features: Breakfast bar; Eat-in kitchen; Wood window frames; Electric fireplace (1)
- Laundry & utility: Washer; Dryer
Neighborhood map
What this means for you Summary
Snapshot
- This is a 3-bed/1.5-bath single-family listed at $145k.
Deal economics
- At list price, monthly cash flow is $-33 ($-399/yr) — negative.
- To cash-flow at today's rent, offer at most $139k (4.0% below list).
- To meet the 1% rule (rent ≥ 1% of price), the offer needs to be $120k (16.9% below list).
- Recommended offer: $120k (16.9% below list) — sets the bar for 1% rule.
Location & tenants
- Location reads 65/100 on livability (#616 in IL) — a middle-class / working-renter tenant base. Strengths: cost of living A+, housing A+, crime A; Watch: amenities F, commute F, health & safety F.
- Central A & M CUD 21 (rural): math 13% / reading 20% proficiency, ranked #477 of 620 in IL (top 77%) — low school quality limits family demand, transient renter base, plan for 1-2y turnover.
- Zoned schools: Gregory Intermediate (math 22% / reading 22%, grade F, #940 of 2,056 statewide, top 49%, 192 students, 0% FRL); Central A & M Middle School (math 8% / reading 17%, grade F, #550 of 665 statewide, top 84%, 168 students, 0% FRL); Central A & M High School (math 12% / reading 22%, grade F, #430 of 693 statewide, top 66%, 225 students, 0% FRL) — zoned schools average 0% FRL vs 32% district-wide (32 pts lower); this property's tenant base skews higher-income than the district average.
- Market conditions: 19 active listings in the ZIP; 41 units permitted in Shelby County in 2024 (0 in 5+ unit buildings).
Forward outlook
- In year one you build about $11k of equity ($1k loan paydown + $10k appreciation (6.7% local appreciation)).
- Shelby County population projected at -22% by 2050 — secular population decline; favor cash flow + early exit over multi-decade hold.
- At projected returns (6.7% appreciation + 3.0% rent growth), your $41k cash investment doubles in ~4 years — after that, you're playing with house money.
- By year 4, paydown + projected appreciation supports a ~$37k cash-out refi (75% LTV) — recoverable capital for the next deal without selling this one.
Negotiation context
- It's been on market 16 days — a 2% lower offer ($143k) is reasonable based on typical stale-listing flexibility.
- 6 sale attempts since 17y ago with the ask held roughly flat each time — persistent listings suggest the price (not the market) is what's stuck; bring a comps-based counter.
- Current owner paid $92k; list at $145k implies a 57% gain — meaningful room to come down on a strong offer.
Risks & watch-outs
- Watch-outs: built in 1910 — expect roof / HVAC / electrical / plumbing capex.
Questions for the listing agent
- What do current leases actually rent for vs. the listed asking? Can we see a recent rent roll and the last 12 months of T-12 income?
- Built in 1910 — when were the roof, HVAC, electrical panel, plumbing, and water heater last replaced?
- Is there a deadline driving the sale (1031 exchange, divorce, estate, relocation)? That informs how much negotiation room exists.
- Schools are F-rated, which usually means shorter tenancies and higher turnover. Who's the typical renter profile here, and what's been the actual vacancy rate?
- The area grade is low — what's the realistic commute time and amenity access for the typical tenant pool here? Any planned neighborhood developments (good or bad) we should know about?
- What's the average days-on-market for RENTAL listings here right now (not sales)? A rising rental-DOM trend means longer vacancies and softer asking-rent achievability than the comps imply.
- What's the recent tenant-quality profile in this submarket — average credit score on applications, eviction rate, late-payment / NSF rate, and stable-employment percentage? A property-management company in the area should have these aggregated.
- How much new for-sale + rental construction is in the pipeline within 1–3 miles? Heavy new supply typically softens prices + rents 12–24 months out; constrained supply supports both.
Investment metrics
- 1% rule
- 0.83% ✗
- Cap rate
- 6.02%
- Cash-on-cash
- -0.98%
- DSCR
- 0.96
- GRM
- 10.0
CMA / ARV
- ARV (on-the-fly)
- $144,228
- Comps found
- 12
Show comp detail 12 sales within ~0.75 mi
| Address | Dist | Beds/Ba | Sqft | Sold | Price | $/sf | Match |
|---|---|---|---|---|---|---|---|
| 321 South St | 0.21mi | 3/1.0 | 1,316 (-8%) | 0mo | $137,500 | $104 | 75 |
| 320 Elm St | 0.34mi | 3/1.5 | 1,500 (+5%) | 4mo | $143,000 | $95 | 72 |
| 317 S Plum St | 0.12mi | 4/3.0 (+1) | 1,470 (+3%) | 9mo | $45,000 | $31 | 71 |
| 330 E Locust St | 0.42mi | 3/1.5 | 1,522 (+7%) | 1mo | $162,000 | $106 | 69 |
| 101 Oak St | 0.44mi | 3/1.0 | 1,440 (+1%) | 14mo | $16,000 | $11 | 64 |
| 317 E South St | 0.19mi | 3/2.0 | 1,296 (-9%) | 17mo | $140,000 | $108 | 60 |
| 310 Bohlen St | 0.39mi | 3/2.5 | 1,468 (+3%) | 19mo | $285,000 | $194 | 57 |
| 222 N East St | 0.51mi | 3/1.0 | 1,400 (-2%) | 21mo | $90,000 | $64 | 53 |
| 330 S East St | 0.33mi | 2/1.5 (-1) | 1,514 (+6%) | 20mo | $128,000 | $85 | 53 |
| 429 N Shelby St | 0.60mi | 2/1.5 (-1) | 1,269 (-11%) | 6mo | $154,900 | $122 | 43 |
| 504 Putnam St | 0.61mi | 3/1.0 | 1,235 (-14%) | 10mo | $70,000 | $57 | 39 |
| 256 Madison St | 0.43mi | 2/1.0 (-1) | 1,280 (-10%) | 21mo | $129,900 | $101 | 39 |
Match score weights: distance 35% · size 25% · config 20% · recency 20%. Top-matched comps best support the ARV.
Projected returns pro-forma
6.72% appreciation · 3.0% rent growth · sell at horizon
- IRR
- 16.3%
- Equity multiple
- 2.13×
- Total profit
- $46,066
- Equity at exit
- $97,865
- IRR
- 16.0%
- Equity multiple
- 4.34×
- Total profit
- $135,787
- Equity at exit
- $183,577
Cash invested: $40,600 (down + closing). Projections, not guarantees.
Landlord ↔ Tenant lean methodology
- Overall (STATE)
- 43 Moderately Tenant-Leaning
- State Illinois
- 43 Moderately Tenant-Leaning · D+7
- County
- — inherits STATE
- City
- — inherits STATE
ZIP-level market 62550
- Home prices YoY
- 3.5%
- Active inventory
- 19
- Price-to-rent
- 10.0×
Monthly cashflow live
- Estimated rent
- $1,204 medium interval (Pro) →
- Mortgage (P&I)
- −$760
- Tax from tax record
- −$164 /mo · $1,966/yr
- Insurance
- −$60
- HOA
- −$0
- Vacancy / Maint / Mgmt
- −$253
- Net cashflow
- $-33
Break-even live
Sensitivity live
| Price | -10% $49 | -5% $8 | +0% $-33 | +5% $-74 | +10% $-115 |
|---|---|---|---|---|---|
| Rent | -10% $-128 | -5% $-81 | +0% $-33 | +5% $14 | +10% $62 |
| Rate | -1.0pp $40 | -0.5pp $4 | base $-33 | +0.5pp $-71 | +1.0pp $-109 |
UW: 25.0% down · 7.5% · 30yr · 1.5% tax · 5.0% vac · 8.0% maint · 8.0% mgmt
Financing live
Cash to close
- Down payment
- $36,250
- Closing costs
- $4,350
- Reserves months
- —
- Total cash needed
- —
Loan-product check · same deal, 3 products live
Conventional
25% down · 7.5% · 30yr
- Down + closing
- —
- Monthly P&I
- —
- Monthly cashflow
- —
- DSCR
- —
- Eligible?
- —
Personal DTI + credit; lowest rate.
DSCR
20% down · 8.5% · 30yr
- Down + closing
- —
- Monthly P&I
- —
- Monthly cashflow
- —
- DSCR
- —
- Eligible?
- —
No personal income docs; deal must DSCR.
Hard money
10% down · 12.0% · 12mo
- Down + closing
- —
- Monthly P&I
- —
- Monthly cashflow
- —
- DSCR
- —
- Eligible?
- —
Short-term bridge; refi at stabilization.
Listing history 13 events
-
2026-06-21days on market $145,000 Active 16 DOM
-
2026-06-19days on market $145,000 Active 14 DOM
-
2026-06-18days on market $145,000 Active 13 DOM
-
2026-06-17days on market $145,000 Active 12 DOM
-
2026-06-16days on market $145,000 Active 11 DOM
-
2026-06-15days on market $145,000 Active 10 DOM
-
2026-06-14days on market $145,000 Active 8 DOM
-
2026-06-13days on market $145,000 Active 7 DOM
-
2026-06-10days on market $145,000 Active 5 DOM
-
2026-06-09days on market $145,000 Active 4 DOM
-
2026-06-08days on market $145,000 Active 3 DOM
-
2026-06-07remarks 699-char remark
-
2026-06-07$145,000 Active 2 DOM
ⓘ Source: listings_history table (triggers on properties + properties_extension) + one-shot
backfill from property_details.listing_events for pre-trigger history.
Tax reassessment forecast IL · Partial reset (capped growth)
- Current annual tax
- $1,966 · $164/mo
- Projected year-2 tax
- $2,629 · $219/mo
- Expected delta
- +$663/yr (+$55/mo · 33.7%)
ⓘ Screening estimate from a state-policy table — verify with the county assessor before closing.
Climate risk First Street
- Flood 1/10 Low 0% chance over 30 yrs
- Wildfire 1/10 Low
- Heat 4/10 Moderate 7 d/yr ≥105°F today · 19 d/yr by 30 yrs out
- Wind 2/10 Low 2% chance of damaging wind over 30 yrs
- Air quality 4/10 Moderate 3 unhealthy d/yr today · 6 by 30 yrs out
Nearby sold comps map
Loading sold comps map…
Walkable amenities ~0.75 mi
Loading nearby amenities…
Taxation est. · year 1
- Rental income
- $14,452
- − Mortgage interest
- −$8,122
- − Property taxes
- −$1,966
- − Insurance
- −$725
- − Repairs & maintenance
- −$1,156
- − Management
- −$1,156
- − Depreciation
- −$4,218
- Taxable loss
- −$2,892
- Est. tax savings @ 24.0%
- +$694
- After-tax cash flow
- $295/yr
For passive investors: Depreciation is non-cash, so a rental often shows a tax loss while cash-flowing — sheltering income. Rental losses are passive: they offset passive income freely, and up to $25,000/yr can offset ordinary (W-2) income if you actively participate and your MAGI is under $100k (phasing out to $0 by $150k); unused losses carry forward. On sale, claimed depreciation is recaptured at up to 25%, and gains may owe capital-gains tax (a 1031 exchange can defer both). Figures are a year-1 estimate at your 24.0% rate — not tax advice; consult a CPA.
Schools (NCES district)
- District
- Central A & M CUD 21
- NCES district ID
- 1709100
- Math proficiency
- 13% ▼ -5.00%
- Reading proficiency
- 20% ▼ -7.00%
- Median HH income
- $50,388
- Composite
- 15.02/100
- National rank
- #9357
- State rank
- #477 of 620 in IL
Livability — Moweaqua
- Score
- 65/100
- State rank
- #616
- US rank
- #12660
Category grades
Schools grade is shown separately in the Schools card above.
Census & demographics
- Census place
- Moweaqua, IL
- Population (ZIP)
- 3,070
Population outlook (Shelby County) Hauer SSP2
- Today (2025)
- 20,512 people
- By 2030
- 19,675 · -4.1%
- By 2040
- 17,851 · -13.0%
- By 2050
- 15,973 · -22.1%
- By 2075
- 11,799 · -42.5%
- By 2100
- 8,030 · -60.9%
Race, ethnicity, and origin ACS 2023
- Neighborhood character
- Predominantly White (94%)
- Race & ethnicity
- White 94% Hispanic / Latino 3% Two or more races 2% Native American 1%
- Common ancestry
- Iranian 3% Slovak 3% Lithuanian 2%
- Foreign-born
- 0%
- Languages at home
- 98% English-only · Spanish 1%
Political lean MEDSL · Shelby
- 2024 margin
- Solid R (+60.2) · D 19.2% · R 79.5% · Other 1.4%
- 2008→2024 swing
- -40.5pp toward R · 2008: -19.8pp · 2024: -60.2pp
- All cycles
- 2024: R+60.2 2020: R+57.2 2016: R+54.3 2012: R+33.7 2008: R+19.8
Not yet ingested
- Civics
- —
Market trends
- HPI YoY
- ▲ 6.72%
- Current HPI
- 197.0448
- Rent YoY
- —
- Metro
- —
- State GDP YoY
- ▲ 1.59%
- F500 in state
- 60
Industry mix (Fortune 500 HQ in IL)
| Industry | F500 HQs | Revenue |
|---|---|---|
| Insurance | 4 | $201B |
|
||
| Consumer Goods | 4 | $87B |
|
||
| Industrial Machinery | 3 | $64B |
|
||
| Healthcare | 2 | $55B |
|
||
| Retail / Pharmacy | 1 | $148B |
|
||
| Agriculture / Food | 1 | $86B |
|
||
Price history
+222.9% since first listed15 events — show timeline
- 2026-06-05 Listed $145,000 MARIS as Distributed by MLS Grid
- 2023-09-19 Sold (Public Records) $92,500 Public Records
- 2022-08-24 Listing Removed — MRED as Distributed by MLS Grid
- 2022-08-24 Relisted — MRED as Distributed by MLS Grid
- 2022-08-19 Listing Removed — MRED as Distributed by MLS Grid
- 2020-04-01 Sold (Public Records) $64,000 Public Records
- 2019-06-17 Listed — MRED as Distributed by MLS Grid
- 2018-01-25 Sold (MLS) — CIBR
- 2018-01-25 Sold (MLS) — MRED as Distributed by MLS Grid
- 2017-12-18 Listed $13,000 CIBR
- 2017-12-18 Listed $13,000 MRED as Distributed by MLS Grid
- 2009-08-16 Sold (Public Records) $69,900 Public Records
- 2009-04-15 Sold (Public Records) $42,000 Public Records
- 2009-04-10 Sold (MLS) — MRED as Distributed by MLS Grid
- 2009-03-25 Listed $44,900 MRED as Distributed by MLS Grid
Property tax history
+9.7%/yrLatest (2024): $1,966 · +85.9% YoY. Source: county tax records.
Cash-flow waterfall
monthlySold comps — $/sqft
last 12 mo · ≤1 miLoading sold comps…