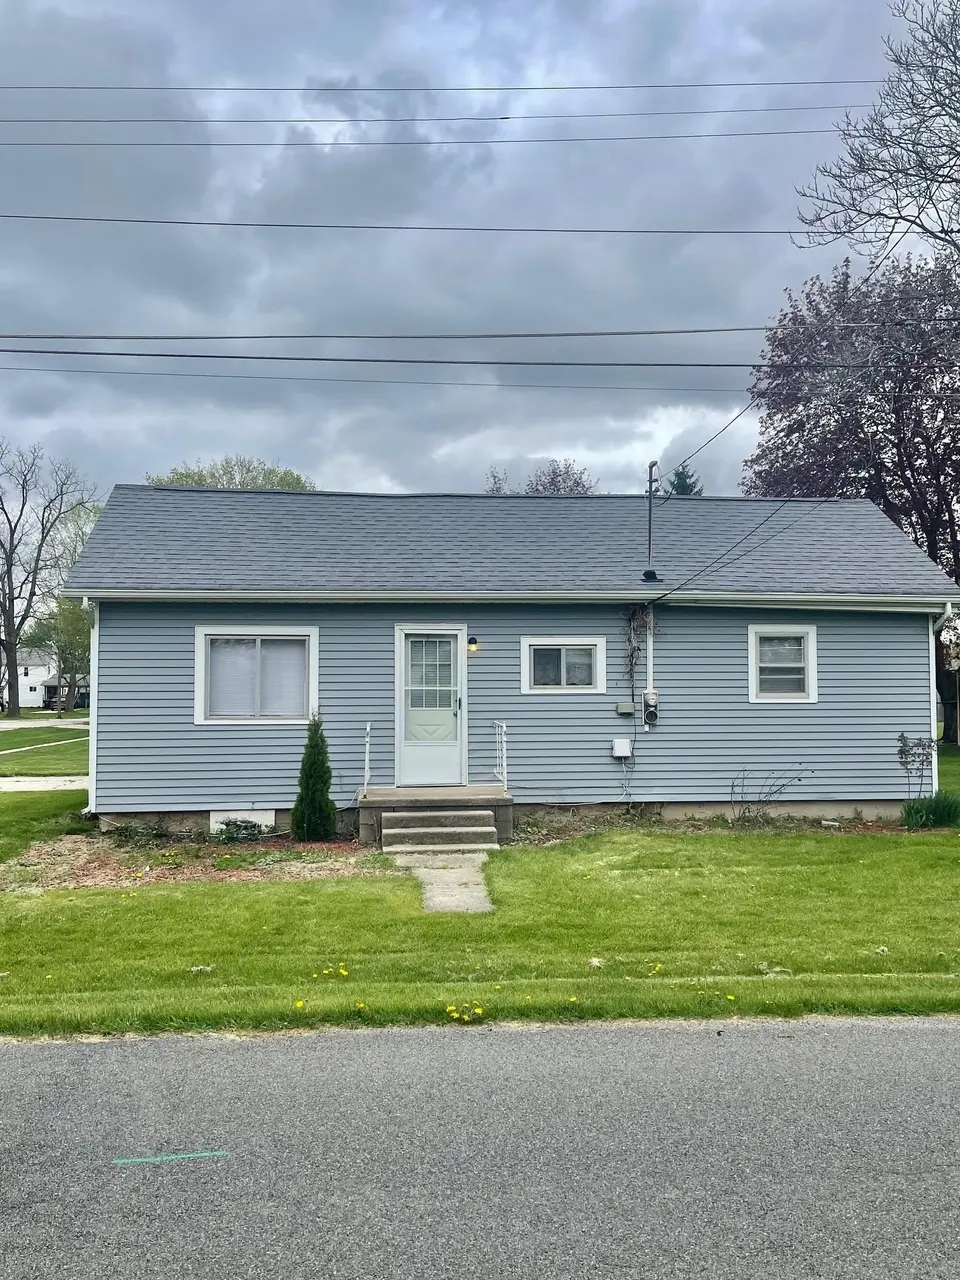
154 S Yates St · Pewamo, MI
Flood risk 1/10 · Minimal
- FEMA flood zone
- X (unshaded)
- Chance of flooding over 30 yrs
- 0.0%
- Est. flood insurance / yr
- $507 – $1,088
Fire risk 1/10 · Minimal
- Est. fire insurance / yr
- $784 – $1,456
Heat risk 2/10 · Minimal
- Hot days now (above 97°F)
- 7 days/yr
- Hot days in 30 yrs
- 15 days/yr
Wind risk 2/10 · Minimal
- Chance of severe wind over 30 yrs
- —
Air-quality risk 2/10 · Minimal
- Unhealthy air days now
- 1 days/yr
- Unhealthy air days in 30 yrs
- 2 days/yr
Risk factors via First Street. Map © Google.
Why this score? — see what drove the D grade
The composite is a weighted blend of 9 inputs, each scored 0–100. Each bar is that input's sub-score; the figure is the points it added to the 100-point composite (weight × sub-score).
- Cash flow +9.6/30.0
- ARV discount +7.5/15.0
- Appreciation +7.1/10.0
- Schools +5.4/10.0
- Livability +3.4/5.0
- DSCR +2.7/10.0
- Rent growth +2.5/5.0
- Condition / age +2.5/5.0
- 1% rule +2.3/10.0
$109,900
🖨 Deal sheet (PDF) 📄 Offer letter ✓ Due diligence
Listing remarks MLS
Welcome Home! You must check out this super cute one bedroom home situated on a beautiful corner lot in the award winning Pewamo Westphalia school district. Located next to schools, church and quiet neighborhood. Great starter home or for those looking to downsize. Handicap ramp on rear of home by car port. Nice size storage shed for all your gardening tools. New carpeting in the bedroom, vinyl plank flooring in the living room. Everything you need conveniently located on one level.
Key facts
- 4,792 sq ft lot
- Garage
- Built 1950
Property features AI
Finance
- HOA & community: Homeowners association present
Exterior
- Parking: Carport; 1-car garage
- Utilities: Public water; Public sewer
- Home design: Single-family residence; One story
- Construction: Vinyl siding
- Exterior features: Lot approximately 50 x 99 (0.11 acre); No pool
Interior
- Bathrooms: 1 full bathroom
- Heating & cooling: Forced air heating (natural gas); No central air conditioning
- Interior features: Crawl space basement; Total of 5 rooms
Neighborhood map
What this means for you Summary
Snapshot
- This is a 1-bed/1.0-bath manufactured listed at $110k.
Deal economics
- At list price, monthly cash flow is $-75 ($-900/yr) — negative.
- To cash-flow at today's rent, offer at most $97k (12.1% below list).
- To meet the 1% rule (rent ≥ 1% of price), the offer needs to be $80k (27.2% below list).
- Recommended offer: $80k (27.2% below list) — sets the bar for 1% rule.
Location & tenants
- Location reads 67/100 on livability (#384 in MI) — a middle-class / working-renter tenant base. Strengths: cost of living A+, housing A+, employment B; Watch: crime D+, amenities F, commute F.
- Pewamo-Westphalia Community Schools (rural): math 57% / reading 67% proficiency, ranked #34 of 540 in MI (top 6%) — acceptable for families but not a draw, mixed tenant base, ~2y average lease; only 18% free/reduced lunch — higher-income household profile.
- Zoned schools: Pewamowestphalia Elementary School (math 62% / reading 72%, grade B+, #105 of 1,397 statewide, top 9%, 190 students, 40% FRL); Pewamowestphalia Middlehigh School (math 56% / reading 66%, grade C+, #68 of 713 statewide, top 10%, 468 students, 14% FRL).
- Market conditions: 1 active listings in the ZIP; 1 comparable units currently listed for rent nearby; 94 units permitted in Ionia County in 2024 (0 in 5+ unit buildings).
Forward outlook
- In year one you build about $5k of equity ($760 loan paydown + $5k appreciation (4.3% local appreciation)).
- Ionia County population projected to shrink 8% by 2050 — rents likely to lag national; underwrite the cash flow, not the appreciation.
- At projected returns (4.3% appreciation + 3.0% rent growth), your $31k cash investment doubles in ~6 years — after that, you're playing with house money.
- By year 7, paydown + projected appreciation supports a ~$35k cash-out refi (75% LTV) — recoverable capital for the next deal without selling this one.
Negotiation context
- It's been on market 34 days — a 3% lower offer ($107k) is reasonable based on typical stale-listing flexibility.
- 7 sale attempts since 10y ago with the ask held roughly flat each time — persistent listings suggest the price (not the market) is what's stuck; bring a comps-based counter.
- Current owner paid $39k; list at $110k implies a 180% gain — meaningful room to come down on a strong offer.
Risks & watch-outs
- Watch-outs: built in 1950 — expect roof / HVAC / electrical / plumbing capex.
Questions for the listing agent
- What do current leases actually rent for vs. the listed asking? Can we see a recent rent roll and the last 12 months of T-12 income?
- It's been on market 34 days. Have you received any prior offers? Is the seller open to a 27% concession, seller financing, or rate buy-down credit?
- Built in 1950 — when were the roof, HVAC, electrical panel, plumbing, and water heater last replaced?
- Is there a deadline driving the sale (1031 exchange, divorce, estate, relocation)? That informs how much negotiation room exists.
- Schools are A-rated — typically a magnet for longer-tenancy family renters. What's the average tenant stay here, and is there a school-zone premium baked into asking?
- Crime grade is D in this area — have there been break-ins, vandalism, or insurance claims at this property in the last 3 years? What carrier currently insures it and at what premium?
- The area grade is low — what's the realistic commute time and amenity access for the typical tenant pool here? Any planned neighborhood developments (good or bad) we should know about?
- What's the average days-on-market for RENTAL listings here right now (not sales)? A rising rental-DOM trend means longer vacancies and softer asking-rent achievability than the comps imply.
- What's the recent tenant-quality profile in this submarket — average credit score on applications, eviction rate, late-payment / NSF rate, and stable-employment percentage? A property-management company in the area should have these aggregated.
- How much new for-sale + rental construction is in the pipeline within 1–3 miles? Heavy new supply typically softens prices + rents 12–24 months out; constrained supply supports both.
Investment metrics
- 1% rule
- 0.73% ✗
- Cap rate
- 5.47%
- Cash-on-cash
- -2.93%
- DSCR
- 0.87
- GRM
- 11.4
CMA / ARV
No comps found within radius.
Projected returns pro-forma
4.28% appreciation · 3.0% rent growth · sell at horizon
- IRR
- 8.5%
- Equity multiple
- 1.52×
- Total profit
- $16,089
- Equity at exit
- $57,553
- IRR
- 10.5%
- Equity multiple
- 2.79×
- Total profit
- $55,035
- Equity at exit
- $95,626
Cash invested: $30,772 (down + closing). Projections, not guarantees.
Landlord ↔ Tenant lean methodology
- Overall (STATE)
- 62 Landlord-Friendly
- State Michigan
- 62 Landlord-Friendly · EVEN
- County
- — inherits STATE
- City
- — inherits STATE
ZIP-level market 48873
- Home prices YoY
- 2.3%
- Active inventory
- 1
- Price-to-rent
- 11.4×
Monthly cashflow live
- Estimated rent
- $800 medium interval (Pro) →
- Mortgage (P&I)
- −$576
- Tax from tax record
- −$85 /mo · $1,019/yr
- Insurance
- −$46
- HOA
- −$0
- Vacancy / Maint / Mgmt
- −$168
- Net cashflow
- $-75
Break-even live
Sensitivity live
| Price | -10% $-13 | -5% $-44 | +0% $-75 | +5% $-106 | +10% $-137 |
|---|---|---|---|---|---|
| Rent | -10% $-138 | -5% $-107 | +0% $-75 | +5% $-43 | +10% $-12 |
| Rate | -1.0pp $-20 | -0.5pp $-47 | base $-75 | +0.5pp $-104 | +1.0pp $-132 |
UW: 25.0% down · 7.5% · 30yr · 1.5% tax · 5.0% vac · 8.0% maint · 8.0% mgmt
Financing live
Cash to close
- Down payment
- $27,475
- Closing costs
- $3,297
- Reserves months
- —
- Total cash needed
- —
Loan-product check · same deal, 3 products live
Conventional
25% down · 7.5% · 30yr
- Down + closing
- —
- Monthly P&I
- —
- Monthly cashflow
- —
- DSCR
- —
- Eligible?
- —
Personal DTI + credit; lowest rate.
DSCR
20% down · 8.5% · 30yr
- Down + closing
- —
- Monthly P&I
- —
- Monthly cashflow
- —
- DSCR
- —
- Eligible?
- —
No personal income docs; deal must DSCR.
Hard money
10% down · 12.0% · 12mo
- Down + closing
- —
- Monthly P&I
- —
- Monthly cashflow
- —
- DSCR
- —
- Eligible?
- —
Short-term bridge; refi at stabilization.
Rent comps 1 comps
| Address | Beds | Baths | Sqft | Rent | $/sqft | DOM | Units | Dist |
|---|---|---|---|---|---|---|---|---|
| 140 W North St Pewamo, MI | 1.0 | 1.0 | 600 | $800 | $1.33 | 4d | 1 | 0.35mi |
Listing history 30 events
-
2026-06-07statusdays on market $109,900 Pending 34 DOM
-
2026-06-03days on market $109,900 Active 31 DOM
-
2026-06-02days on market $109,900 Active 30 DOM
-
2026-06-01days on market $109,900 Active 29 DOM
-
2026-05-31days on market $109,900 Active 28 DOM
-
2026-05-30pricedays on market $109,900 Active 27 DOM
-
2026-05-03$114,900 Active
Show marketing remark (488 chars)
Welcome Home! You must check out this super cute one bedroom home situated on a beautiful corner lot in the award winning Pewamo Westphalia school district. Located next to schools, church and quiet neighborhood. Great starter home or for those looking to downsize. Handicap ramp on rear of home by car port. Nice size storage shed for all your gardening tools. New carpeting in the bedroom, vinyl plank flooring in the living room. Everything you need conveniently located on one level.
-
2026-05-03$114,900 Active 488-char remark
Show marketing remark (488 chars)
Welcome Home! You must check out this super cute one bedroom home situated on a beautiful corner lot in the award winning Pewamo Westphalia school district. Located next to schools, church and quiet neighborhood. Great starter home or for those looking to downsize. Handicap ramp on rear of home by car port. Nice size storage shed for all your gardening tools. New carpeting in the bedroom, vinyl plank flooring in the living room. Everything you need conveniently located on one level.
-
2026-02-11historical
-
2026-01-20price $105,000
-
2026-01-19price $105,000
-
2026-01-19price $105,000
-
2026-01-07price $109,000
-
2026-01-07price $109,000
-
2026-01-07price $109,000
-
2025-12-06price $115,000
-
2025-12-05price $115,000
-
2025-12-05price $115,000
-
2025-11-20price $118,000
-
2025-11-19price $118,000
-
2025-11-19price $118,000
-
2025-11-05status Active
-
2025-11-04historical
-
2025-11-03$120,000 Active
-
2025-11-03$120,000 Active
-
2016-11-16soldstatus $39,250
-
2016-11-14soldstatus $39,250
-
2016-11-14soldstatus $39,250
-
2016-07-25$44,900
-
2016-07-25$44,900
ⓘ Source: listings_history table (triggers on properties + properties_extension) + one-shot
backfill from property_details.listing_events for pre-trigger history.
Tax reassessment forecast MI · Partial reset (capped growth)
- Current annual tax
- $1,019 · $85/mo
- Projected year-2 tax
- $1,356 · $113/mo
- Expected delta
- +$337/yr (+$28/mo · 33.0%)
ⓘ Screening estimate from a state-policy table — verify with the county assessor before closing.
Climate risk First Street
- Flood 1/10 Low FEMA zone X (unshaded) · 0% chance over 30 yrs
- Wildfire 1/10 Low
- Heat 2/10 Low 7 d/yr ≥97°F today · 15 d/yr by 30 yrs out
- Wind 2/10 Low
- Air quality 2/10 Low 1 unhealthy d/yr today · 2 by 30 yrs out
Nearby sold comps map
Loading sold comps map…
Walkable amenities ~0.75 mi
Loading nearby amenities…
Taxation est. · year 1
- Rental income
- $9,600
- − Mortgage interest
- −$6,156
- − Property taxes
- −$1,019
- − Insurance
- −$550
- − Repairs & maintenance
- −$768
- − Management
- −$768
- − Depreciation
- −$3,197
- Taxable loss
- −$2,858
- Est. tax savings @ 24.0%
- +$686
- After-tax cash flow
- $-215/yr
For passive investors: Depreciation is non-cash, so a rental often shows a tax loss while cash-flowing — sheltering income. Rental losses are passive: they offset passive income freely, and up to $25,000/yr can offset ordinary (W-2) income if you actively participate and your MAGI is under $100k (phasing out to $0 by $150k); unused losses carry forward. On sale, claimed depreciation is recaptured at up to 25%, and gains may owe capital-gains tax (a 1031 exchange can defer both). Figures are a year-1 estimate at your 24.0% rate — not tax advice; consult a CPA.
Schools (NCES district)
- District
- Pewamo-Westphalia Community Schools
- NCES district ID
- 2627960
- Math proficiency
- 57% ▼ -3.00%
- Reading proficiency
- 67% ▼ -2.00%
- Median HH income
- $61,321
- Composite
- 53.78/100
- National rank
- #1419
- State rank
- #34 of 540 in MI
Livability — Pewamo
- Score
- 67/100
- State rank
- #384
- US rank
- #10231
Category grades
Schools grade is shown separately in the Schools card above.
Census & demographics
- Census place
- Pewamo, MI
- Population (ZIP)
- 1,371
Population outlook (Ionia County) Hauer SSP2
- Today (2025)
- 63,958 people
- By 2030
- 63,321 · -1.0%
- By 2040
- 61,544 · -3.8%
- By 2050
- 58,682 · -8.2%
- By 2075
- 48,909 · -23.5%
- By 2100
- 35,867 · -43.9%
Race, ethnicity, and origin ACS 2023
- Neighborhood character
- Predominantly White (98%)
- Race & ethnicity
- White 98% Two or more races 1%
- Common ancestry
- Iranian 2% Romanian 1% Lithuanian 1%
- Foreign-born
- 1%
- Languages at home
- 98% English-only · German/W. Germanic 2%
Political lean MEDSL · Ionia
- 2024 margin
- Solid R (+31.9) · D 33.3% · R 65.2% · Other 1.5%
- 2008→2024 swing
- -26.0pp toward R · 2008: -5.8pp · 2024: -31.9pp
- All cycles
- 2024: R+31.9 2020: R+30.3 2016: R+31.0 2012: R+12.8 2008: R+5.8
Not yet ingested
- Civics
- —
Market trends
- HPI YoY
- ▲ 4.28%
- Current HPI
- 188.9528
- Rent YoY
- —
- Metro
- —
- State GDP YoY
- ▲ 1.37%
- F500 in state
- 28
Industry mix (Fortune 500 HQ in MI)
| Industry | F500 HQs | Revenue |
|---|---|---|
| Automotive Parts | 3 | $48B |
|
||
| Automotive | 2 | $372B |
|
||
| Chemicals | 1 | $45B |
|
||
| Automotive Retail | 1 | $29B |
|
||
| Healthcare / Medical Devices | 1 | $23B |
|
||
| Automotive Technology | 1 | $20B |
|
||
Price history
+155.9% since first listed24 events — show timeline
- 2026-05-03 Listed $114,900 REALCOMP
- 2026-05-03 Listed $114,900 MiRealSource-MiMLS
- 2026-02-11 Listing Removed — MiRealSource-MiMLS
- 2026-01-20 Price Changed $105,000 MiRealSource-MiMLS
- 2026-01-19 Price Changed $105,000 REALCOMP
- 2026-01-19 Price Changed $105,000 SW Michigan MLS
- 2026-01-07 Price Changed $109,000 MiRealSource-MiMLS
- 2026-01-07 Price Changed $109,000 REALCOMP
- 2026-01-07 Price Changed $109,000 SW Michigan MLS
- 2025-12-06 Price Changed $115,000 MiRealSource-MiMLS
- 2025-12-05 Price Changed $115,000 REALCOMP
- 2025-12-05 Price Changed $115,000 SW Michigan MLS
- 2025-11-20 Price Changed $118,000 MiRealSource-MiMLS
- 2025-11-19 Price Changed $118,000 REALCOMP
- 2025-11-19 Price Changed $118,000 SW Michigan MLS
- 2025-11-05 Relisted — REALCOMP
- 2025-11-04 Listing Removed — REALCOMP
- 2025-11-03 Listed $120,000 REALCOMP
- 2025-11-03 Listed $120,000 MiRealSource-MiMLS
- 2016-11-16 Sold (Public Records) $39,250 Public Records
- 2016-11-14 Sold (MLS) $39,250 REALCOMP
- 2016-11-14 Sold (MLS) $39,250 Greater Lansing AoR
- 2016-07-25 Listed $44,900 REALCOMP
- 2016-07-25 Listed $44,900 Greater Lansing AoR
Property tax history
+2.3%/yrLatest (2025): $1,019 · +2.9% YoY. Source: county tax records.
Cash-flow waterfall
monthlySold comps — $/sqft
last 12 mo · ≤1 miLoading sold comps…