 Duplex
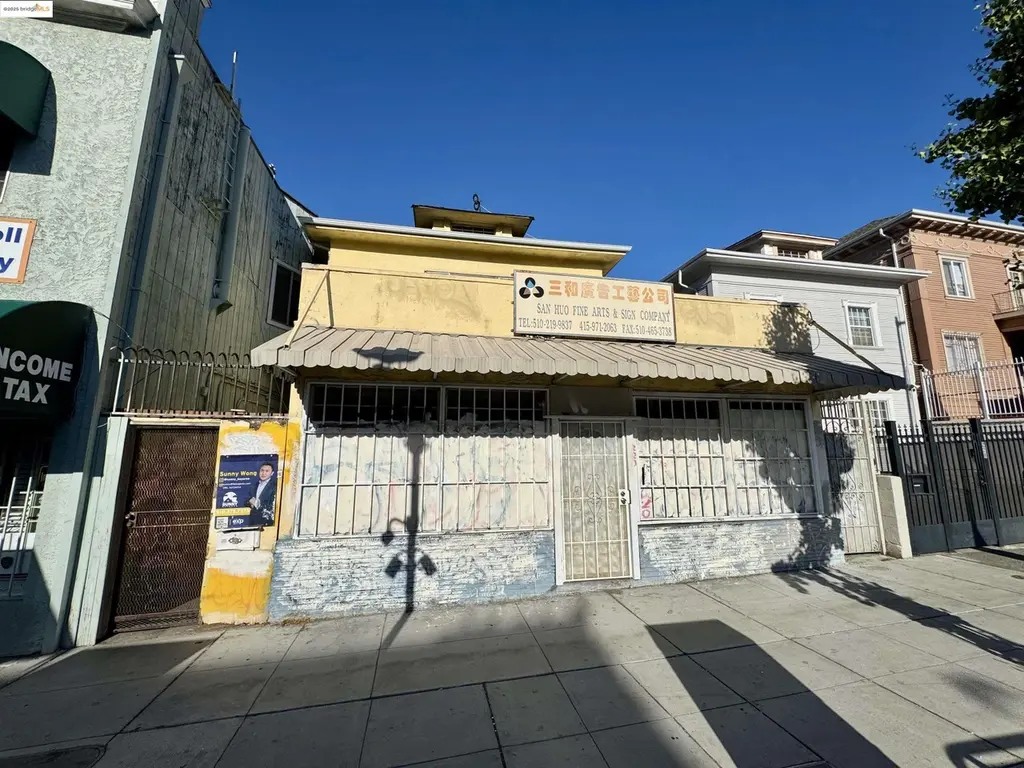
220 International Blvd · Oakland, CA
Flood risk 1/10 · Minimal
- FEMA flood zone
- X (unshaded)
- Chance of flooding over 30 yrs
- 0.0%
- Est. flood insurance / yr
- $507 – $1,088
Fire risk 1/10 · Minimal
- Est. fire insurance / yr
- $659 – $1,223
Heat risk 3/10 · Minor
- Hot days now (above 84°F)
- 7 days/yr
- Hot days in 30 yrs
- 15 days/yr
Wind risk 1/10 · Minimal
- Chance of severe wind over 30 yrs
- —
Air-quality risk 9/10 · Severe
- Unhealthy air days now
- 16 days/yr
- Unhealthy air days in 30 yrs
- 16 days/yr
Risk factors via First Street. Map © Google.
Why this score? — see what drove the D+ grade
The composite is a weighted blend of 9 inputs, each scored 0–100. Each bar is that input's sub-score; the figure is the points it added to the 100-point composite (weight × sub-score).
- ARV discount +15.0/15.0
- Cash flow +11.5/30.0
- Livability +3.6/5.0
- DSCR +3.4/10.0
- 1% rule +3.2/10.0
- Rent growth +3.0/5.0
- Schools +3.0/10.0
- Condition / age +2.5/5.0
- Appreciation +0.0/10.0
$549,000
🖨 Deal sheet (PDF) 📄 Offer letter ✓ Due diligence
Multi-family units
County records classify this as Multi-Family (2-4 Unit). Listing-text estimate: 2 units. confirmed
Listing remarks
An exceptional opportunity awaits at 220 International Blvd, Oakland - a rare mixed-use duplex featuring a ground-level storefront and a residential unit above, just one block from Lake Merritt. Perfect for investors, entrepreneurs, or owner-users, this property offers versatility, visibility, and income potential in one of Oakland's most active corridors. Located on International Blvd, a major thoroughfare with strong foot and vehicle traffic, this building benefits from proximity to Chinatown, Jack London Square, Lake Merritt BART Station, and easy I-880 freeway access. The surrounding area features established businesses, new housing developments, and a growing retail scene, ensuring con
Key facts
- Strong foot traffic
- Income potential
- Residential unit
Tags
Property features AI
Finance
- Financial info: Two-unit property (total of 2 units)
Exterior
- Utilities: Separate electric and gas meters
- Home design: Duplex residential income property; Built in 1908; Zoned CR/M
- Construction: Stucco exterior
- Exterior features: Back yard
Interior
- Flooring: Tile; Wood
- Bathrooms: Each unit has 1 bathroom
- Heating & cooling: Wall furnace heating; No air conditioning
- Interior features: Tile and wood flooring; Dining room in both units
Neighborhood map
What this means for you Summary
Snapshot
- This is a 2 × 1-bed/1-bath units multifamily listed at $549k.
Deal economics
- At list price, monthly cash flow is $-178 ($-2k/yr) — negative. Per door: $-89/mo.
- To cash-flow at today's rent, offer at most $518k (5.7% below list).
- To meet the 1% rule (rent ≥ 1% of price), the offer needs to be $450k (18.1% below list).
- Recommended offer: $450k (18.1% below list) — sets the bar for 1% rule.
- Cap rate 5.9% vs local median 2.5% in Oakland — top-decile yield for the area; either an underpriced asset or a hidden risk that comps aren't pricing in. Stress-test before assuming the spread holds.
Location & tenants
- Location reads 71/100 on livability (#224 in CA) — a middle-class / working-renter tenant base. Strengths: amenities A+, commute A+, employment A+; Watch: crime F, cost of living F.
- Oakland Unified (urban): math 27% / reading 33% proficiency, ranked #1,007 of 1,400 in CA (top 72%) — families likely to look elsewhere, expect single-tenant / working-renter base with shorter leases; 68% free/reduced lunch — lower-income household profile, screen leases tightly.
- Zoned schools: La Escuelita (272 students, 91% FRL); Westlake Middle (314 students, 87% FRL); Oakland High (1,531 students, 88% FRL) — zoned schools average 89% FRL vs 68% district-wide (20 pts higher); higher-poverty schools than district average — tighter screening recommended.
- Market conditions: Rents rising (+1.9%/yr); 127 active listings in the ZIP; 23 comparable units currently listed for rent nearby; rentals leasing fast (median 1d on market — plan ~1-2 weeks tenant-placement turnaround); 1,742 units permitted in Alameda County in 2024 (856 in 5+ unit buildings).
- At $4,499/mo this rent would consume 74% of the median local household income ($72k/yr) (locally 3757% of renters already pay >50% of income on rent) — very limited rent-growth headroom before tenants either downsize or default.
Forward outlook
- Local home prices are declining (-3.0%/yr); year-one equity from $4k of loan paydown is wiped out by about $16k of value loss. Plan a longer hold.
- Alameda County population projected at +34% by 2050 — long-run rental-demand tailwind backs the buy-and-hold thesis.
Negotiation context
- Only 9 days on market — expect competitive offers; lowballing is unlikely to land.
- 2 sale attempts with the ask held roughly flat each time — persistent listings suggest the price (not the market) is what's stuck; bring a comps-based counter.
- Current owner paid $265k; list at $549k implies a 107% gain — meaningful room to come down on a strong offer.
Risks & watch-outs
- Watch-outs: built in 1908 — expect roof / HVAC / electrical / plumbing capex.
Questions for the listing agent
- What do current leases actually rent for vs. the listed asking? Can we see a recent rent roll and the last 12 months of T-12 income?
- Can we see the unit-by-unit rent roll, current vacancy, and any below-market leases? What's the average tenancy length?
- What capital expenditures (roof, boiler, parking lot, exteriors) have been made in the last 5 years, and what's planned in the next 2?
- Built in 1908 — when were the roof, HVAC, electrical panel, plumbing, and water heater last replaced?
- Is there a deadline driving the sale (1031 exchange, divorce, estate, relocation)? That informs how much negotiation room exists.
- Crime grade is F in this area — have there been break-ins, vandalism, or insurance claims at this property in the last 3 years? What carrier currently insures it and at what premium?
- The area grade is low — what's the realistic commute time and amenity access for the typical tenant pool here? Any planned neighborhood developments (good or bad) we should know about?
- What's the average days-on-market for RENTAL listings here right now (not sales)? A rising rental-DOM trend means longer vacancies and softer asking-rent achievability than the comps imply.
- What's the recent tenant-quality profile in this submarket — average credit score on applications, eviction rate, late-payment / NSF rate, and stable-employment percentage? A property-management company in the area should have these aggregated.
- How much new apartment / multifamily construction is in the pipeline within 1–3 miles? Heavy new supply (>2% of stock underway) typically softens rents 12–24 months out; light construction supports rent growth.
Investment metrics
- 1% rule
- 0.82% ✗
- Cap rate
- 5.90%
- Cash-on-cash
- -1.39%
- DSCR
- 0.94
- GRM
- 10.2
CMA / ARV
- ARV (median comp)
- $772,279
- List price
- $549,000
- Delta
- -26.45%
- Verdict
- UNDERPRICED
- Comps
- 20 within 1.0 mi
Show comp detail 1 sale within ~0.75 mi
| Address | Dist | Beds/Ba | Sqft | Sold | Price | $/sf | Match |
|---|---|---|---|---|---|---|---|
| 622 Alice St | 0.74mi | 5/2.0 (+1) | 1,894 (+1%) | 1mo | $800,000 | $422 | 58 |
Match score weights: distance 35% · size 25% · config 20% · recency 20%. Top-matched comps best support the ARV.
Projected returns pro-forma
-3.0% appreciation · 1.86% rent growth · sell at horizon
- IRR
- -19.8%
- Equity multiple
- 0.31×
- Total profit
- $-105,376
- Equity at exit
- $81,858
- IRR
- -15.3%
- Equity multiple
- 0.18×
- Total profit
- $-126,706
- Equity at exit
- $47,467
Cash invested: $153,720 (down + closing). Projections, not guarantees.
Landlord ↔ Tenant lean methodology
- Overall (CITY)
- 0 Strongly Tenant-Friendly
- State California
- 18 Strongly Tenant-Friendly · D+13
- County
- — inherits STATE
- City Oakland
- 0 Strongly Tenant-Friendly · D+62
ZIP-level market 94606
- Rents YoY
- 1.9%
- Active inventory
- 127
- Price-to-rent
- 20.3×
Monthly cashflow live
- Estimated rent
- $4,499 high interval (Pro) →
- Mortgage (P&I)
- −$2,879
- Tax from tax record
- −$625 /mo · $7,494/yr
- Insurance
- −$229
- HOA
- −$0
- Vacancy / Maint / Mgmt
- −$945
- Net cashflow
- $-178
Break-even live
Sensitivity live
| Price | -10% $133 | -5% $-23 | +0% $-178 | +5% $-333 | +10% $-489 |
|---|---|---|---|---|---|
| Rent | -10% $-533 | -5% $-356 | +0% $-178 | +5% $0 | +10% $177 |
| Rate | -1.0pp $98 | -0.5pp $-38 | base $-178 | +0.5pp $-320 | +1.0pp $-465 |
2-unit breakdown (identical units grouped — click to expand)
| Units | Beds | Baths | Est. rent |
|---|---|---|---|
| 2× units | 1 | 1 | $4,500 |
| #1 | 1 | 1 | $2,250 |
| #2 | 1 | 1 | $2,250 |
| Total (2 units) | $4,499 | ||
UW: 25.0% down · 7.5% · 30yr · 1.5% tax · 5.0% vac · 8.0% maint · 8.0% mgmt
Financing live
Cash to close
- Down payment
- $137,250
- Closing costs
- $16,470
- Reserves months
- —
- Total cash needed
- —
Loan-product check · same deal, 3 products live
Conventional
25% down · 7.5% · 30yr
- Down + closing
- —
- Monthly P&I
- —
- Monthly cashflow
- —
- DSCR
- —
- Eligible?
- —
Personal DTI + credit; lowest rate.
DSCR
20% down · 8.5% · 30yr
- Down + closing
- —
- Monthly P&I
- —
- Monthly cashflow
- —
- DSCR
- —
- Eligible?
- —
No personal income docs; deal must DSCR.
Hard money
10% down · 12.0% · 12mo
- Down + closing
- —
- Monthly P&I
- —
- Monthly cashflow
- —
- DSCR
- —
- Eligible?
- —
Short-term bridge; refi at stabilization.
Rent comps 23 comps
| Address | Beds | Baths | Sqft | Rent | $/sqft | DOM | Units | Dist |
|---|---|---|---|---|---|---|---|---|
| 324 International Blvd Unit 324 Oakland, CA | 3.0 | 1.5 | 1400 | $3,500 | $2.50 | 26d | 1 | 0.09mi |
| 324 International Blvd Unit 324 Oakland, CA | 3.0 | 1.5 | 1400 | $3,500 | $2.50 | 1d | 1 | 0.09mi |
| 1200 Lakeshore Ave Oakland, CA | 1.0–3.0 | 1.5–2.5 | 1332 | $10,245 | $7.69 | 0d | 11 | 0.13mi |
| 460 Stow Ave Oakland, CA | 4.0 | 2.5 | 2118 | $4,900 | $2.31 | 0d | 1 | 0.48mi |
| 238 13th St Oakland, CA | 3.0 | 1.0–2.0 | 1039 | $4,380 | $4.22 | 0d | 13 | 0.61mi |
| 260 Brooklyn Basin Way Oakland, CA | 3.0 | 1.0–2.0 | 939 | $4,554 | $4.85 | 0d | 11 | 0.65mi |
| 2203 8th Ave Unit 2 Oakland, CA | 4.0 | 2.0 | 1300 | $3,100 | $2.38 | 6d | 1 | 0.66mi |
| 37 8th Ave Oakland, CA | 3.0 | 1.0–2.0 | 963 | $4,675 | $4.85 | 0d | 17 | 0.74mi |
| 1100 Webster St Oakland, CA | 3.0 | 1.0–2.0 | 958 | $5,000 | $5.22 | 0d | 9 | 0.75mi |
| 527 Merritt Ave Oakland, CA | 3.0 | 2.0 | 1530 | $4,800 | $3.14 | 3d | 1 | 0.80mi |
| 529 Merritt Ave Oakland, CA | 3.0 | 2.0 | 1380 | $4,500 | $3.26 | 19d | 1 | 0.80mi |
| 520 Van Buren Ave Oakland, CA | 1.0–3.0 | 1.0–2.0 | 974 | $3,795 | $3.89 | 45d | 9 | 0.96mi |
| 1950 Broadway Oakland, CA | 4.0 | 1.0–2.0 | 737 | $6,907 | $9.37 | 0d | 53 | 0.99mi |
| 2016 Telegraph Ave Oakland, CA | 3.0 | 1.0–3.0 | 1026 | $6,749 | $6.58 | 0d | 7 | 1.09mi |
| 500 William St Oakland, CA | 3.0 | 1.0–2.0 | 1108 | $4,654 | $4.20 | 0d | 16 | 1.14mi |
| 482 Jean St Oakland, CA | 3.0 | 2.0 | 1595 | $4,800 | $3.01 | 25d | 1 | 1.22mi |
| 1015 Martin Luther King Junior Way Unit B2 Oakland, CA | 4.0 | 2.0 | 1800 | $1,000 | $0.56 | 45d | 1 | 1.25mi |
| 1015 Martin Luther King Junior Way Oakland, CA | 4.0 | 2.0 | 1800 | $1,300 | $0.72 | 45d | 1 | 1.26mi |
| 668 21st St Oakland, CA | 2.0–3.0 | 1.0–2.0 | 1112 | $2,233 | $2.01 | 45d | 1 | 1.26mi |
| 621 Calmar Ave Oakland, CA | 3.0 | 2.0 | 2024 | $5,529 | $2.73 | 45d | 1 | 1.28mi |
| 471 26th St Oakland, CA | 1.0–3.0 | 1.0–3.0 | 967 | $3,870 | $4.00 | 1d | 9 | 1.36mi |
| 3123 Harrison St Oakland, CA | 3.0 | 2.0 | 1450 | $3,800 | $2.62 | 7d | 1 | 1.37mi |
| 1518 Clement Ave Alameda, CA | 3.0 | 1.0–3.0 | 1108 | $5,977 | $5.39 | 0d | 19 | 1.43mi |
Listing history 21 events
-
2026-06-21days on market $549,000 Active 9 DOM
-
2026-06-18days on market $549,000 Active 6 DOM
-
2026-06-17days on market $549,000 Active 5 DOM
-
2026-06-16days on market $549,000 Active 4 DOM
-
2026-06-15days on market $549,000 Active 3 DOM
-
2026-06-13remarks 699-char remark
-
2026-06-13pricedays on market $549,000 Active 1 DOM
-
2026-06-09days on market $568,000 Active 247 DOM
-
2026-06-08days on market $568,000 Active 246 DOM
-
2026-06-07days on market $568,000 Active 245 DOM
-
2026-06-04days on market $568,000 Active 242 DOM
-
2026-06-03days on market $568,000 Active 241 DOM
-
2026-06-02days on market $568,000 Active 240 DOM
-
2026-06-01days on market $568,000 Active 239 DOM
-
2026-05-31days on market $568,000 Active 238 DOM
-
2026-05-07price $580,000 1325-char remark
-
2026-03-20price $597,000 1325-char remark
-
2025-11-11price $698,000 1325-char remark
-
2025-10-05$750,000 Active 1325-char remark
-
2002-03-26soldstatus $265,000
-
1978-03-30soldstatus $57,000
ⓘ Source: listings_history table (triggers on properties + properties_extension) + one-shot
backfill from property_details.listing_events for pre-trigger history.
Tax reassessment forecast CA · Resets to sale price
- Current annual tax
- $7,494 · $625/mo
- Projected year-2 tax
- $7,494 · $625/mo
- Expected delta
- $0/yr ($0/mo · 0.0%)
ⓘ Screening estimate from a state-policy table — verify with the county assessor before closing.
Climate risk First Street
- Flood 1/10 Low FEMA zone X (unshaded) · 0% chance over 30 yrs
- Wildfire 1/10 Low
- Heat 3/10 Moderate 7 d/yr ≥84°F today · 15 d/yr by 30 yrs out
- Wind 1/10 Low
- Air quality 9/10 Extreme 16 unhealthy d/yr today · 16 by 30 yrs out
Nearby sold comps map
Loading sold comps map…
Walkable amenities ~0.75 mi
Loading nearby amenities…
Taxation est. · year 1
- Rental income
- $53,988
- − Mortgage interest
- −$30,753
- − Property taxes
- −$7,494
- − Insurance
- −$2,745
- − Repairs & maintenance
- −$4,319
- − Management
- −$4,319
- − Depreciation
- −$15,971
- Taxable loss
- −$11,613
- Est. tax savings @ 24.0%
- +$2,787
- After-tax cash flow
- $650/yr
For passive investors: Depreciation is non-cash, so a rental often shows a tax loss while cash-flowing — sheltering income. Rental losses are passive: they offset passive income freely, and up to $25,000/yr can offset ordinary (W-2) income if you actively participate and your MAGI is under $100k (phasing out to $0 by $150k); unused losses carry forward. On sale, claimed depreciation is recaptured at up to 25%, and gains may owe capital-gains tax (a 1031 exchange can defer both). Figures are a year-1 estimate at your 24.0% rate — not tax advice; consult a CPA.
Schools (NCES district)
- District
- Oakland Unified
- NCES district ID
- 0628050
- Math proficiency
- 27% ▬ 0.00%
- Reading proficiency
- 33% ▬ 0.00%
- Median HH income
- $55,194
- Composite
- 29.52/100
- National rank
- #11769
- State rank
- #1007 of 1400 in CA
Livability — Oakland
- Score
- 71/100
- State rank
- #224
- US rank
- #7245
Category grades
Schools grade is shown separately in the Schools card above.
Census & demographics
- Census place
- Oakland, CA
- County
- Alameda County · 1,614,355 people
- City population
- 385,993
- Metro
- San Francisco-Oakland-Berkeley, CA
- Population (ZIP)
- 39,966
- Household income
- $72,470
- Rent vs Own
- Severe rent burden
- 3757.0
Population outlook (Alameda County) Hauer SSP2
- Today (2025)
- 1,928,884 people
- By 2030
- 2,069,146 · +7.3%
- By 2040
- 2,338,405 · +21.2%
- By 2050
- 2,586,608 · +34.1%
- By 2075
- 3,061,911 · +58.7%
- By 2100
- 3,234,133 · +67.7%
Race, ethnicity, and origin ACS 2023
- Neighborhood character
- Highly diverse neighborhood (Simpson 0.77)
- Race & ethnicity
- Asian 32% Hispanic / Latino 25% White 20% Black 16% Two or more races 10% Native American 2%
- Hispanic origin (detail)
- Mexican 15%
- Common ancestry
- Italian 1% Romanian 1% Lithuanian 1%
- Foreign-born
- 38% · Canada, Vietnam, China
- Languages at home
- 47% English-only · Spanish 19% Chinese 14% Vietnamese 7%
Political lean MEDSL · Alameda
- 2024 margin
- Solid D (+53.6) · D 74.6% · R 21.0% · Other 4.4%
- 2008→2024 swing
- -5.9pp toward R · 2008: 59.5pp · 2024: 53.6pp
- All cycles
- 2024: D+53.6 2020: D+62.5 2016: D+64.4 2012: D+59.8 2008: D+59.5
Not yet ingested
- Civics
- —
Market trends
- HPI YoY
- ▼ -798.52%
- Current HPI
- 334.5111
- Rent YoY
- ▲ 1.86%
- Metro
- San Francisco-Oakland-Berkeley, CA
- State GDP YoY
- ▲ 3.21%
- F500 in state
- 116
Industry mix (Fortune 500 HQ in CA)
| Industry | F500 HQs | Revenue |
|---|---|---|
| Technology | 27 | $1,492B |
|
||
| Financial Services | 3 | $174B |
|
||
| Retail | 3 | $44B |
|
||
| Insurance | 3 | $26B |
|
||
| Media / Entertainment | 2 | $115B |
|
||
| Pharmaceuticals / Biotech | 2 | $62B |
|
||
Price history
+863.2% since first listed9 events — show timeline
- 2026-06-12 Listing Removed — bridgeMLS, Bay East AOR, or Contra Costa AOR
- 2026-06-12 Listed $549,000 bridgeMLS, Bay East AOR, or Contra Costa AOR
- 2026-05-21 Price Changed — bridgeMLS, Bay East AOR, or Contra Costa AOR
- 2026-05-07 Price Changed — bridgeMLS, Bay East AOR, or Contra Costa AOR
- 2026-03-20 Price Changed — bridgeMLS, Bay East AOR, or Contra Costa AOR
- 2025-11-11 Price Changed — bridgeMLS, Bay East AOR, or Contra Costa AOR
- 2025-10-05 Listed — bridgeMLS, Bay East AOR, or Contra Costa AOR
- 2002-03-26 Sold (Public Records) $265,000 Public Records
- 1978-03-30 Sold (Public Records) $57,000 Public Records
Property tax history
+2.5%/yrLatest (2025): $7,494 · +4.5% YoY. Source: county tax records.
Cash-flow waterfall
monthlySold comps — $/sqft
last 12 mo · ≤1 miLoading sold comps…