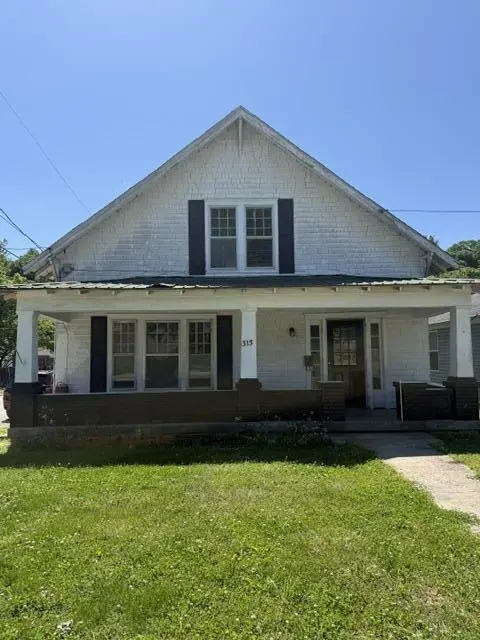
313 Holmes St · Frankfort, KY
Flood risk 6/10 · Moderate
- FEMA flood zone
- X
- Chance of flooding over 30 yrs
- 0.68%
- Est. flood insurance / yr
- $507 – $1,088
Fire risk 3/10 · Minor
- Est. fire insurance / yr
- $839 – $1,559
Heat risk 5/10 · Moderate
- Hot days now (above 103°F)
- 7 days/yr
- Hot days in 30 yrs
- 20 days/yr
Wind risk 2/10 · Minimal
- Chance of severe wind over 30 yrs
- 1.0%
Air-quality risk 2/10 · Minimal
- Unhealthy air days now
- 1 days/yr
- Unhealthy air days in 30 yrs
- 2 days/yr
Risk factors via First Street. Map © Google.
Why this score? — see what drove the B grade
The composite is a weighted blend of 9 inputs, each scored 0–100. Each bar is that input's sub-score; the figure is the points it added to the 100-point composite (weight × sub-score).
- Cash flow +30.0/30.0
- DSCR +10.0/10.0
- 1% rule +9.5/10.0
- ARV discount +7.5/15.0
- Rent growth +4.1/5.0
- Livability +3.7/5.0
- Schools +3.2/10.0
- Condition / age +2.5/5.0
- Appreciation +0.0/10.0
$110,000
🖨 Deal sheet 📄 Offer letter ✓ Due diligence
Listing remarks
Investor special! Two unit building. Downstairs is a 3 bedroom 1 bathroom unit with utility room and washer dryer hookups. Upstairs is a 1 bedroom 1 bathroom unit.
Key facts
- 3,567 sq ft lot
- Listed 20 days
Property features AI
Finance
- Other: Lot about 0.0819 acres (3,567 sq ft); Located in the Thornhill subdivision; County: Franklin
Exterior
- Utilities: Public water; Public sewer
- Home design: House / Multi-family; One and one half levels
- Construction: Wood siding construction
- Exterior features: Block foundation; Shingle roof; Wood siding
Interior
- Bedrooms: 2 total rooms (includes bedrooms and living areas)
- Flooring: Vinyl
- Bathrooms: 2 full bathrooms
- Heating & cooling: Natural gas heating; Electric cooling; Has heating
- Interior features: Vinyl flooring; Crawl space basement; No fireplace
Neighborhood map
What this means for you Summary
Snapshot
- This is a 4-bed/2.0-bath single-family listed at $110k.
Deal economics
- At list price, monthly cash flow is $612 ($7k/yr) — positive.
- The deal already cash-flows at list — no discount required.
- Meets the 1% rule at list price ($2k rent vs $110k).
- Recommended offer: $108k (1.5% below list) — sets the bar for market timing.
- Cap rate 13.0% vs local median 3.3% in Frankfort — top-decile yield for the area; either an underpriced asset or a hidden risk that comps aren't pricing in. Stress-test before assuming the spread holds.
Location & tenants
- Location reads 74/100 on livability (#111 in KY, #4,772 nationally) — a middle-class / working-renter tenant base. Strengths: cost of living A+, housing A+, crime B; Watch: employment C-, amenities F, health & safety F.
- Frankfort Independent (town): math 35% / reading 42% proficiency, ranked #45 of 165 in KY (top 27%) — families likely to look elsewhere, expect single-tenant / working-renter base with shorter leases.
- Zoned schools: Second Street School (math 30% / reading 38%, grade F, #329 of 676 statewide, top 49%, 571 students, 53% FRL); Frankfort High School (math 57% / reading 57%, grade C, #6 of 254 statewide, top 2%, 322 students, 40% FRL).
- Market conditions: Rents rising fast (+6.5%/yr); 303 active listings in the ZIP; 1 comparable units currently listed for rent nearby; 123 units permitted in Franklin County in 2024 (0 in 5+ unit buildings).
Forward outlook
- Local home prices are declining (-3.0%/yr); year-one equity from $761 of loan paydown is wiped out by about $3k of value loss. Plan a longer hold.
- Franklin County population projected at +7% by 2050 — modest demand growth; plan on rents tracking national, not racing it.
- At projected returns (-3.0% appreciation + 6.5% rent growth), your $31k cash investment doubles in ~5 years — after that, you're playing with house money.
Negotiation context
- It's been on market 21 days — a 2% lower offer ($108k) is reasonable based on typical stale-listing flexibility.
- 4 sale attempts since 11y ago with the ask held roughly flat each time — persistent listings suggest the price (not the market) is what's stuck; bring a comps-based counter.
Risks & watch-outs
- Climate carrying-cost: major flood risk; extreme-heat days projected 7→20/yr by 2055 (HVAC capex compounding) — expect insurance premiums to compound above CPI over the hold.
Questions for the listing agent
- Is there a deadline driving the sale (1031 exchange, divorce, estate, relocation)? That informs how much negotiation room exists.
- Schools are D-rated, which usually means shorter tenancies and higher turnover. Who's the typical renter profile here, and what's been the actual vacancy rate?
- What's the average days-on-market for RENTAL listings here right now (not sales)? A rising rental-DOM trend means longer vacancies and softer asking-rent achievability than the comps imply.
- What's the recent tenant-quality profile in this submarket — average credit score on applications, eviction rate, late-payment / NSF rate, and stable-employment percentage? A property-management company in the area should have these aggregated.
- How much new for-sale + rental construction is in the pipeline within 1–3 miles? Heavy new supply typically softens prices + rents 12–24 months out; constrained supply supports both.
Investment metrics
- 1% rule
- 1.45% ✓
- Cap rate
- 12.97%
- Cash-on-cash
- 23.83%
- DSCR
- 2.06
- GRM
- 5.8
CMA / ARV
- ARV (on-the-fly)
- $262,080
- Comps found
- 12
Show comp detail 12 sales within ~0.75 mi
| Address | Dist | Beds/Ba | Sqft | Sold | Price | $/sf | Match |
|---|---|---|---|---|---|---|---|
| 8 Ashmore Dr | 0.18mi | 3/1.5 (-1) | 1,700 (+1%) | 2mo | $297,000 | $175 | 80 |
| 326 Wallace Ave | 0.10mi | 3/1.0 (-1) | 1,645 (-2%) | 9mo | $130,000 | $79 | 76 |
| 3 Ashmore Dr | 0.20mi | 3/1.5 (-1) | 1,595 (-5%) | 9mo | $219,000 | $137 | 68 |
| 254 Wright St | 0.13mi | 4/2.5 | 1,585 (-6%) | 23mo | $184,000 | $116 | 63 |
| 412 Holmes St | 0.16mi | 3/2.0 (-1) | 1,572 (-6%) | 23mo | $50,000 | $32 | 58 |
| 519 Greenup Ave | 0.57mi | 3/1.0 (-1) | 1,701 (+1%) | 12mo | $190,000 | $112 | 52 |
| 310 E Fourth St | 0.73mi | 3/2.0 (-1) | 1,649 (-2%) | 10mo | $299,000 | $181 | 50 |
| 122 Oaklawn Dr | 0.66mi | 3/1.0 (-1) | 1,500 (-11%) | 6mo | $245,000 | $163 | 37 |
| 230 E 4th St | 0.74mi | 3/2.5 (-1) | 1,800 (+7%) | 22mo | $350,000 | $194 | 28 |
| 314 East 4th St | 0.73mi | 4/3.0 | 1,872 (+11%) | 23mo | $360,000 | $192 | 24 |
| 131 Oaklawn Dr | 0.61mi | 3/1.0 (-1) | 1,446 (-14%) | 19mo | $225,000 | $156 | 24 |
| 121 Compton Dr | 0.72mi | 3/2.0 (-1) | 1,902 (+13%) | 21mo | $227,500 | $120 | 22 |
Match score weights: distance 35% · size 25% · config 20% · recency 20%. Top-matched comps best support the ARV.
Projected returns pro-forma
-3.0% appreciation · 6.55% rent growth · sell at horizon
- IRR
- 20.6%
- Equity multiple
- 1.88×
- Total profit
- $26,980
- Equity at exit
- $16,401
- IRR
- 30.9%
- Equity multiple
- 4.23×
- Total profit
- $99,481
- Equity at exit
- $9,511
Cash invested: $30,800 (down + closing). Projections, not guarantees.
Landlord ↔ Tenant lean methodology
- Overall (STATE)
- 83 Strongly Landlord-Friendly
- State Kentucky
- 83 Strongly Landlord-Friendly · R+16
- County
- — inherits STATE
- City
- — inherits STATE
ZIP-level market 40601
- Home prices YoY
- -26.1%
- Rents YoY
- 6.5%
- Active inventory
- 303
- Price-to-rent
- 5.8×
Monthly cashflow live
- Estimated rent
- $1,593 medium interval (Pro) →
- Mortgage (P&I)
- −$577
- Tax from tax record
- −$24 /mo · $285/yr
- Insurance
- −$46
- HOA
- −$0
- Vacancy / Maint / Mgmt
- −$334
- Net cashflow
- $612
Break-even live
UW: 25.0% down · 7.5% · 30yr · 1.5% tax · 5.0% vac · 8.0% maint · 8.0% mgmt
Financing live
Cash to close
- Down payment
- $27,500
- Closing costs
- $3,300
- Reserves months
- —
- Total cash needed
- —
Loan-product check · same deal, 3 products live
Conventional
25% down · 7.5% · 30yr
- Down + closing
- —
- Monthly P&I
- —
- Monthly cashflow
- —
- DSCR
- —
- Eligible?
- —
Personal DTI + credit; lowest rate.
DSCR
20% down · 8.5% · 30yr
- Down + closing
- —
- Monthly P&I
- —
- Monthly cashflow
- —
- DSCR
- —
- Eligible?
- —
No personal income docs; deal must DSCR.
Hard money
10% down · 12.0% · 12mo
- Down + closing
- —
- Monthly P&I
- —
- Monthly cashflow
- —
- DSCR
- —
- Eligible?
- —
Short-term bridge; refi at stabilization.
Rent comps 1 comps
| Address | Beds | Baths | Sqft | Rent | $/sqft | DOM | Units | Dist |
|---|---|---|---|---|---|---|---|---|
| 565 Schenkel Ln Frankfort, KY | 2.0–3.0 | 1.0–2.0 | 987 | $1,235 | $1.25 | 14d | 8 | 1.42mi |
Listing history 27 events
-
2026-06-19days on market $110,000 Active 21 DOM
-
2026-06-18days on market $110,000 Active 20 DOM
-
2026-06-17days on market $110,000 Active 19 DOM
-
2026-06-16days on market $110,000 Active 18 DOM
-
2026-06-15days on market $110,000 Active 17 DOM
-
2026-06-14days on market $110,000 Active 15 DOM
-
2026-06-13status $110,000 Active 14 DOM
-
2026-06-02status $110,000 Pending 14 DOM
-
2026-06-01days on market $110,000 Active 14 DOM
-
2026-05-31days on market $110,000 Active 13 DOM
-
2026-05-30days on market $110,000 Active 12 DOM
-
2026-05-15$110,000 Active
-
2021-04-05soldstatus $250,000
-
2020-11-19historical
-
2020-09-10$239,000 Active
-
2020-08-21price $239,000
-
2019-08-15soldstatus $212,000
-
2017-12-20historical
-
2017-12-19$350 Active
-
2016-08-22soldstatus $53,000
-
2016-02-15soldstatus $15,000 Sold
-
2016-01-25status Pending
-
2016-01-18price $21,500
-
2016-01-05price $23,500
-
2015-11-06$27,500 Active
-
1987-12-23soldstatus $20,000
-
1986-01-01soldstatus $8,000
ⓘ Source: listings_history table (triggers on properties + properties_extension) + one-shot
backfill from property_details.listing_events for pre-trigger history.
Tax reassessment forecast KY · Resets to sale price
- Current annual tax
- $285 · $24/mo
- Projected year-2 tax
- $946 · $79/mo
- Expected delta
- +$661/yr (+$55/mo · 231.9%)
ⓘ Screening estimate from a state-policy table — verify with the county assessor before closing.
Climate risk First Street
- Flood 6/10 Major FEMA zone X · 68% chance over 30 yrs
- Wildfire 3/10 Moderate
- Heat 5/10 Major 7 d/yr ≥103°F today · 20 d/yr by 30 yrs out
- Wind 2/10 Low 100% chance of damaging wind over 30 yrs
- Air quality 2/10 Low 1 unhealthy d/yr today · 2 by 30 yrs out
Nearby sold comps map
Loading sold comps map…
Walkable amenities ~0.75 mi
Loading nearby amenities…
Taxation est. · year 1
- Rental income
- $19,111
- − Mortgage interest
- −$6,162
- − Property taxes
- −$285
- − Insurance
- −$550
- − Repairs & maintenance
- −$1,529
- − Management
- −$1,529
- − Depreciation
- −$3,200
- Taxable income
- $5,856
- Est. tax owed @ 24.0%
- −$1,406
- After-tax cash flow
- $5,935/yr
For passive investors: Depreciation is non-cash, so a rental often shows a tax loss while cash-flowing — sheltering income. Rental losses are passive: they offset passive income freely, and up to $25,000/yr can offset ordinary (W-2) income if you actively participate and your MAGI is under $100k (phasing out to $0 by $150k); unused losses carry forward. On sale, claimed depreciation is recaptured at up to 25%, and gains may owe capital-gains tax (a 1031 exchange can defer both). Figures are a year-1 estimate at your 24.0% rate — not tax advice; consult a CPA.
Schools (NCES district)
- District
- Frankfort Independent
- NCES district ID
- 2101980
- Math proficiency
- 35% ▼ -14.00%
- Reading proficiency
- 42% ▼ -14.00%
- Median HH income
- $35,212
- Composite
- 31.81/100
- National rank
- #5882
- State rank
- #45 of 165 in KY
Livability — Frankfort
- Score
- 74/100
- State rank
- #111
- US rank
- #4772
Category grades
Schools grade is shown separately in the Schools card above.
Census & demographics
- Census place
- Frankfort, KY
- County
- Franklin County · 51,893 people
- City population
- 51,893
- Metro
- Frankfort, KY
- Population (ZIP)
- 51,893
- Household income
- $65,732
- Rent vs Own
- Severe rent burden
- 1621.0
Population outlook (Franklin County) Hauer SSP2
- Today (2025)
- 52,996 people
- By 2030
- 54,049 · +2.0%
- By 2040
- 55,561 · +4.8%
- By 2050
- 56,677 · +6.9%
- By 2075
- 59,458 · +12.2%
- By 2100
- 58,885 · +11.1%
Race, ethnicity, and origin ACS 2023
- Neighborhood character
- Predominantly White (81%)
- Race & ethnicity
- White 81% Black 9% Two or more races 5% Hispanic / Latino 4% Asian 2%
- Common ancestry
- Italian 3% Slovak 2% Lithuanian 1%
- Foreign-born
- 4% · Canada
- Languages at home
- 94% English-only · Spanish 3% Other Asian/Pacific 1% Tagalog/Filipino 1%
Political lean MEDSL · Franklin
- 2024 margin
- Toss-up / Even · D 46.6% · R 51.4% · Other 2.0%
- 2008→2024 swing
- -4.2pp toward R · 2008: -0.6pp · 2024: -4.8pp
- All cycles
- 2024: R+4.8 2020: R+0.9 2016: R+4.6 2012: D+0.8 2008: R+0.6
Not yet ingested
- Civics
- —
Market trends
- HPI YoY
- ▼ -87.43%
- Current HPI
- 248.0324
- Rent YoY
- ▲ 6.55%
- Metro
- Frankfort, KY
- State GDP YoY
- ▲ 1.81%
- F500 in state
- 4
Industry mix (Fortune 500 HQ in KY)
| Industry | F500 HQs | Revenue |
|---|---|---|
| Healthcare | 1 | $118B |
|
||
| Food / Beverage | 1 | $7B |
|
||
Price history
+1275.0% since first listed16 events — show timeline
- 2026-05-15 Listed $110,000 ImagineMLS
- 2021-04-05 Sold (Public Records) $250,000 Public Records
- 2020-11-19 Listing Removed — ImagineMLS
- 2020-09-10 Listed $239,000 ImagineMLS
- 2020-08-21 Price Changed $239,000 ImagineMLS
- 2019-08-15 Sold (Public Records) $212,000 Public Records
- 2017-12-20 Listing Removed — ImagineMLS
- 2017-12-19 Listed $350 ImagineMLS
- 2016-08-22 Sold (Public Records) $53,000 Public Records
- 2016-02-15 Sold (MLS) $15,000 ImagineMLS
- 2016-01-25 Pending — ImagineMLS
- 2016-01-18 Price Changed $21,500 ImagineMLS
- 2016-01-05 Price Changed $23,500 ImagineMLS
- 2015-11-06 Listed $27,500 ImagineMLS
- 1987-12-23 Sold (Public Records) $20,000 Public Records
- 1986-01-01 Sold (Public Records) $8,000 Public Records
Property tax history
+4.6%/yrLatest (2025): $285 · -0.1% YoY. Source: county tax records.
Cash-flow waterfall
monthlySold comps — $/sqft
last 12 mo · ≤1 miLoading sold comps…