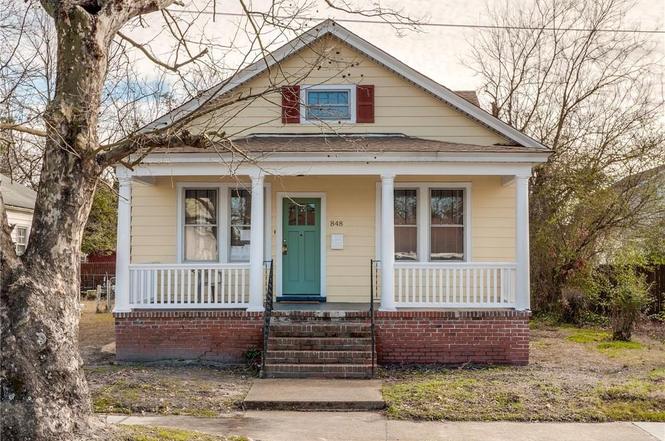
848 31st St · Newport News, VA
Flood risk 1/10 · Minimal
- FEMA flood zone
- X (unshaded)
- Chance of flooding over 30 yrs
- 0.0%
- Est. flood insurance / yr
- $507 – $1,088
Fire risk 1/10 · Minimal
- Est. fire insurance / yr
- $666 – $1,236
Heat risk 9/10 · Severe
- Hot days now (above 106°F)
- 7 days/yr
- Hot days in 30 yrs
- 16 days/yr
Wind risk 8/10 · Major
- Chance of severe wind over 30 yrs
- 80.0%
Air-quality risk 2/10 · Minimal
- Unhealthy air days now
- 1 days/yr
- Unhealthy air days in 30 yrs
- 1 days/yr
Risk factors via First Street. Map © Google.
Why this score? — see what drove the D+ grade
The composite is a weighted blend of 9 inputs, each scored 0–100. Each bar is that input's sub-score; the figure is the points it added to the 100-point composite (weight × sub-score).
- ARV discount +14.7/15.0
- Cash flow +10.9/30.0
- Appreciation +4.6/10.0
- Schools +3.8/10.0
- Livability +3.8/5.0
- DSCR +3.2/10.0
- Rent growth +3.2/5.0
- 1% rule +3.0/10.0
- Condition / age +2.5/5.0
$178,000
🖨 Deal sheet (PDF) 📄 Offer letter ✓ Due diligence
Listing remarks
Welcome to 848 31st Street Newport News! This charming 3-bedroom 1-bathroom home offers a cozy living space of 1045 square feet that has been remodeled!! Beautiful hardwood floors throughout add warmth and character throughout. The kitchen and bathroom have both been thoughtfully updated, providing modern convenience while maintaining the home's charm. Don't miss this opportunity to make this delightful home your own! Schedule a showing today!!!
Key facts
- Built 1930
- Listed 50 days
Property features AI
Finance
- HOA & community: No HOA fees indicated
Exterior
- Parking: Driveway parking; Street parking
- Utilities: City/County water; City/County sewer; Gas water heater
- Home design: Detached ranch home; Single-story
- Construction: Crawl foundation; Asphalt shingle roof
- Exterior features: Aluminum siding; Partial back chain-link fence
Interior
- Kitchen: Microwave; Electric range; Refrigerator
- Bedrooms: Master bedroom on the first floor; First floor bedroom (additional)
- Flooring: Vinyl flooring; Wood flooring
- Bathrooms: 1 full bathroom
- Heating & cooling: Natural gas heating; Central air; Heat pump
- Interior features: Ceiling fan; Scuttle access
- Laundry & utility: Washer; Dryer; Utility room
Neighborhood map
What this means for you Summary
Snapshot
- This is a 3-bed/1.0-bath single-family listed at $178k.
Deal economics
- At list price, monthly cash flow is $-77 ($-918/yr) — negative.
- To cash-flow at today's rent, offer at most $164k (7.6% below list).
- To meet the 1% rule (rent ≥ 1% of price), the offer needs to be $142k (20.0% below list).
- Recommended offer: $142k (20.0% below list) — sets the bar for 1% rule.
- Cap rate 5.8% vs local median 4.2% in Newport News — top-decile yield for the area; either an underpriced asset or a hidden risk that comps aren't pricing in. Stress-test before assuming the spread holds.
Location & tenants
- Location reads 75/100 on livability (#123 in VA, #4,018 nationally) — a middle-class / working-renter tenant base. Strengths: health & safety A+, cost of living A, housing A; Watch: crime F, commute F.
- Newport News City Public School District (urban): math 34% / reading 54% proficiency, ranked #112 of 131 in VA (top 86%) — families likely to look elsewhere, expect single-tenant / working-renter base with shorter leases.
- Zoned schools: Carver Elementary (math 14% / reading 32%, grade F, #1,066 of 1,108 statewide, top 96%, 600 students, 90% FRL); Huntington Middle (math 2% / reading 27%, grade F, #341 of 342 statewide, top 100%, 411 students, 87% FRL); Heritage High (math 49% / reading 67%, grade C, #262 of 319 statewide, top 82%, 1,111 students, 85% FRL) — zoned schools average 87% FRL vs 55% district-wide (32 pts higher); higher-poverty schools than district average — tighter screening recommended.
- Zoned-school proficiency averages 32% at this address vs 44% district-wide (-12 pts) — the specific schools serving this property underperform the Newport News City Public School District average; the district grade overstates school quality for this exact location.
- Market conditions: Rents rising (+2.9%/yr); 130 active listings in the ZIP; 40 comparable units currently listed for rent nearby; rentals at typical pace (median 25d on market — plan ~3-4 weeks tenant-placement turnaround); lower-income renter base — watch delinquency; 522 units permitted in Newport News city in 2024 (458 in 5+ unit buildings).
Forward outlook
- Local home prices are declining (-0.8%/yr); year-one equity from $1k of loan paydown is wiped out by about $1k of value loss. Plan a longer hold.
- Newport News County population projected to shrink 8% by 2050 — rents likely to lag national; underwrite the cash flow, not the appreciation.
Negotiation context
- It's been on market 50 days — a 3% lower offer ($173k) is reasonable based on typical stale-listing flexibility.
- 9 sale attempts since 10y ago; this cycle's ask has dropped $13k (7%) from the opening price — seller is motivated, your offer sets the floor, not the list.
- Current owner paid $110k; list at $178k implies a 62% gain — meaningful room to come down on a strong offer.
Risks & watch-outs
- Watch-outs: built in 1930 — expect roof / HVAC / electrical / plumbing capex.
- Climate carrying-cost: severe wind risk, 80% chance of damaging wind over 30y; extreme-heat days projected 7→16/yr by 2055 (HVAC capex compounding) — expect insurance premiums to compound above CPI over the hold.
Questions for the listing agent
- What do current leases actually rent for vs. the listed asking? Can we see a recent rent roll and the last 12 months of T-12 income?
- It's been on market 50 days. Have you received any prior offers? Is the seller open to a 20% concession, seller financing, or rate buy-down credit?
- Built in 1930 — when were the roof, HVAC, electrical panel, plumbing, and water heater last replaced?
- Is there a deadline driving the sale (1031 exchange, divorce, estate, relocation)? That informs how much negotiation room exists.
- Schools are B-rated — typically a magnet for longer-tenancy family renters. What's the average tenant stay here, and is there a school-zone premium baked into asking?
- Crime grade is F in this area — have there been break-ins, vandalism, or insurance claims at this property in the last 3 years? What carrier currently insures it and at what premium?
- The area grade is low — what's the realistic commute time and amenity access for the typical tenant pool here? Any planned neighborhood developments (good or bad) we should know about?
- What's the average days-on-market for RENTAL listings here right now (not sales)? A rising rental-DOM trend means longer vacancies and softer asking-rent achievability than the comps imply.
- What's the recent tenant-quality profile in this submarket — average credit score on applications, eviction rate, late-payment / NSF rate, and stable-employment percentage? A property-management company in the area should have these aggregated.
- How much new for-sale + rental construction is in the pipeline within 1–3 miles? Heavy new supply typically softens prices + rents 12–24 months out; constrained supply supports both.
Investment metrics
- 1% rule
- 0.80% ✗
- Cap rate
- 5.78%
- Cash-on-cash
- -1.84%
- DSCR
- 0.92
- GRM
- 10.4
CMA / ARV
- ARV (on-the-fly)
- $212,135
- Comps found
- 12
Show comp detail 12 sales within ~0.75 mi
| Address | Dist | Beds/Ba | Sqft | Sold | Price | $/sf | Match |
|---|---|---|---|---|---|---|---|
| 848 31st St | 0.00mi | 3/1.0 | 1,045 (0%) | 1mo | $175,000 | $167 | 99 |
| 731 31st St | 0.21mi | 3/1.0 | 969 (-7%) | 3mo | $200,000 | $206 | 76 |
| 643 33rd St | 0.37mi | 2/1.0 (-1) | 1,060 (+1%) | 2mo | $215,000 | $203 | 74 |
| 1141 27th St | 0.43mi | 3/1.0 | 1,000 (-4%) | 2mo | $85,000 | $85 | 71 |
| 921 26th St | 0.25mi | 2/2.0 (-1) | 1,092 (+4%) | 3mo | $225,000 | $206 | 69 |
| 4114 Roanoke Ave | 0.62mi | 3/2.0 | 1,034 (-1%) | 0mo | $249,000 | $241 | 65 |
| 641 33rd St | 0.37mi | 3/2.0 | 1,135 (+9%) | 2mo | $263,000 | $232 | 63 |
| 911 36th St | 0.29mi | 3/2.0 | 925 (-12%) | 1mo | $175,000 | $189 | 62 |
| 1239 24th St | 0.65mi | 3/1.0 | 1,000 (-4%) | 2mo | $163,000 | $163 | 61 |
| 1234 22nd St | 0.71mi | 3/1.0 | 1,100 (+5%) | 1mo | $259,000 | $235 | 58 |
| 1042 25th St | 0.39mi | 3/1.0 | 892 (-15%) | 1mo | $95,000 | $107 | 57 |
| 732 20th St | 0.63mi | 3/1.0 | 1,160 (+11%) | 4mo | $70,000 | $60 | 50 |
Match score weights: distance 35% · size 25% · config 20% · recency 20%. Top-matched comps best support the ARV.
Projected returns pro-forma
-0.84% appreciation · 2.91% rent growth · sell at horizon
- IRR
- -7.8%
- Equity multiple
- 0.66×
- Total profit
- $-17,117
- Equity at exit
- $44,334
- IRR
- -1.2%
- Equity multiple
- 0.88×
- Total profit
- $-5,860
- Equity at exit
- $47,729
Cash invested: $49,840 (down + closing). Projections, not guarantees.
Landlord ↔ Tenant lean methodology
- Overall (STATE)
- 55 Moderately Landlord-Leaning
- State Virginia
- 55 Moderately Landlord-Leaning · D+2
- County
- — inherits STATE
- City
- — inherits STATE
ZIP-level market 23607
- Home prices YoY
- -0.3%
- Rents YoY
- 2.9%
- Active inventory
- 130
- Price-to-rent
- 10.4×
Monthly cashflow live
- Estimated rent
- $1,424 high interval (Pro) →
- Mortgage (P&I)
- −$933
- Tax from tax record
- −$194 /mo · $2,328/yr
- Insurance
- −$74
- HOA
- −$0
- Vacancy / Maint / Mgmt
- −$299
- Net cashflow
- $-77
Break-even live
Sensitivity live
| Price | -10% $24 | -5% $-26 | +0% $-77 | +5% $-127 | +10% $-177 |
|---|---|---|---|---|---|
| Rent | -10% $-189 | -5% $-133 | +0% $-77 | +5% $-20 | +10% $36 |
| Rate | -1.0pp $13 | -0.5pp $-31 | base $-77 | +0.5pp $-123 | +1.0pp $-170 |
UW: 25.0% down · 7.5% · 30yr · 1.5% tax · 5.0% vac · 8.0% maint · 8.0% mgmt
Financing live
Cash to close
- Down payment
- $44,500
- Closing costs
- $5,340
- Reserves months
- —
- Total cash needed
- —
Loan-product check · same deal, 3 products live
Conventional
25% down · 7.5% · 30yr
- Down + closing
- —
- Monthly P&I
- —
- Monthly cashflow
- —
- DSCR
- —
- Eligible?
- —
Personal DTI + credit; lowest rate.
DSCR
20% down · 8.5% · 30yr
- Down + closing
- —
- Monthly P&I
- —
- Monthly cashflow
- —
- DSCR
- —
- Eligible?
- —
No personal income docs; deal must DSCR.
Hard money
10% down · 12.0% · 12mo
- Down + closing
- —
- Monthly P&I
- —
- Monthly cashflow
- —
- DSCR
- —
- Eligible?
- —
Short-term bridge; refi at stabilization.
Rent comps 40 comps
| Address | Beds | Baths | Sqft | Rent | $/sqft | DOM | Units | Dist |
|---|---|---|---|---|---|---|---|---|
| 749 31st St Newport News, VA | 3.0 | 2.0 | 1000 | $1,900 | $1.90 | 45d | 1 | 0.17mi |
| 3206 Madison Ave Newport News, VA | 3.0 | 1.0 | 900 | $1,550 | $1.72 | 12d | 1 | 0.28mi |
| 709 33rd St Unit 1 Newport News, VA | 2.0 | 1.0 | 878 | $1,400 | $1.59 | 18d | 1 | 0.29mi |
| 1010 36th St Newport News, VA | 2.0 | 1.0 | 775 | $1,095 | $1.41 | 25d | 1 | 0.30mi |
| 935 37th St Unit 15 Newport News, VA | 2.0 | 1.0 | 700 | $995 | $1.42 | 9d | 1 | 0.32mi |
| 935 37th St Unit 16 Newport News, VA | 2.0 | 1.0 | 700 | $995 | $1.42 | 45d | 1 | 0.32mi |
| 935 37th St Unit 4 Newport News, VA | 2.0 | 1.0 | 700 | $900 | $1.29 | 25d | 1 | 0.32mi |
| 1032 37th St Newport News, VA | 3.0 | 2.0 | 1191 | $1,450 | $1.22 | 45d | 1 | 0.37mi |
| 1124 33rd St Newport News, VA | 3.0 | 1.5 | 1386 | $1,600 | $1.15 | 25d | 1 | 0.37mi |
| 829 22nd St Newport News, VA | 3.0 | 1.5 | 1020 | $1,650 | $1.62 | 45d | 1 | 0.42mi |
| 1035 23rd St Newport News, VA | 3.0 | 2.0 | 1378 | $1,600 | $1.16 | 45d | 1 | 0.43mi |
| 4107 Newsome Dr Newport News, VA | 2.0 | 1.0 | 740 | $1,045 | $1.41 | 45d | 1 | 0.52mi |
| 4101 Newsome Dr Newport News, VA | 2.0 | 1.0 | 740 | $1,045 | $1.41 | 25d | 1 | 0.52mi |
| 4104 Newsome Dr Newport News, VA | 2.0 | 1.0 | 740 | $1,045 | $1.41 | 45d | 1 | 0.53mi |
| 4104 Newsome Dr Newport News, VA | 2.0 | 1.0 | 740 | $1,045 | $1.41 | 25d | 1 | 0.53mi |
| 913 41st St Newport News, VA | 2.0 | 1.5 | 740 | $1,045 | $1.41 | 25d | 1 | 0.53mi |
| 1227 31st St Newport News, VA | 3.0 | 2.0 | 1500 | $2,495 | $1.66 | 3d | 1 | 0.53mi |
| 841 41st St Newport News, VA | 2.0 | 1.0 | 740 | $795 | $1.07 | 12d | 1 | 0.53mi |
| 915 41st St Newport News, VA | 2.0 | 1.0 | 740 | $1,045 | $1.41 | 25d | 1 | 0.53mi |
| 4119 Newsome Dr Newport News, VA | 2.0 | 1.0 | 740 | $1,045 | $1.41 | 25d | 1 | 0.54mi |
| 4135 Newsome Dr Newport News, VA | 2.0 | 1.0 | 740 | $795 | $1.07 | 4d | 1 | 0.55mi |
| 4137 Newsome Dr Newport News, VA | 2.0 | 1.0 | 740 | $795 | $1.07 | 4d | 1 | 0.56mi |
| 4111 Orcutt Ave Newport News, VA | 2.0 | 1.0 | 740 | $795 | $1.07 | 4d | 1 | 0.56mi |
| 4163 Newsome Dr Newport News, VA | 2.0 | 1.0 | 740 | $1,045 | $1.41 | 25d | 1 | 0.57mi |
| 4200 Newsome Dr Newport News, VA | 2.0 | 1.0 | 895 | $795 | $0.89 | 25d | 1 | 0.57mi |
| 740 21st St Newport News, VA | 3.0 | 2.0 | 1120 | $2,000 | $1.79 | 45d | 1 | 0.57mi |
| 4218 Newsome Dr Newport News, VA | 2.0 | 1.0 | 740 | $795 | $1.07 | 4d | 1 | 0.58mi |
| 2314 Chestnut Ave Newport News, VA | 2.0 | 1.0 | 900 | $12,900 | $14.33 | 3d | 1 | 0.58mi |
| 4224 Newsome Dr Newport News, VA | 2.0 | 1.0 | 740 | $1,045 | $1.41 | 25d | 1 | 0.58mi |
| 4226 Newsome Dr Newport News, VA | 2.0 | 1.0 | 740 | $1,045 | $1.41 | 25d | 1 | 0.58mi |
| 4241 Orcutt Ave Newport News, VA | 2.0 | 1.0 | 740 | $795 | $1.07 | 4d | 1 | 0.61mi |
| 4263 Newsome Dr Newport News, VA | 2.0 | 1.0 | 740 | $795 | $1.07 | 12d | 1 | 0.63mi |
| 4263 Newsome Dr Unit 4263 Newport News, VA | 2.0 | 1.0 | 740 | $1,045 | $1.41 | 45d | 1 | 0.63mi |
| 4261 Newsome Dr Newport News, VA | 2.0 | 1.0 | 740 | $10,145 | $13.71 | 25d | 1 | 0.63mi |
| 1239 24th St Newport News, VA | 3.0 | 1.0 | 880 | $1,495 | $1.70 | 45d | 1 | 0.64mi |
| 1240 24th St Newport News, VA | 2.0 | 1.0 | 752 | $995 | $1.32 | 25d | 1 | 0.65mi |
| 4325 Newsome Dr Newport News, VA | 2.0 | 1.0 | 740 | $795 | $1.07 | 4d | 1 | 0.66mi |
| 4325 Newsome Dr Newport News, VA | 2.0 | 1.0 | 740 | $795 | $1.07 | 12d | 1 | 0.66mi |
| 1216 21st St Newport News, VA | 3.0 | 3.5 | 1446 | $1,700 | $1.18 | 25d | 1 | 0.74mi |
| 1348 28th St Newport News, VA | 2.0 | 1.0 | 997 | $1,350 | $1.35 | 5d | 1 | 0.75mi |
Listing history 24 events
-
2026-04-21status Under Contract
-
2026-04-14historical Active Under Contract
-
2026-04-01price $178,000
-
2026-03-01$190,900 Active
-
2025-03-19historical $1,500
-
2025-01-18price $1,500
-
2024-11-20$1,600
-
2024-03-14historical $1,600
-
2024-02-15$1,600
-
2024-02-10historical $1,600
-
2024-02-08$1,600
-
2024-02-05historical $1,600
-
2024-02-02historical $1,600
-
2024-01-31$1,600
-
2024-01-30$1,600
-
2023-06-06soldstatus $110,100
-
2023-05-22status Under Contract
-
2023-05-19$95,000 Active
-
2017-07-14soldstatus $35,500
-
2017-06-18status Under Contract
-
2017-04-12status Active
-
2017-04-01historical
-
2017-02-14price $45,000
-
2016-12-08$50,000 Active
ⓘ Source: listings_history table (triggers on properties + properties_extension) + one-shot
backfill from property_details.listing_events for pre-trigger history.
Tax reassessment forecast VA · Resets to sale price
- Current annual tax
- $2,328 · $194/mo
- Projected year-2 tax
- $2,328 · $194/mo
- Expected delta
- $0/yr ($0/mo · 0.0%)
ⓘ Screening estimate from a state-policy table — verify with the county assessor before closing.
Climate risk First Street
- Flood 1/10 Low FEMA zone X (unshaded) · 0% chance over 30 yrs
- Wildfire 1/10 Low
- Heat 9/10 Extreme 7 d/yr ≥106°F today · 16 d/yr by 30 yrs out
- Wind 8/10 Severe 80% chance of damaging wind over 30 yrs
- Air quality 2/10 Low 1 unhealthy d/yr today · 1 by 30 yrs out
Nearby sold comps map
Loading sold comps map…
Walkable amenities ~0.75 mi
Loading nearby amenities…
Taxation est. · year 1
- Rental income
- $17,089
- − Mortgage interest
- −$9,971
- − Property taxes
- −$2,328
- − Insurance
- −$890
- − Repairs & maintenance
- −$1,367
- − Management
- −$1,367
- − Depreciation
- −$5,178
- Taxable loss
- −$4,012
- Est. tax savings @ 24.0%
- +$963
- After-tax cash flow
- $44/yr
For passive investors: Depreciation is non-cash, so a rental often shows a tax loss while cash-flowing — sheltering income. Rental losses are passive: they offset passive income freely, and up to $25,000/yr can offset ordinary (W-2) income if you actively participate and your MAGI is under $100k (phasing out to $0 by $150k); unused losses carry forward. On sale, claimed depreciation is recaptured at up to 25%, and gains may owe capital-gains tax (a 1031 exchange can defer both). Figures are a year-1 estimate at your 24.0% rate — not tax advice; consult a CPA.
Schools (NCES district)
- District
- Newport News City Public School District
- NCES district ID
- 5102640
- Math proficiency
- 34% ▼ -37.00%
- Reading proficiency
- 54% ▼ -10.00%
- Median HH income
- $49,644
- Composite
- 37.7/100
- National rank
- #4360
- State rank
- #112 of 131 in VA
Livability — Newport News
- Score
- 75/100
- State rank
- #123
- US rank
- #4018
Category grades
Schools grade is shown separately in the Schools card above.
Census & demographics
- Census place
- Newport News, VA
- County
- Newport News City · 178,950 people
- City population
- 178,950
- Metro
- Virginia Beach-Norfolk-Newport News, VA-NC
- Population (ZIP)
- 23,096
- Household income
- $42,334
- Rent vs Own
- Severe rent burden
- 2008.0
Population outlook (Newport News County) Hauer SSP2
- Today (2025)
- 181,076 people
- By 2030
- 179,683 · -0.8%
- By 2040
- 174,649 · -3.5%
- By 2050
- 167,407 · -7.5%
- By 2075
- 147,597 · -18.5%
- By 2100
- 122,144 · -32.5%
Race, ethnicity, and origin ACS 2023
- Neighborhood character
- Predominantly Black (75%)
- Race & ethnicity
- Black 75% White 13% Two or more races 7% Hispanic / Latino 6% Asian 1%
- Hispanic origin (detail)
- Mexican 1% Puerto Rican 2%
- Foreign-born
- 3% · Canada
- Languages at home
- 96% English-only · Spanish 3%
Political lean MEDSL · Newport News
- 2024 margin
- Strong D (+28.8) · D 63.7% · R 34.9% · Other 1.4%
- 2008→2024 swing
- +0.1pp no change · 2008: 28.7pp · 2024: 28.8pp
- All cycles
- 2024: D+28.8 2020: D+32.9 2016: D+25.4 2012: D+30.0 2008: D+28.7
Not yet ingested
- Civics
- —
Market trends
- HPI YoY
- ▼ -0.84%
- Current HPI
- 312.4039
- Rent YoY
- ▲ 2.91%
- Metro
- Virginia Beach-Norfolk-Newport News, VA-NC
- State GDP YoY
- ▲ 2.40%
- F500 in state
- 50
Industry mix (Fortune 500 HQ in VA)
| Industry | F500 HQs | Revenue |
|---|---|---|
| Aerospace / Defense | 4 | $236B |
|
||
| Technology / Defense | 3 | $32B |
|
||
| Financial Services | 2 | $176B |
|
||
| Utilities | 2 | $27B |
|
||
| Insurance | 2 | $25B |
|
||
| Technology | 2 | $15B |
|
||
Price history
+256.0% since first listed24 events — show timeline
- 2026-04-21 Pending — REINMLS
- 2026-04-14 Contingent — REINMLS
- 2026-04-01 Price Changed $178,000 REINMLS
- 2026-03-01 Listed $190,900 REINMLS
- 2025-03-19 Rental Removed $1,500 REINMLS
- 2025-01-18 Price Changed $1,500 REINMLS
- 2024-11-20 Listed for Rent $1,600 REINMLS
- 2024-03-14 Rental Removed $1,600 APPFOLIO
- 2024-02-15 Listed for Rent $1,600 APPFOLIO
- 2024-02-10 Rental Removed $1,600 REINMLS
- 2024-02-08 Listed for Rent $1,600 REINMLS
- 2024-02-05 Rental Removed $1,600 APPFOLIO
- 2024-02-02 Rental Removed $1,600 REINMLS
- 2024-01-31 Listed for Rent $1,600 APPFOLIO
- 2024-01-30 Listed for Rent $1,600 REINMLS
- 2023-06-06 Sold (Public Records) $110,100 Public Records
- 2023-05-22 Pending — REINMLS
- 2023-05-19 Listed $95,000 REINMLS
- 2017-07-14 Sold (Public Records) $35,500 Public Records
- 2017-06-18 Pending — REINMLS
- 2017-04-12 Relisted — REINMLS
- 2017-04-01 Listing Removed — REINMLS
- 2017-02-14 Price Changed $45,000 REINMLS
- 2016-12-08 Listed $50,000 REINMLS
Property tax history
+8.5%/yrLatest (2026): $2,328 · +17.4% YoY. Source: county tax records.
Cash-flow waterfall
monthlySold comps — $/sqft
last 12 mo · ≤1 miLoading sold comps…