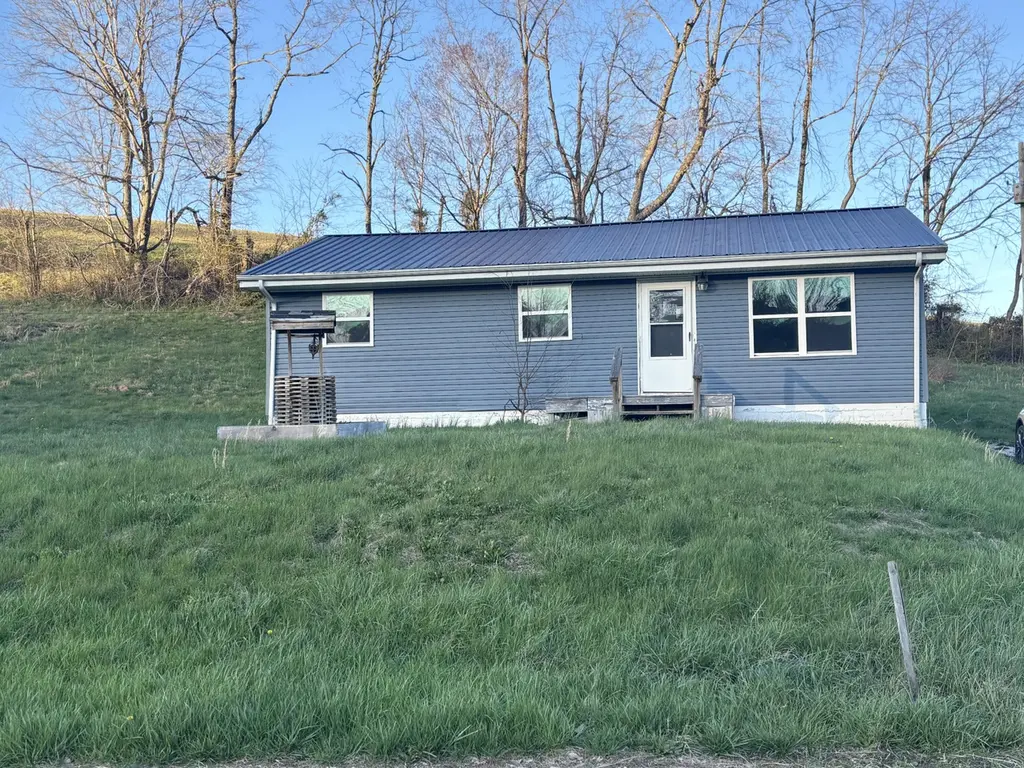
50 W Maytown Rd · Ezel, KY
Flood risk 10/10 · Severe
- FEMA flood zone
- X (unshaded)
- Chance of flooding over 30 yrs
- 0.99%
- Est. flood insurance / yr
- $507 – $1,088
Fire risk 8/10 · Major
- Est. fire insurance / yr
- $839 – $1,559
Heat risk 4/10 · Minor
- Hot days now (above 101°F)
- 7 days/yr
- Hot days in 30 yrs
- 20 days/yr
Wind risk 4/10 · Minor
- Chance of severe wind over 30 yrs
- 5.0%
Air-quality risk 1/10 · Minimal
- Unhealthy air days now
- 0 days/yr
- Unhealthy air days in 30 yrs
- 0 days/yr
Risk factors via First Street. Map © Google.
Why this score? — see what drove the C+ grade
The composite is a weighted blend of 9 inputs, each scored 0–100. Each bar is that input's sub-score; the figure is the points it added to the 100-point composite (weight × sub-score).
- Cash flow +22.1/30.0
- ARV discount +15.0/15.0
- DSCR +7.1/10.0
- 1% rule +5.4/10.0
- Appreciation +4.8/10.0
- Livability +3.1/5.0
- Rent growth +2.5/5.0
- Condition / age +2.5/5.0
- Schools +2.0/10.0
$110,000
🖨 Deal sheet 📄 Offer letter ✓ Due diligence
Listing remarks MLS
Charming 3-bedroom, 1-bath starter home in a great location! This cozy property features a spacious yard—perfect for outdoor entertaining, gardening, or simply relaxing. Enjoy the covered back porch, ideal for sitting outside rain or shine. There's also a chicken coop and storage shed, offering extra space for hobbies, animals, or tools. Inside, you'll find newer flooring in the kitchen and bathroom, along with updated windows that bring in plenty of natural light while improving energy efficiency. With its inviting layout and thoughtful updates, this home is a wonderful opportunity for first-time buyers or anyone looking to downsize. Don't miss your chance to make it your own!
Key facts
- Spacious yard
- Newer flooring
- Updated windows
Tags
Neighborhood map
What this means for you Summary
Snapshot
- This is a 3-bed/1.0-bath single-family listed at $110k.
Deal economics
- At list price, monthly cash flow is $112 ($1k/yr) — positive.
- The deal already cash-flows at list — no discount required.
- Meets the 1% rule at list price ($1k rent vs $110k).
- Recommended offer: $103k (6.0% below list) — sets the bar for market timing.
- Cap rate 8.2% vs local median 3.4% in Ezel — top-decile yield for the area; either an underpriced asset or a hidden risk that comps aren't pricing in. Stress-test before assuming the spread holds.
Location & tenants
- Location reads 61/100 on livability (#375 in KY) — a middle-class / working-renter tenant base. Strengths: cost of living A+, housing A-; Watch: health & safety D+, schools D, amenities F.
- Morgan County (rural): math 14% / reading 35% proficiency, ranked #150 of 165 in KY (top 91%) — low school quality limits family demand, transient renter base, plan for 1-2y turnover; 64% free/reduced lunch — lower-income household profile, screen leases tightly.
- Market conditions: 9 active listings in the ZIP; 2 units permitted in Morgan County in 2024 (0 in 5+ unit buildings).
Forward outlook
- In year one you build about $411 of equity ($761 loan paydown + $-350 appreciation (-0.3% local appreciation)).
- Morgan County population projected at -16% by 2050 — secular population decline; favor cash flow + early exit over multi-decade hold.
- At projected returns (-0.3% appreciation + 3.0% rent growth), your $31k cash investment doubles in ~10 years — after that, you're playing with house money.
Negotiation context
- It's been on market 83 days — a 6% lower offer ($103k) is reasonable based on typical stale-listing flexibility.
- Current owner paid $33k; list at $110k implies a 233% gain — meaningful room to come down on a strong offer.
Risks & watch-outs
- Watch-outs: flood insurance adds $66/mo.
- Climate carrying-cost: severe flood risk; severe wildfire risk — expect insurance premiums to compound above CPI over the hold.
Questions for the listing agent
- It's been on market 83 days. Have you received any prior offers? Is the seller open to a 6% concession, seller financing, or rate buy-down credit?
- What's the actual annual flood-insurance premium (NFIP or private), and is the property in a SFHA with mandatory coverage?
- Why hasn't it sold? Are there any deal-killer items the seller is aware of (foundation, flood, title, zoning, code violations)?
- Is there a deadline driving the sale (1031 exchange, divorce, estate, relocation)? That informs how much negotiation room exists.
- Schools are D-rated, which usually means shorter tenancies and higher turnover. Who's the typical renter profile here, and what's been the actual vacancy rate?
- What's the average days-on-market for RENTAL listings here right now (not sales)? A rising rental-DOM trend means longer vacancies and softer asking-rent achievability than the comps imply.
- What's the recent tenant-quality profile in this submarket — average credit score on applications, eviction rate, late-payment / NSF rate, and stable-employment percentage? A property-management company in the area should have these aggregated.
- How much new for-sale + rental construction is in the pipeline within 1–3 miles? Heavy new supply typically softens prices + rents 12–24 months out; constrained supply supports both.
Investment metrics
- 1% rule
- 1.04% ✓
- Cap rate
- 8.23%
- Cash-on-cash
- 6.94%
- DSCR
- 1.31
- GRM
- 8.0
CMA / ARV
- ARV (median comp)
- $173,503
- List price
- $110,000
- Delta
- -36.60%
- Verdict
- UNDERPRICED
- Comps
- 3 within 2.0 mi
Show comp detail 1 sale within ~0.75 mi
| Address | Dist | Beds/Ba | Sqft | Sold | Price | $/sf | Match |
|---|---|---|---|---|---|---|---|
| 50 West Maytown Rd | 0.01mi | 3/1.0 | 1,120 (0%) | 22mo | $104,500 | $93 | 81 |
Match score weights: distance 35% · size 25% · config 20% · recency 20%. Top-matched comps best support the ARV.
Projected returns pro-forma
-0.32% appreciation · 3.0% rent growth · sell at horizon
- IRR
- 1.6%
- Equity multiple
- 1.07×
- Total profit
- $2,291
- Equity at exit
- $30,202
- IRR
- 7.4%
- Equity multiple
- 1.78×
- Total profit
- $23,913
- Equity at exit
- $34,944
Cash invested: $30,800 (down + closing). Projections, not guarantees.
Landlord ↔ Tenant lean methodology
- Overall (STATE)
- 83 Strongly Landlord-Friendly
- State Kentucky
- 83 Strongly Landlord-Friendly · R+16
- County
- — inherits STATE
- City
- — inherits STATE
ZIP-level market 41425
- Home prices YoY
- -0.2%
- Active inventory
- 9
- Price-to-rent
- 8.0×
Monthly cashflow live
- Estimated rent
- $1,148 medium interval (Pro) →
- Mortgage (P&I)
- −$577
- Tax from tax record
- −$106 /mo · $1,277/yr
- Insurance
- −$46
- Flood insurance flood zone
- −$66 /mo · $798/yr
- HOA
- −$0
- Vacancy / Maint / Mgmt
- −$241
- Net cashflow
- $112
Break-even live
UW: 25.0% down · 7.5% · 30yr · 1.5% tax · 5.0% vac · 8.0% maint · 8.0% mgmt
Financing live
Cash to close
- Down payment
- $27,500
- Closing costs
- $3,300
- Reserves months
- —
- Total cash needed
- —
Loan-product check · same deal, 3 products live
Conventional
25% down · 7.5% · 30yr
- Down + closing
- —
- Monthly P&I
- —
- Monthly cashflow
- —
- DSCR
- —
- Eligible?
- —
Personal DTI + credit; lowest rate.
DSCR
20% down · 8.5% · 30yr
- Down + closing
- —
- Monthly P&I
- —
- Monthly cashflow
- —
- DSCR
- —
- Eligible?
- —
No personal income docs; deal must DSCR.
Hard money
10% down · 12.0% · 12mo
- Down + closing
- —
- Monthly P&I
- —
- Monthly cashflow
- —
- DSCR
- —
- Eligible?
- —
Short-term bridge; refi at stabilization.
Listing history 19 events
-
2026-06-18status $110,000 Active 83 DOM
-
2026-06-18days on market $110,000 Contingent 83 DOM
-
2026-06-17days on market $110,000 Contingent 82 DOM
-
2026-06-16days on market $110,000 Contingent 81 DOM
-
2026-06-15days on market $110,000 Contingent 80 DOM
-
2026-06-14days on market $110,000 Contingent 78 DOM
-
2026-06-10days on market $110,000 Contingent 75 DOM
-
2026-06-09days on market $110,000 Contingent 74 DOM
-
2026-06-08days on market $110,000 Contingent 73 DOM
-
2026-06-07statusdays on market $110,000 Contingent 72 DOM
-
2026-06-05pricedays on market $110,000 Active 69 DOM
-
2026-06-03days on market $115,000 Active 68 DOM
-
2026-06-02days on market $115,000 Active 67 DOM
-
2026-06-01days on market $115,000 Active 66 DOM
-
2026-05-31days on market $115,000 Active 65 DOM
-
2026-05-31days on market $115,000 Active 64 DOM
-
2026-04-23price $115,000 692-char remark
Show marketing remark (692 chars)
Charming 3-bedroom, 1-bath starter home in a great location! This cozy property features a spacious yard—perfect for outdoor entertaining, gardening, or simply relaxing. Enjoy the covered back porch, ideal for sitting outside rain or shine. There's also a chicken coop and storage shed, offering extra space for hobbies, animals, or tools. Inside, you'll find newer flooring in the kitchen and bathroom, along with updated windows that bring in plenty of natural light while improving energy efficiency. With its inviting layout and thoughtful updates, this home is a wonderful opportunity for first-time buyers or anyone looking to downsize. Don't miss your chance to make it your own!
-
2026-03-27$120,000 Active 692-char remark
Show marketing remark (692 chars)
Charming 3-bedroom, 1-bath starter home in a great location! This cozy property features a spacious yard—perfect for outdoor entertaining, gardening, or simply relaxing. Enjoy the covered back porch, ideal for sitting outside rain or shine. There's also a chicken coop and storage shed, offering extra space for hobbies, animals, or tools. Inside, you'll find newer flooring in the kitchen and bathroom, along with updated windows that bring in plenty of natural light while improving energy efficiency. With its inviting layout and thoughtful updates, this home is a wonderful opportunity for first-time buyers or anyone looking to downsize. Don't miss your chance to make it your own!
-
2011-05-23soldstatus $33,000
ⓘ Source: listings_history table (triggers on properties + properties_extension) + one-shot
backfill from property_details.listing_events for pre-trigger history.
Tax reassessment forecast KY · Resets to sale price
- Current annual tax
- $1,277 · $106/mo
- Projected year-2 tax
- $1,277 · $106/mo
- Expected delta
- $0/yr ($0/mo · 0.0%)
ⓘ Screening estimate from a state-policy table — verify with the county assessor before closing.
Climate risk First Street
- Flood 10/10 Extreme FEMA zone X (unshaded) · 99% chance over 30 yrs
- Wildfire 8/10 Severe
- Heat 4/10 Moderate 7 d/yr ≥101°F today · 20 d/yr by 30 yrs out
- Wind 4/10 Moderate 5% chance of damaging wind over 30 yrs
- Air quality 1/10 Low 0 unhealthy d/yr today · 0 by 30 yrs out
Nearby sold comps map
Loading sold comps map…
Walkable amenities ~0.75 mi
Loading nearby amenities…
Taxation est. · year 1
- Rental income
- $13,779
- − Mortgage interest
- −$6,162
- − Property taxes
- −$1,277
- − Insurance
- −$1,348
- − Repairs & maintenance
- −$1,102
- − Management
- −$1,102
- − Depreciation
- −$3,200
- Taxable loss
- −$412
- Est. tax savings @ 24.0%
- +$99
- After-tax cash flow
- $1,437/yr
For passive investors: Depreciation is non-cash, so a rental often shows a tax loss while cash-flowing — sheltering income. Rental losses are passive: they offset passive income freely, and up to $25,000/yr can offset ordinary (W-2) income if you actively participate and your MAGI is under $100k (phasing out to $0 by $150k); unused losses carry forward. On sale, claimed depreciation is recaptured at up to 25%, and gains may owe capital-gains tax (a 1031 exchange can defer both). Figures are a year-1 estimate at your 24.0% rate — not tax advice; consult a CPA.
Schools (NCES district)
- District
- Morgan County
- NCES district ID
- 2104290
- Math proficiency
- 14% ▼ -30.00%
- Reading proficiency
- 35% ▼ -21.00%
- Median HH income
- $31,371
- Composite
- 19.78/100
- National rank
- #8704
- State rank
- #150 of 165 in KY
Livability — Ezel
- Score
- 61/100
- State rank
- #375
- US rank
- #17739
Category grades
Schools grade is shown separately in the Schools card above.
Census & demographics
- Population (ZIP)
- 1,146
Population outlook (Morgan County) Hauer SSP2
- Today (2025)
- 12,632 people
- By 2030
- 12,211 · -3.3%
- By 2040
- 11,408 · -9.7%
- By 2050
- 10,612 · -16.0%
- By 2075
- 8,790 · -30.4%
- By 2100
- 6,944 · -45.0%
Race, ethnicity, and origin ACS 2023
- Neighborhood character
- Predominantly White (89%)
- Race & ethnicity
- White 89% Hispanic / Latino 7% Black 3%
- Hispanic origin (detail)
- Mexican 5% Cuban 2%
- Common ancestry
- Slovak 5% Lithuanian 3% Italian 2%
- Foreign-born
- 3%
- Languages at home
- 95% English-only · German/W. Germanic 4% Spanish 1%
Political lean MEDSL · Morgan
- 2024 margin
- Solid R (+63.5) · D 17.5% · R 81.0% · Other 1.5%
- 2008→2024 swing
- -51.7pp toward R · 2008: -11.8pp · 2024: -63.5pp
- All cycles
- 2024: R+63.5 2020: R+56.4 2016: R+55.0 2012: R+36.9 2008: R+11.8
Not yet ingested
- Civics
- —
Market trends
- HPI YoY
- ▼ -0.32%
- Current HPI
- 186.644
- Rent YoY
- —
- Metro
- —
- State GDP YoY
- ▲ 1.81%
- F500 in state
- 4
Industry mix (Fortune 500 HQ in KY)
| Industry | F500 HQs | Revenue |
|---|---|---|
| Healthcare | 1 | $118B |
|
||
| Food / Beverage | 1 | $7B |
|
||
Price history
+248.5% since first listed3 events — show timeline
- 2026-04-23 Price Changed $115,000 ImagineMLS
- 2026-03-27 Listed $120,000 ImagineMLS
- 2011-05-23 Sold (Public Records) $33,000 Public Records
Property tax history
+10.4%/yrLatest (2025): $1,277 · +216.4% YoY. Source: county tax records.
Cash-flow waterfall
monthlySold comps — $/sqft
last 12 mo · ≤1 miLoading sold comps…