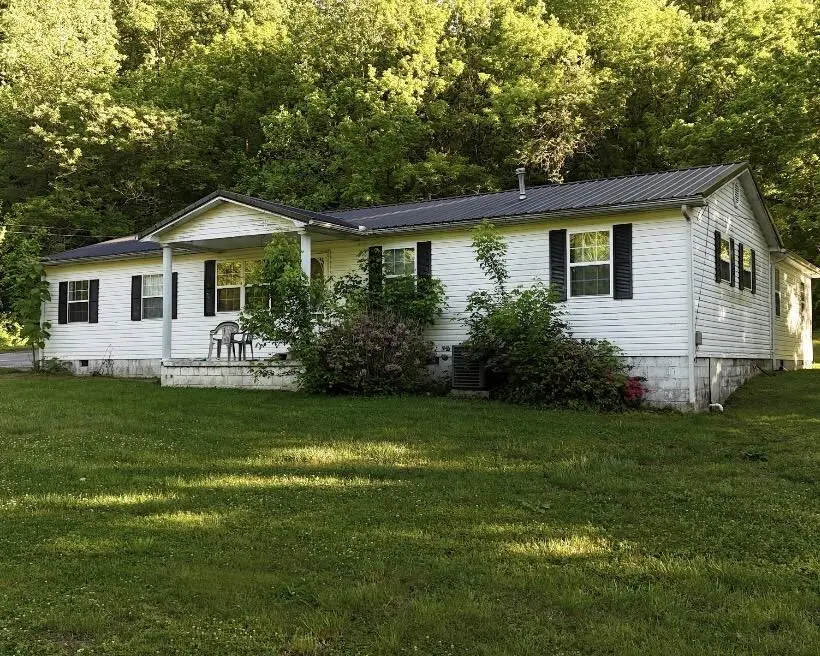
1831 Fish Trap Rd · Oneida, KY
Flood risk 1/10 · Minimal
- FEMA flood zone
- X (unshaded)
- Chance of flooding over 30 yrs
- 0.0%
- Est. flood insurance / yr
- $507 – $1,088
Fire risk 5/10 · Moderate
- Est. fire insurance / yr
- $839 – $1,559
Heat risk 4/10 · Minor
- Hot days now (above 99°F)
- 7 days/yr
- Hot days in 30 yrs
- 21 days/yr
Wind risk 2/10 · Minimal
- Chance of severe wind over 30 yrs
- 3.0%
Air-quality risk 2/10 · Minimal
- Unhealthy air days now
- 1 days/yr
- Unhealthy air days in 30 yrs
- 1 days/yr
Risk factors via First Street. Map © Google.
Why this score? — see what drove the C grade
The composite is a weighted blend of 9 inputs, each scored 0–100. Each bar is that input's sub-score; the figure is the points it added to the 100-point composite (weight × sub-score).
- Cash flow +16.8/30.0
- Appreciation +10.0/10.0
- ARV discount +7.5/15.0
- DSCR +5.2/10.0
- 1% rule +4.6/10.0
- Condition / age +3.8/5.0
- Livability +3.1/5.0
- Rent growth +2.5/5.0
- Schools +2.3/10.0
$135,000
🖨 Deal sheet 📄 Offer letter ✓ Due diligence
Listing remarks
This home offers privacy near the end of a quiet country road, creating a peaceful retreat. It's well suited for a large family with five bedrooms and the potential for another. One bedroom includes built-in bunk beds and storage, adding practicality. The spacious added on primary suite features a generous layout, a large walk-in closet, and en-suite bath. You'll find a cozy living area, a large kitchen, and an oversized laundry room. There is also ample space for a media room and a home office. A ramp by the side door provides accessibility. Enjoy the outdoors from the screened-in back porch, perfect for soaking in the mountain views. The property also provides plenty of yard space for gar
Key facts
- Pear and apple trees
- Built-in bunk beds
- Mountain views
Tags
Property features AI
Exterior
- Utilities: Public water; Septic tank
- Home design: Single-family (rural subdivision)
- Construction: Block foundation
- Exterior features: Aluminum siding
Interior
- Flooring: Hardwood; Laminate
- Bathrooms: 2 full bathrooms; 1 half bathroom
- Heating & cooling: Electric and propane heating; Central air conditioning
- Interior features: Hardwood and laminate flooring; No fireplace; 11 total rooms
Neighborhood map
What this means for you Summary
Snapshot
- This is a 5-bed/2.5-bath single-family listed at $135k. Condition is rated good.
Deal economics
- At list price, monthly cash flow is $87 ($1k/yr) — positive.
- The deal already cash-flows at list — no discount required.
- To meet the 1% rule (rent ≥ 1% of price), the offer needs to be $129k (4.4% below list).
- Recommended offer: $129k (4.4% below list) — sets the bar for 1% rule.
Location & tenants
- Location reads 61/100 on livability (#372 in KY) — a middle-class / working-renter tenant base. Strengths: cost of living A+, housing A+; Watch: crime C-, amenities F, commute F.
- Clay County (rural): math 21% / reading 37% proficiency, ranked #130 of 165 in KY (top 79%) — low school quality limits family demand, transient renter base, plan for 1-2y turnover; 66% free/reduced lunch — lower-income household profile, screen leases tightly.
- Zoned schools: Big Creek Elementary (math 17% / reading 37%, grade F, #434 of 676 statewide, top 69%, 140 students, 76% FRL); Clay County Middle School (math 21% / reading 38%, grade F, #151 of 217 statewide, top 71%, 407 students, 74% FRL); Clay County High School (math 17% / reading 27%, grade F, #202 of 254 statewide, top 82%, 717 students, 70% FRL).
- Market conditions: 84 active listings in the ZIP.
Forward outlook
- In year one you build about $14k of equity ($933 loan paydown + $14k appreciation (10.0% local appreciation)).
- Clay County population projected at -21% by 2050 — secular population decline; favor cash flow + early exit over multi-decade hold.
- At projected returns (10.0% appreciation + 3.0% rent growth), your $38k cash investment doubles in ~3 years — after that, you're playing with house money.
- By year 3, paydown + projected appreciation supports a ~$37k cash-out refi (75% LTV) — recoverable capital for the next deal without selling this one.
Negotiation context
- It's been on market 48 days — a 3% lower offer ($131k) is reasonable based on typical stale-listing flexibility.
- 5 sale attempts with the ask held roughly flat each time — persistent listings suggest the price (not the market) is what's stuck; bring a comps-based counter.
Risks & watch-outs
- Climate carrying-cost: moderate wildfire risk — expect insurance premiums to compound above CPI over the hold.
Questions for the listing agent
- It's been on market 48 days. Have you received any prior offers? Is the seller open to a 4% concession, seller financing, or rate buy-down credit?
- Is there a deadline driving the sale (1031 exchange, divorce, estate, relocation)? That informs how much negotiation room exists.
- Schools are B-rated — typically a magnet for longer-tenancy family renters. What's the average tenant stay here, and is there a school-zone premium baked into asking?
- What's the average days-on-market for RENTAL listings here right now (not sales)? A rising rental-DOM trend means longer vacancies and softer asking-rent achievability than the comps imply.
- What's the recent tenant-quality profile in this submarket — average credit score on applications, eviction rate, late-payment / NSF rate, and stable-employment percentage? A property-management company in the area should have these aggregated.
- How much new for-sale + rental construction is in the pipeline within 1–3 miles? Heavy new supply typically softens prices + rents 12–24 months out; constrained supply supports both.
Investment metrics
- 1% rule
- 0.96% ✗
- Cap rate
- 7.06%
- Cash-on-cash
- 2.76%
- DSCR
- 1.12
- GRM
- 8.7
CMA / ARV
No comps found within radius.
Projected returns pro-forma
10.0% appreciation · 3.0% rent growth · sell at horizon
- IRR
- 26.3%
- Equity multiple
- 3.09×
- Total profit
- $79,072
- Equity at exit
- $121,619
- IRR
- 23.0%
- Equity multiple
- 7.05×
- Total profit
- $228,545
- Equity at exit
- $262,275
Cash invested: $37,800 (down + closing). Projections, not guarantees.
Landlord ↔ Tenant lean methodology
- Overall (STATE)
- 83 Strongly Landlord-Friendly
- State Kentucky
- 83 Strongly Landlord-Friendly · R+16
- County
- — inherits STATE
- City
- — inherits STATE
ZIP-level market 40962
- Home prices YoY
- 21.0%
- Active inventory
- 84
- Price-to-rent
- 8.7×
Monthly cashflow live
- Estimated rent
- $1,291 medium interval (Pro) →
- Mortgage (P&I)
- −$708
- Tax est. 1.5%
- −$169 /mo · $2,025/yr
- Insurance
- −$56
- HOA
- −$0
- Vacancy / Maint / Mgmt
- −$271
- Net cashflow
- $87
Break-even live
UW: 25.0% down · 7.5% · 30yr · 1.5% tax · 5.0% vac · 8.0% maint · 8.0% mgmt
Financing live
Cash to close
- Down payment
- $33,750
- Closing costs
- $4,050
- Reserves months
- —
- Total cash needed
- —
Loan-product check · same deal, 3 products live
Conventional
25% down · 7.5% · 30yr
- Down + closing
- —
- Monthly P&I
- —
- Monthly cashflow
- —
- DSCR
- —
- Eligible?
- —
Personal DTI + credit; lowest rate.
DSCR
20% down · 8.5% · 30yr
- Down + closing
- —
- Monthly P&I
- —
- Monthly cashflow
- —
- DSCR
- —
- Eligible?
- —
No personal income docs; deal must DSCR.
Hard money
10% down · 12.0% · 12mo
- Down + closing
- —
- Monthly P&I
- —
- Monthly cashflow
- —
- DSCR
- —
- Eligible?
- —
Short-term bridge; refi at stabilization.
Listing history 40 events
-
2026-06-18days on market $135,000 Active 48 DOM
-
2026-06-17days on market $135,000 Active 47 DOM
-
2026-06-16days on market $135,000 Active 46 DOM
-
2026-06-15days on market $135,000 Active 45 DOM
-
2026-06-13days on market $135,000 Active 43 DOM
-
2026-06-12days on market $135,000 Active 42 DOM
-
2026-06-09days on market $135,000 Active 39 DOM
-
2026-06-08days on market $135,000 Active 38 DOM
-
2026-06-07days on market $135,000 Active 37 DOM
-
2026-06-07days on market $135,000 Active 36 DOM
-
2026-06-04days on market $135,000 Active 33 DOM
-
2026-06-02days on market $135,000 Active 32 DOM
-
2026-06-01days on market $135,000 Active 31 DOM
-
2026-05-31days on market $135,000 Active 30 DOM
-
2026-05-31days on market $135,000 Active 29 DOM
-
2026-05-01$135,000 Active
-
2026-02-02price $147,000
-
2026-01-20price $149,945
-
2025-12-11price $149,950
-
2025-12-08price $149,985
-
2025-12-03price $149,988
-
2025-11-26price $149,990
-
2025-11-05status Active
-
2025-10-04historical Contingent
-
2025-10-04historical
-
2025-10-03price $149,995
-
2025-09-30price $149,997
-
2025-09-29price $149,998
-
2025-09-12price $149,999
-
2025-09-09price $157,498
-
2025-09-04price $157,499
-
2025-08-17price $157,500
-
2025-08-13price $159,987
-
2025-08-04price $159,989
-
2025-07-20price $159,990
-
2025-05-28status Active
-
2025-04-11historical Contingent
-
2025-03-23status Active
-
2025-03-22historical
-
2025-03-22$160,000 Active
ⓘ Source: listings_history table (triggers on properties + properties_extension) + one-shot
backfill from property_details.listing_events for pre-trigger history.
Climate risk First Street
- Flood 1/10 Low FEMA zone X (unshaded) · 0% chance over 30 yrs
- Wildfire 5/10 Major
- Heat 4/10 Moderate 7 d/yr ≥99°F today · 21 d/yr by 30 yrs out
- Wind 2/10 Low 3% chance of damaging wind over 30 yrs
- Air quality 2/10 Low 1 unhealthy d/yr today · 1 by 30 yrs out
Nearby sold comps map
Loading sold comps map…
Walkable amenities ~0.75 mi
Loading nearby amenities…
Taxation est. · year 1
- Rental income
- $15,490
- − Mortgage interest
- −$7,562
- − Property taxes
- −$2,025
- − Insurance
- −$675
- − Repairs & maintenance
- −$1,239
- − Management
- −$1,239
- − Depreciation
- −$3,927
- Taxable loss
- −$1,178
- Est. tax savings @ 24.0%
- +$283
- After-tax cash flow
- $1,324/yr
For passive investors: Depreciation is non-cash, so a rental often shows a tax loss while cash-flowing — sheltering income. Rental losses are passive: they offset passive income freely, and up to $25,000/yr can offset ordinary (W-2) income if you actively participate and your MAGI is under $100k (phasing out to $0 by $150k); unused losses carry forward. On sale, claimed depreciation is recaptured at up to 25%, and gains may owe capital-gains tax (a 1031 exchange can defer both). Figures are a year-1 estimate at your 24.0% rate — not tax advice; consult a CPA.
Condition & rehab AI · 13 photos
This home is in good condition with a good roof and exterior. It has fresh paint and clean trim, making it a good candidate for a cosmetic rehab to enhance its curb appeal and value.
Value-add opportunities
- Resale Paint exterior — Fresh paint enhances curb appeal
- Resale Trim and paint trim — Clean trim improves home's appearance
- Both Landscaping — Landscaping enhances curb appeal and outdoor living space
Renovation cost estimate screening
Value-add ROI direction
- Resale Paint exterior — Fresh paint enhances curb appeal ↑
- Resale Trim and paint trim — Clean trim improves home's appearance ↑
- Both Landscaping — Landscaping enhances curb appeal and outdoor living space ↑
ⓘ Cost ranges are severity-bucket heuristics (US national rule-of-thumb). Get contractor quotes + a written scope before underwriting a rehab budget.
Schools (NCES district)
- District
- Clay County
- NCES district ID
- 2101230
- Math proficiency
- 21% ▼ -30.00%
- Reading proficiency
- 37% ▼ -20.00%
- Median HH income
- $23,180
- Composite
- 22.75/100
- National rank
- #8031
- State rank
- #130 of 165 in KY
Livability — Oneida
- Score
- 61/100
- State rank
- #372
- US rank
- #17604
Category grades
Schools grade is shown separately in the Schools card above.
Census & demographics
- Population (ZIP)
- 17,390
Population outlook (Clay County) Hauer SSP2
- Today (2025)
- 20,004 people
- By 2030
- 19,285 · -3.6%
- By 2040
- 17,619 · -11.9%
- By 2050
- 15,782 · -21.1%
- By 2075
- 11,489 · -42.6%
- By 2100
- 7,949 · -60.3%
Race, ethnicity, and origin ACS 2023
- Neighborhood character
- Predominantly White (90%)
- Race & ethnicity
- White 90% Black 5% Two or more races 3% Hispanic / Latino 1%
- Common ancestry
- Slovak 2% Italian 1%
- Foreign-born
- 1% · Canada
- Languages at home
- 99% English-only · Spanish 1%
Political lean MEDSL · Clay
- 2024 margin
- Solid R (+80.3) · D 9.2% · R 89.5% · Other 1.3%
- 2008→2024 swing
- -23.9pp toward R · 2008: -56.5pp · 2024: -80.3pp
- All cycles
- 2024: R+80.3 2020: R+77.0 2016: R+75.6 2012: R+68.6 2008: R+56.5
Not yet ingested
- Civics
- —
Market trends
- HPI YoY
- ▲ 50.40%
- Current HPI
- 290.0025
- Rent YoY
- —
- Metro
- —
- State GDP YoY
- ▲ 1.81%
- F500 in state
- 4
Industry mix (Fortune 500 HQ in KY)
| Industry | F500 HQs | Revenue |
|---|---|---|
| Healthcare | 1 | $118B |
|
||
| Food / Beverage | 1 | $7B |
|
||
Price history
-15.6% since first listed25 events — show timeline
- 2026-05-01 Listed $135,000 ImagineMLS
- 2026-02-02 Price Changed $147,000 ImagineMLS
- 2026-01-20 Price Changed $149,945 ImagineMLS
- 2025-12-11 Price Changed $149,950 ImagineMLS
- 2025-12-08 Price Changed $149,985 ImagineMLS
- 2025-12-03 Price Changed $149,988 ImagineMLS
- 2025-11-26 Price Changed $149,990 ImagineMLS
- 2025-11-05 Relisted — ImagineMLS
- 2025-10-04 Contingent — ImagineMLS
- 2025-10-04 Listing Removed — ImagineMLS
- 2025-10-03 Price Changed $149,995 ImagineMLS
- 2025-09-30 Price Changed $149,997 ImagineMLS
- 2025-09-29 Price Changed $149,998 ImagineMLS
- 2025-09-12 Price Changed $149,999 ImagineMLS
- 2025-09-09 Price Changed $157,498 ImagineMLS
- 2025-09-04 Price Changed $157,499 ImagineMLS
- 2025-08-17 Price Changed $157,500 ImagineMLS
- 2025-08-13 Price Changed $159,987 ImagineMLS
- 2025-08-04 Price Changed $159,989 ImagineMLS
- 2025-07-20 Price Changed $159,990 ImagineMLS
- 2025-05-28 Relisted — ImagineMLS
- 2025-04-11 Contingent — ImagineMLS
- 2025-03-23 Relisted — ImagineMLS
- 2025-03-22 Listed $160,000 ImagineMLS
- 2025-03-22 Listing Removed — ImagineMLS
Cash-flow waterfall
monthlySold comps — $/sqft
last 12 mo · ≤1 miLoading sold comps…