92 Coal Bucket Rd · Coldiron, KY
Flood risk 1/10 · Minimal
- FEMA flood zone
- X (unshaded)
- Chance of flooding over 30 yrs
- 0.0%
- Est. flood insurance / yr
- $507 – $1,088
Fire risk 5/10 · Moderate
- Est. fire insurance / yr
- $839 – $1,559
Heat risk 5/10 · Moderate
- Hot days now (above 99°F)
- 9 days/yr
- Hot days in 30 yrs
- 24 days/yr
Wind risk 2/10 · Minimal
- Chance of severe wind over 30 yrs
- 2.0%
Air-quality risk 2/10 · Minimal
- Unhealthy air days now
- 1 days/yr
- Unhealthy air days in 30 yrs
- 1 days/yr
Risk factors via First Street. Map © Google.
Why this score? — see what drove the D- grade
The composite is a weighted blend of 9 inputs, each scored 0–100. Each bar is that input's sub-score; the figure is the points it added to the 100-point composite (weight × sub-score).
- Cash flow +11.9/30.0
- ARV discount +7.5/15.0
- Appreciation +3.8/10.0
- DSCR +3.5/10.0
- Livability +3.0/5.0
- Rent growth +2.5/5.0
- Condition / age +2.5/5.0
- 1% rule +2.3/10.0
- Schools +2.0/10.0
$121,600
🖨 Deal sheet 📄 Offer letter ✓ Due diligence
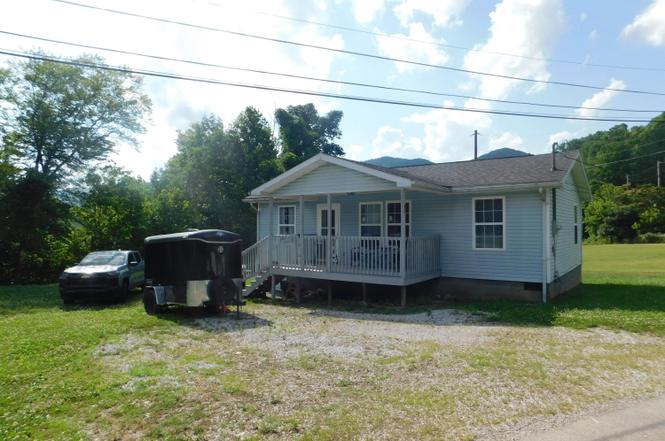
Listing remarks
This cozy three bedroom home is move in ready with a nice flat yard! The home is conveniently located between Harlan and Pineville giving you an opportunity to shop or work in either town!
Key facts
- 6,970 sq ft lot
- Built 1998
- Listed 7 days
Property features AI
Finance
- Other: Lot size approximately 0.16 acres (public records)
Exterior
- Parking: Driveway
- Utilities: Public water; Septic tank; Electricity connected; Water connected
- Home design: Single-story house
- Construction: Vinyl siding; Block foundation; Shingle roof; Built as a house
- Exterior features: Mountain and neighborhood views; Not waterfront
Interior
- Kitchen: Eat-in kitchen
- Bedrooms: 2 total rooms (includes bedrooms and other rooms)
- Flooring: Carpet; Laminate
- Bathrooms: 1 full bathroom
- Heating & cooling: Heat pump heating; Ceiling fan(s) for cooling; Heat pump cooling
- Interior features: Eat-in kitchen; Ceiling fan(s); Primary bedroom on the first floor; Window treatments
- Laundry & utility: Washer hookup on main level; Electric dryer hookup
Neighborhood map
What this means for you Summary
Snapshot
- This is a 3-bed/1.0-bath other listed at $122k.
Deal economics
- At list price, monthly cash flow is $-30 ($-362/yr) — negative.
- To cash-flow at today's rent, offer at most $116k (4.4% below list).
- To meet the 1% rule (rent ≥ 1% of price), the offer needs to be $89k (26.8% below list).
- Recommended offer: $89k (26.8% below list) — sets the bar for 1% rule.
Location & tenants
- Location reads 60/100 on livability (#398 in KY) — a middle-class / working-renter tenant base. Strengths: cost of living A+, housing A+; Watch: amenities F, commute F, health & safety F.
- Harlan County (rural): math 16% / reading 35% proficiency, ranked #149 of 165 in KY (top 90%) — low school quality limits family demand, transient renter base, plan for 1-2y turnover; 65% free/reduced lunch — lower-income household profile, screen leases tightly.
- Zoned schools: Harlan County High School (math 17% / reading 27%, grade F, #202 of 254 statewide, top 82%, 997 students, 80% FRL) — zoned schools average 80% FRL vs 65% district-wide (16 pts higher); higher-poverty schools than district average — tighter screening recommended.
- Market conditions: 2 active listings in the ZIP.
Forward outlook
- Local home prices are declining (-2.4%/yr); year-one equity from $841 of loan paydown is wiped out by about $3k of value loss. Plan a longer hold.
- Harlan County population projected at -34% by 2050 — secular population decline; favor cash flow + early exit over multi-decade hold.
Negotiation context
- Only 7 days on market — expect competitive offers; lowballing is unlikely to land.
- Current owner paid $90k; 35% above their basis — modest negotiation headroom, anchor on the comps not their cost.
Risks & watch-outs
- Climate carrying-cost: moderate wildfire risk; extreme-heat days projected 9→24/yr by 2055 (HVAC capex compounding) — expect insurance premiums to compound above CPI over the hold.
Questions for the listing agent
- What do current leases actually rent for vs. the listed asking? Can we see a recent rent roll and the last 12 months of T-12 income?
- Is there a deadline driving the sale (1031 exchange, divorce, estate, relocation)? That informs how much negotiation room exists.
- Schools are F-rated, which usually means shorter tenancies and higher turnover. Who's the typical renter profile here, and what's been the actual vacancy rate?
- The area grade is low — what's the realistic commute time and amenity access for the typical tenant pool here? Any planned neighborhood developments (good or bad) we should know about?
- What's the average days-on-market for RENTAL listings here right now (not sales)? A rising rental-DOM trend means longer vacancies and softer asking-rent achievability than the comps imply.
- What's the recent tenant-quality profile in this submarket — average credit score on applications, eviction rate, late-payment / NSF rate, and stable-employment percentage? A property-management company in the area should have these aggregated.
- How much new for-sale + rental construction is in the pipeline within 1–3 miles? Heavy new supply typically softens prices + rents 12–24 months out; constrained supply supports both.
Investment metrics
- 1% rule
- 0.73% ✗
- Cap rate
- 6.00%
- Cash-on-cash
- -1.06%
- DSCR
- 0.95
- GRM
- 11.4
CMA / ARV
No comps found within radius.
Projected returns pro-forma
-2.44% appreciation · 3.0% rent growth · sell at horizon
- IRR
- -14.7%
- Equity multiple
- 0.45×
- Total profit
- $-18,833
- Equity at exit
- $21,157
- IRR
- -6.9%
- Equity multiple
- 0.51×
- Total profit
- $-16,606
- Equity at exit
- $15,786
Cash invested: $34,048 (down + closing). Projections, not guarantees.
Landlord ↔ Tenant lean methodology
- Overall (STATE)
- 83 Strongly Landlord-Friendly
- State Kentucky
- 83 Strongly Landlord-Friendly · R+16
- County
- — inherits STATE
- City
- — inherits STATE
ZIP-level market 40819
- Home prices YoY
- -1.6%
- Active inventory
- 2
- Price-to-rent
- 11.4×
Monthly cashflow live
- Estimated rent
- $890 medium interval (Pro) →
- Mortgage (P&I)
- −$638
- Tax from tax record
- −$45 /mo · $536/yr
- Insurance
- −$51
- HOA
- −$0
- Vacancy / Maint / Mgmt
- −$187
- Net cashflow
- $-30
Break-even live
UW: 25.0% down · 7.5% · 30yr · 1.5% tax · 5.0% vac · 8.0% maint · 8.0% mgmt
Financing live
Cash to close
- Down payment
- $30,400
- Closing costs
- $3,648
- Reserves months
- —
- Total cash needed
- —
Loan-product check · same deal, 3 products live
Conventional
25% down · 7.5% · 30yr
- Down + closing
- —
- Monthly P&I
- —
- Monthly cashflow
- —
- DSCR
- —
- Eligible?
- —
Personal DTI + credit; lowest rate.
DSCR
20% down · 8.5% · 30yr
- Down + closing
- —
- Monthly P&I
- —
- Monthly cashflow
- —
- DSCR
- —
- Eligible?
- —
No personal income docs; deal must DSCR.
Hard money
10% down · 12.0% · 12mo
- Down + closing
- —
- Monthly P&I
- —
- Monthly cashflow
- —
- DSCR
- —
- Eligible?
- —
Short-term bridge; refi at stabilization.
Listing history 6 events
-
2026-06-18days on market $121,600 Active 7 DOM
-
2026-06-17days on market $121,600 Active 6 DOM
-
2026-06-16days on market $121,600 Active 5 DOM
-
2026-06-15days on market $121,600 Active 4 DOM
-
2026-06-13remarks 189-char remark
-
2026-06-13$121,600 Active 2 DOM
ⓘ Source: listings_history table (triggers on properties + properties_extension) + one-shot
backfill from property_details.listing_events for pre-trigger history.
Tax reassessment forecast KY · Resets to sale price
- Current annual tax
- $536 · $45/mo
- Projected year-2 tax
- $1,046 · $87/mo
- Expected delta
- +$509/yr (+$42/mo · 95.0%)
ⓘ Screening estimate from a state-policy table — verify with the county assessor before closing.
Climate risk First Street
- Flood 1/10 Low FEMA zone X (unshaded) · 0% chance over 30 yrs
- Wildfire 5/10 Major
- Heat 5/10 Major 9 d/yr ≥99°F today · 24 d/yr by 30 yrs out
- Wind 2/10 Low 2% chance of damaging wind over 30 yrs
- Air quality 2/10 Low 1 unhealthy d/yr today · 1 by 30 yrs out
Nearby sold comps map
Loading sold comps map…
Walkable amenities ~0.75 mi
Loading nearby amenities…
Taxation est. · year 1
- Rental income
- $10,677
- − Mortgage interest
- −$6,811
- − Property taxes
- −$536
- − Insurance
- −$608
- − Repairs & maintenance
- −$854
- − Management
- −$854
- − Depreciation
- −$3,537
- Taxable loss
- −$2,525
- Est. tax savings @ 24.0%
- +$606
- After-tax cash flow
- $244/yr
For passive investors: Depreciation is non-cash, so a rental often shows a tax loss while cash-flowing — sheltering income. Rental losses are passive: they offset passive income freely, and up to $25,000/yr can offset ordinary (W-2) income if you actively participate and your MAGI is under $100k (phasing out to $0 by $150k); unused losses carry forward. On sale, claimed depreciation is recaptured at up to 25%, and gains may owe capital-gains tax (a 1031 exchange can defer both). Figures are a year-1 estimate at your 24.0% rate — not tax advice; consult a CPA.
Schools (NCES district)
- District
- Harlan County
- NCES district ID
- 2102540
- Math proficiency
- 16% ▼ -26.00%
- Reading proficiency
- 35% ▼ -24.00%
- Median HH income
- $26,283
- Composite
- 20.13/100
- National rank
- #8642
- State rank
- #149 of 165 in KY
Livability — Coldiron
- Score
- 60/100
- State rank
- #398
- US rank
- #19093
Category grades
Schools grade is shown separately in the Schools card above.
Census & demographics
- Census place
- Coldiron, KY
- Population (ZIP)
- 632
Population outlook (Harlan County) Hauer SSP2
- Today (2025)
- 24,324 people
- By 2030
- 22,492 · -7.5%
- By 2040
- 19,052 · -21.7%
- By 2050
- 16,060 · -34.0%
- By 2075
- 10,525 · -56.7%
- By 2100
- 6,933 · -71.5%
Race, ethnicity, and origin ACS 2023
- Neighborhood character
- Predominantly White (92%)
- Race & ethnicity
- White 92% Two or more races 3%
- Common ancestry
- Slovak 4%
Political lean MEDSL · Harlan
- 2024 margin
- Solid R (+76.2) · D 11.6% · R 87.7%
- 2008→2024 swing
- -30.0pp toward R · 2008: -46.2pp · 2024: -76.2pp
- All cycles
- 2024: R+76.2 2020: R+71.8 2016: R+72.2 2012: R+64.0 2008: R+46.2
Not yet ingested
- Civics
- —
Market trends
- HPI YoY
- ▼ -2.44%
- Current HPI
- 147.8311
- Rent YoY
- —
- Metro
- —
- State GDP YoY
- ▲ 1.81%
- F500 in state
- 4
Industry mix (Fortune 500 HQ in KY)
| Industry | F500 HQs | Revenue |
|---|---|---|
| Healthcare | 1 | $118B |
|
||
| Food / Beverage | 1 | $7B |
|
||
Price history
+35.1% since first listed2 events — show timeline
- 2026-06-10 Listed $121,600 ImagineMLS
- 2025-10-27 Sold (Public Records) $90,000 Public Records
Property tax history
-0.1%/yrLatest (2025): $536 · -0.2% YoY. Source: county tax records.
Cash-flow waterfall
monthlySold comps — $/sqft
last 12 mo · ≤1 miLoading sold comps…