1 Van Dyke Rd · Albany, NY
Flood risk 1/10 · Minimal
- FEMA flood zone
- X (unshaded)
- Chance of flooding over 30 yrs
- 0.0%
- Est. flood insurance / yr
- $473 – $860
Fire risk 3/10 · Minor
- Est. fire insurance / yr
- $691 – $1,283
Heat risk 4/10 · Minor
- Hot days now (above 98°F)
- 7 days/yr
- Hot days in 30 yrs
- 17 days/yr
Wind risk 3/10 · Minor
- Chance of severe wind over 30 yrs
- 7.0%
Air-quality risk 1/10 · Minimal
- Unhealthy air days now
- 0 days/yr
- Unhealthy air days in 30 yrs
- 0 days/yr
Risk factors via First Street. Map © Google.
Why this score? — see what drove the D+ grade
The composite is a weighted blend of 9 inputs, each scored 0–100. Each bar is that input's sub-score; the figure is the points it added to the 100-point composite (weight × sub-score).
- ARV discount +15.0/15.0
- Cash flow +10.7/30.0
- Schools +6.5/10.0
- 1% rule +4.8/10.0
- Livability +4.0/5.0
- DSCR +3.1/10.0
- Rent growth +2.5/5.0
- Condition / age +2.5/5.0
- Appreciation +0.0/10.0
$259,900
🖨 Deal sheet 📄 Offer letter ✓ Due diligence
Listing remarks
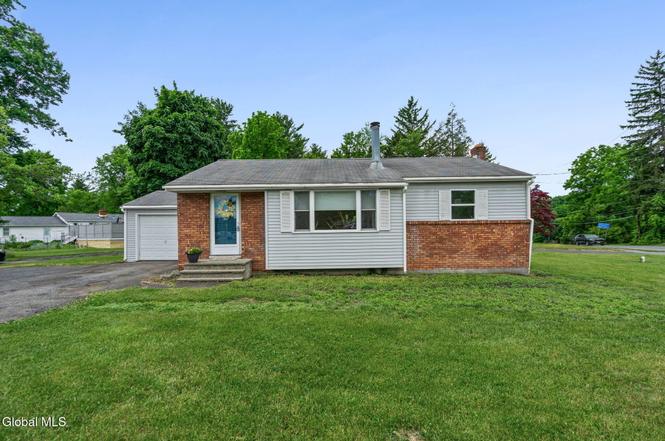
Cherished by the same family for many years, this light, bright, and move-in-ready home sits proudly on a spacious corner lot in the top-rated Bethlehem School District. Offering unbeatable convenience, the property is just steps to Bethlehem High School and Eagle Elementary, and walking distance to the dog park, the Van Dyke Preserve, the town ballpark, fitness trails, and the town pools and recreation facilities, as well as the CDTA bus stop and Park and Ride. Inside, the welcoming layout features a cozy gas fireplace in the living room, the everyday ease of first-floor laundry, and a convenient attached garage. You will have plentiful storage space thanks to both a full basement and atti
Key facts
- Cozy gas fireplace
- Corner lot
- First-floor laundry
Tags
Property features AI
Exterior
- Parking: Attached garage (1 car); Off-street parking; Driveway parking; Total parking for 5 vehicles
- Utilities: Public water; Public sewer; Circuit breaker electrical service; Cable available and connected
- Home design: Single family residence; Entry level: First floor
- Construction: Brick and vinyl siding exterior; Asphalt roof; Block foundation; Full unfinished basement with interior entry and sump pump
- Exterior features: Paved driveway; Corner lot; Level lot; Road frontage
Interior
- Kitchen: Dishwasher; Microwave; Oven; Refrigerator
- Bedrooms: Three bedrooms on the first floor
- Flooring: Tile; Vinyl; Hardwood
- Bathrooms: One full bathroom on the first floor
- Heating & cooling: Baseboard heating; Hot water heating; Natural gas
- Interior features: High-speed internet; Storm door(s)
- Laundry & utility: Washer and dryer included; Laundry closet on the upper level
Neighborhood map
What this means for you Summary
Snapshot
- This is a 3-bed/1.0-bath single-family listed at $260k.
Deal economics
- At list price, monthly cash flow is $-126 ($-2k/yr) — negative.
- To cash-flow at today's rent, offer at most $238k (8.5% below list).
- To meet the 1% rule (rent ≥ 1% of price), the offer needs to be $254k (2.4% below list).
- Recommended offer: $238k (8.5% below list) — sets the bar for cash-flow.
Location & tenants
- Location reads 79/100 on livability (#129 in NY, #2,083 nationally) — a middle-class / working-renter tenant base. Strengths: amenities A+, commute A+, housing A+; Watch: employment C-, crime F.
- Bethlehem Central School District (suburban): math 70% / reading 74% proficiency, ranked #90 of 590 in NY (top 15%) — strong family-tenant draw, lease renewals of 3-5y typical; only 7% free/reduced lunch — higher-income household profile.
- Zoned schools: Eagle Elementary School (math 72% / reading 67%, grade A-, #447 of 2,108 statewide, top 24%, 421 students, 10% FRL); Bethlehem Central Senior High School (math 100% / reading 87%, grade A+, #141 of 1,100 statewide, top 13%, 1,364 students, 13% FRL) — zoned schools at 12% FRL track the district average.
- Market conditions: 70 active listings in the ZIP; 2 comparable units currently listed for rent nearby; high-income renter base; 675 units permitted in Albany County in 2024 (451 in 5+ unit buildings).
Forward outlook
- Local home prices are declining (-3.0%/yr); year-one equity from $2k of loan paydown is wiped out by about $8k of value loss. Plan a longer hold.
- Albany County population projected at +9% by 2050 — modest demand growth; plan on rents tracking national, not racing it.
Negotiation context
- Only 2 days on market — expect competitive offers; lowballing is unlikely to land.
- 2 sale attempts with the ask held roughly flat each time — persistent listings suggest the price (not the market) is what's stuck; bring a comps-based counter.
Risks & watch-outs
- Watch-outs: property tax is 3.0% of price.
Questions for the listing agent
- What do current leases actually rent for vs. the listed asking? Can we see a recent rent roll and the last 12 months of T-12 income?
- Built in 1960 — when were the roof, HVAC, electrical panel, plumbing, and water heater last replaced?
- Property tax is high relative to price — has the assessment been appealed recently, and will the sale trigger a re-assessment?
- Is there a deadline driving the sale (1031 exchange, divorce, estate, relocation)? That informs how much negotiation room exists.
- Crime grade is F in this area — have there been break-ins, vandalism, or insurance claims at this property in the last 3 years? What carrier currently insures it and at what premium?
- The area grade is low — what's the realistic commute time and amenity access for the typical tenant pool here? Any planned neighborhood developments (good or bad) we should know about?
- What's the average days-on-market for RENTAL listings here right now (not sales)? A rising rental-DOM trend means longer vacancies and softer asking-rent achievability than the comps imply.
- What's the recent tenant-quality profile in this submarket — average credit score on applications, eviction rate, late-payment / NSF rate, and stable-employment percentage? A property-management company in the area should have these aggregated.
- How much new for-sale + rental construction is in the pipeline within 1–3 miles? Heavy new supply typically softens prices + rents 12–24 months out; constrained supply supports both.
Investment metrics
- 1% rule
- 0.98% ✗
- Cap rate
- 5.71%
- Cash-on-cash
- -2.07%
- DSCR
- 0.91
- GRM
- 8.5
CMA / ARV
- ARV (on-the-fly)
- $353,425
- Comps found
- 3
Show comp detail 3 sales within ~0.75 mi
| Address | Dist | Beds/Ba | Sqft | Sold | Price | $/sf | Match |
|---|---|---|---|---|---|---|---|
| 42 Brockley Dr | 0.26mi | 3/1.0 | 1,050 (-0%) | 10mo | $343,000 | $327 | 79 |
| 18 Evelyn Dr | 0.26mi | 3/1.0 | 1,062 (+1%) | 23mo | $363,000 | $342 | 67 |
| 88 Brockley Dr | 0.45mi | 3/1.0 | 1,000 (-5%) | 22mo | $335,000 | $335 | 52 |
Match score weights: distance 35% · size 25% · config 20% · recency 20%. Top-matched comps best support the ARV.
Projected returns pro-forma
-3.0% appreciation · 3.0% rent growth · sell at horizon
- IRR
- -19.6%
- Equity multiple
- 0.31×
- Total profit
- $-49,869
- Equity at exit
- $38,752
- IRR
- -12.2%
- Equity multiple
- 0.28×
- Total profit
- $-52,734
- Equity at exit
- $22,471
Cash invested: $72,772 (down + closing). Projections, not guarantees.
Landlord ↔ Tenant lean methodology
- Overall (STATE)
- 15 Strongly Tenant-Friendly
- State New York
- 15 Strongly Tenant-Friendly · D+10
- County
- — inherits STATE
- City
- — inherits STATE
ZIP-level market 12054
- Active inventory
- 70
- Price-to-rent
- 8.5×
Monthly cashflow live
- Estimated rent
- $2,538 medium interval (Pro) →
- Mortgage (P&I)
- −$1,363
- Tax from tax record
- −$659 /mo · $7,910/yr
- Insurance
- −$108
- HOA
- −$0
- Vacancy / Maint / Mgmt
- −$533
- Net cashflow
- $-126
Break-even live
UW: 25.0% down · 7.5% · 30yr · 1.5% tax · 5.0% vac · 8.0% maint · 8.0% mgmt
Financing live
Cash to close
- Down payment
- $64,975
- Closing costs
- $7,797
- Reserves months
- —
- Total cash needed
- —
Loan-product check · same deal, 3 products live
Conventional
25% down · 7.5% · 30yr
- Down + closing
- —
- Monthly P&I
- —
- Monthly cashflow
- —
- DSCR
- —
- Eligible?
- —
Personal DTI + credit; lowest rate.
DSCR
20% down · 8.5% · 30yr
- Down + closing
- —
- Monthly P&I
- —
- Monthly cashflow
- —
- DSCR
- —
- Eligible?
- —
No personal income docs; deal must DSCR.
Hard money
10% down · 12.0% · 12mo
- Down + closing
- —
- Monthly P&I
- —
- Monthly cashflow
- —
- DSCR
- —
- Eligible?
- —
Short-term bridge; refi at stabilization.
Rent comps 2 comps
| Address | Beds | Baths | Sqft | Rent | $/sqft | DOM | Units | Dist |
|---|---|---|---|---|---|---|---|---|
| 101 Cherry Ave Delmar, NY | 1.0–2.0 | 1.0–2.0 | 925 | $1,769 | $1.91 | 14d | 1 | 0.53mi |
| 535 Dawson Rd Delmar, NY | 2.0 | 1.5 | 1150 | $2,600 | $2.26 | 14d | 1 | 0.56mi |
Listing history 3 events
-
2026-06-18days on market $259,900 Active 2 DOM
-
2026-06-16remarks 699-char remark
-
2026-06-16$259,900 Active 1 DOM
ⓘ Source: listings_history table (triggers on properties + properties_extension) + one-shot
backfill from property_details.listing_events for pre-trigger history.
Tax reassessment forecast NY · Partial reset (capped growth)
- Current annual tax
- $7,910 · $659/mo
- Projected year-2 tax
- $7,910 · $659/mo
- Expected delta
- $0/yr ($0/mo · 0.0%)
ⓘ Screening estimate from a state-policy table — verify with the county assessor before closing.
Climate risk First Street
- Flood 1/10 Low FEMA zone X (unshaded) · 0% chance over 30 yrs
- Wildfire 3/10 Moderate
- Heat 4/10 Moderate 7 d/yr ≥98°F today · 17 d/yr by 30 yrs out
- Wind 3/10 Moderate 7% chance of damaging wind over 30 yrs
- Air quality 1/10 Low 0 unhealthy d/yr today · 0 by 30 yrs out
Nearby sold comps map
Loading sold comps map…
Walkable amenities ~0.75 mi
Loading nearby amenities…
Taxation est. · year 1
- Rental income
- $30,453
- − Mortgage interest
- −$14,558
- − Property taxes
- −$7,910
- − Insurance
- −$1,300
- − Repairs & maintenance
- −$2,436
- − Management
- −$2,436
- − Depreciation
- −$7,561
- Taxable loss
- −$5,748
- Est. tax savings @ 24.0%
- +$1,380
- After-tax cash flow
- $-127/yr
For passive investors: Depreciation is non-cash, so a rental often shows a tax loss while cash-flowing — sheltering income. Rental losses are passive: they offset passive income freely, and up to $25,000/yr can offset ordinary (W-2) income if you actively participate and your MAGI is under $100k (phasing out to $0 by $150k); unused losses carry forward. On sale, claimed depreciation is recaptured at up to 25%, and gains may owe capital-gains tax (a 1031 exchange can defer both). Figures are a year-1 estimate at your 24.0% rate — not tax advice; consult a CPA.
Schools (NCES district)
- District
- Bethlehem Central School District
- NCES district ID
- 3604710
- Math proficiency
- 70% ▼ -8.00%
- Reading proficiency
- 74% ▲ 7.00%
- Median HH income
- $94,967
- Composite
- 65.31/100
- National rank
- #488
- State rank
- #90 of 590 in NY
Livability — Albany
- Score
- 79/100
- State rank
- #129
- US rank
- #2083
Category grades
Schools grade is shown separately in the Schools card above.
Census & demographics
- County
- Albany County · 196,626 people
- City population
- 116,921
- Metro
- Albany-Schenectady-Troy, NY
- Population (ZIP)
- 17,436
- Household income
- $129,583
- Rent vs Own
- Severe rent burden
- 410.0
Population outlook (Albany County) Hauer SSP2
- Today (2025)
- 320,794 people
- By 2030
- 327,401 · +2.1%
- By 2040
- 338,218 · +5.4%
- By 2050
- 348,467 · +8.6%
- By 2075
- 381,693 · +19.0%
- By 2100
- 393,809 · +22.8%
Race, ethnicity, and origin ACS 2023
- Neighborhood character
- Predominantly White (92%)
- Race & ethnicity
- White 92% Two or more races 4% Hispanic / Latino 3% Asian 2%
- Common ancestry
- Romanian 4% Lithuanian 4% Slovak 3%
- Foreign-born
- 5% · Canada, South Korea
- Languages at home
- 94% English-only · Other Asian/Pacific 2% German/W. Germanic 1% Other Indo-European 1%
Political lean MEDSL · Albany
- 2024 margin
- Strong D (+25.8) · D 62.9% · R 37.1%
- 2008→2024 swing
- -3.6pp toward R · 2008: 29.4pp · 2024: 25.8pp
- All cycles
- 2024: D+25.8 2020: D+31.4 2016: D+24.3 2012: D+31.0 2008: D+29.4
Not yet ingested
- Civics
- —
Market trends
- HPI YoY
- ▼ -295.31%
- Current HPI
- 286.6343
- Rent YoY
- —
- Metro
- Albany-Schenectady-Troy, NY
- State GDP YoY
- ▲ 2.60%
- F500 in state
- 92
Industry mix (Fortune 500 HQ in NY)
| Industry | F500 HQs | Revenue |
|---|---|---|
| Financial Services | 10 | $950B |
|
||
| Consumer Goods | 9 | $162B |
|
||
| Insurance | 4 | $225B |
|
||
| Telecommunications | 2 | $144B |
|
||
| Pharmaceuticals | 2 | $112B |
|
||
| Media / Entertainment | 2 | $69B |
|
||
Price history
-6.8% since first listed8 events — show timeline
- 2026-06-16 Listed $259,900 Global MLS
- 2026-01-06 Listing Removed — Global MLS
- 2025-12-29 Price Changed $245,900 Global MLS
- 2025-12-03 Price Changed $254,000 Global MLS
- 2025-11-23 Price Changed $259,000 Global MLS
- 2025-11-20 Price Changed $263,900 Global MLS
- 2025-11-13 Price Changed $268,900 Global MLS
- 2025-11-11 Listed $278,900 Global MLS
Property tax history
+18.5%/yrLatest (2025): $7,910 · +2.0% YoY. Source: county tax records.
Cash-flow waterfall
monthlySold comps — $/sqft
last 12 mo · ≤1 miLoading sold comps…