4045 Hodgson Rd #107 · Shoreview, MN
Flood risk 1/10 · Minimal
- FEMA flood zone
- X (unshaded)
- Chance of flooding over 30 yrs
- 0.0%
- Est. flood insurance / yr
- $473 – $860
Fire risk 1/10 · Minimal
- Est. fire insurance / yr
- $888 – $1,650
Heat risk 2/10 · Minimal
- Hot days now (above 100°F)
- 7 days/yr
- Hot days in 30 yrs
- 14 days/yr
Wind risk 2/10 · Minimal
- Chance of severe wind over 30 yrs
- —
Air-quality risk 2/10 · Minimal
- Unhealthy air days now
- 1 days/yr
- Unhealthy air days in 30 yrs
- 1 days/yr
Risk factors via First Street. Map © Google.
Why this score? — see what drove the D grade
The composite is a weighted blend of 9 inputs, each scored 0–100. Each bar is that input's sub-score; the figure is the points it added to the 100-point composite (weight × sub-score).
- Cash flow +8.9/30.0
- ARV discount +7.5/15.0
- 1% rule +6.4/10.0
- Schools +5.4/10.0
- Livability +4.0/5.0
- Rent growth +3.4/5.0
- DSCR +2.5/10.0
- Condition / age +2.5/5.0
- Appreciation +0.0/10.0
$142,000
🖨 Deal sheet (PDF) 📄 Offer letter ✓ Due diligence
Listing remarks MLS
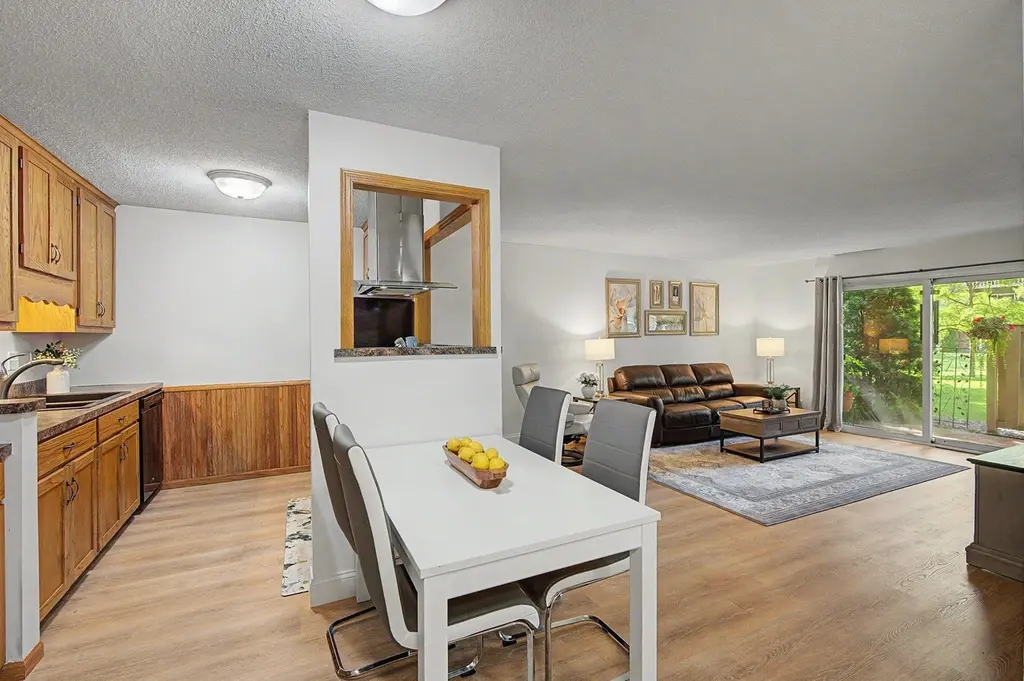
MINT CONDTION GARDEN LEVEL W/ ACCESS TO THE OUTDOOR SWIMMING POOL & GREEN SPACERIGHT FROM YOUR VERY PRIVATE PATIO.BEAUTIFUL REMODELED KITCHEN FEAT ABUNDANCE OF CABINETS&COUNTER SPACE . OPEN TO THE LIVING RM.NEW FLOORING IN LIVING RM, 6 INCH BASEBOARD THRU OUT & NEW CARPETING IN OWNERS SUITE WHICH FEATURES ADDITIONAL CLOSET SPACE INSTALLED BY PREVIOUS OWNERS.NEW WALL A/C, FRESH PAINTED INTERIOR SHARED AMENTIES FEAT EXERCISE RM,PARTY RM, LAUNDRYRM, LIBRARY, STORAGE RM FOR BIKES & GUEST SUITE. WALKING DISTANCE TO SNAIL LK REGIONAL PARK & TRAILS & CLOSE TO SHOPPING & EASY ACESS TO BOTH DOWNTOWNS
Key facts
- Close to parks
- Community pool
- Natural light
Tags
Property features AI
Finance
- Other: Association fee assessed monthly
- HOA & community: Self-managed association; Monthly association fee (includes controlled access, hazard insurance, lawn care, grounds maintenance, sewer, shared amenities, snow removal, water); Elevator(s) available; Shared amenities: Amusement/party room, community room, exercise room, guest suite
Exterior
- Parking: Underground garage with heater and garage door opener; 1 garage space
- Utilities: City water connected; City sewer connected; Natural gas
- Home design: Attached residential property; One story; Slab foundation
- Construction: Brick and concrete construction
- Exterior features: Patio; Stone exterior; Below-ground pool; Lot approximately 4.22 acres
Interior
- Kitchen: Dishwasher; Microwave; Refrigerator; Exhaust fan
- Bedrooms: One bedroom (Main level) — approx. 15 x 15
- Bathrooms: One full bathroom (Main level)
- Heating & cooling: Baseboard heating; Wall unit(s) for cooling
- Interior features: Dishwasher; Exhaust fan; Microwave; Refrigerator; Main floor full bath; No basement
- Laundry & utility: Laundry in common area
Neighborhood map
What this means for you Summary
Snapshot
- This is a 1-bed/1.0-bath condo listed at $142k.
Deal economics
- At list price, monthly cash flow is $-114 ($-1k/yr) — negative.
- To cash-flow at today's rent, offer at most $122k (14.2% below list).
- Meets the 1% rule at list price ($2k rent vs $142k).
- Recommended offer: $122k (14.2% below list) — sets the bar for cash-flow.
- Cap rate 5.3% vs local median 3.8% in Shoreview — top-decile yield for the area; either an underpriced asset or a hidden risk that comps aren't pricing in. Stress-test before assuming the spread holds.
Location & tenants
- Location reads 79/100 on livability (#89 in MN, #2,019 nationally) — a middle-class / working-renter tenant base. Strengths: crime A+, commute A+, employment A+; Watch: cost of living C-, amenities F, health & safety F.
- Mounds View Public School District (suburban): math 58% / reading 64% proficiency, ranked #30 of 301 in MN (top 10%) — acceptable for families but not a draw, mixed tenant base, ~2y average lease.
- Zoned schools: Island Lake Elementary (math 72% / reading 68%, grade A-, #71 of 857 statewide, top 8%, 743 students, 20% FRL); Chippewa Middle School (math 62% / reading 74%, grade A-, #8 of 258 statewide, top 3%, 1,089 students, 17% FRL); Mounds View Senior High (math 77% / reading 74%, grade A-, #5 of 471 statewide, top 1%, 1,901 students, 18% FRL).
- Market conditions: Rents rising (+3.7%/yr); 153 active listings in the ZIP; 4 comparable units currently listed for rent nearby; rentals leasing fast (median 1d on market — plan ~1-2 weeks tenant-placement turnaround); solid renter incomes; 1,202 units permitted in Ramsey County in 2024 (880 in 5+ unit buildings).
- This rent is only 18% of the median local income ($108k/yr) — well below the 30% rent-burden line; pricing power to push rent on renewal without tenant pushback.
Forward outlook
- Local home prices are declining (-3.0%/yr); year-one equity from $982 of loan paydown is wiped out by about $4k of value loss. Plan a longer hold.
- Ramsey County population projected at +27% by 2050 — long-run rental-demand tailwind backs the buy-and-hold thesis.
Negotiation context
- It's been on market 18 days — a 2% lower offer ($140k) is reasonable based on typical stale-listing flexibility.
- 7 sale attempts since 34y ago with the ask held roughly flat each time — persistent listings suggest the price (not the market) is what's stuck; bring a comps-based counter.
Risks & watch-outs
- Watch-outs: HOA is 26% of rent.
Questions for the listing agent
- What do current leases actually rent for vs. the listed asking? Can we see a recent rent roll and the last 12 months of T-12 income?
- Built in 1971 — when were the roof, HVAC, electrical panel, plumbing, and water heater last replaced?
- What does the HOA fee cover, when was the last increase, and are there any pending special assessments or reserve-fund shortfalls?
- Any open or pending special assessments — roof, HVAC, plumbing, elevator, façade? What's the per-unit balance and payoff schedule, and is the seller paying it off at close or rolling it to the buyer?
- Is there a deadline driving the sale (1031 exchange, divorce, estate, relocation)? That informs how much negotiation room exists.
- Schools are A-rated — typically a magnet for longer-tenancy family renters. What's the average tenant stay here, and is there a school-zone premium baked into asking?
- The area grade is low — what's the realistic commute time and amenity access for the typical tenant pool here? Any planned neighborhood developments (good or bad) we should know about?
- What's the average days-on-market for RENTAL listings here right now (not sales)? A rising rental-DOM trend means longer vacancies and softer asking-rent achievability than the comps imply.
- What's the recent tenant-quality profile in this submarket — average credit score on applications, eviction rate, late-payment / NSF rate, and stable-employment percentage? A property-management company in the area should have these aggregated.
- How much new apartment / multifamily construction is in the pipeline within 1–3 miles? Heavy new supply (>2% of stock underway) typically softens rents 12–24 months out; light construction supports rent growth.
Investment metrics
- 1% rule
- 1.14% ✓
- Cap rate
- 5.33%
- Cash-on-cash
- -3.45%
- DSCR
- 0.85
- GRM
- 7.3
CMA / ARV
No comps found within radius.
Projected returns pro-forma
-3.0% appreciation · 3.67% rent growth · sell at horizon
- IRR
- -20.7%
- Equity multiple
- 0.27×
- Total profit
- $-28,915
- Equity at exit
- $21,173
- IRR
- -11.5%
- Equity multiple
- 0.27×
- Total profit
- $-28,862
- Equity at exit
- $12,278
Cash invested: $39,760 (down + closing). Projections, not guarantees.
Landlord ↔ Tenant lean methodology
- Overall (STATE)
- 46 Balanced
- State Minnesota
- 46 Balanced · D+2
- County
- — inherits STATE
- City
- — inherits STATE
ZIP-level market 55126
- Rents YoY
- 3.7%
- Active inventory
- 153
- Price-to-rent
- 7.3×
Monthly cashflow live
- Estimated rent
- $1,618 medium interval (Pro) →
- Mortgage (P&I)
- −$745
- Tax from tax record
- −$165 /mo · $1,984/yr
- Insurance
- −$59
- HOA
- −$423
- Lot rent
- −$0
- Vacancy / Maint / Mgmt
- −$340
- Net cashflow
- $-114
Break-even live
Sensitivity live
| Price | -10% $-34 | -5% $-74 | +0% $-114 | +5% $-154 | +10% $-195 |
|---|---|---|---|---|---|
| Rent | -10% $-242 | -5% $-178 | +0% $-114 | +5% $-50 | +10% $13 |
| Rate | -1.0pp $-43 | -0.5pp $-78 | base $-114 | +0.5pp $-151 | +1.0pp $-189 |
UW: 25.0% down · 7.5% · 30yr · 1.5% tax · 5.0% vac · 8.0% maint · 8.0% mgmt
Financing live
Cash to close
- Down payment
- $35,500
- Closing costs
- $4,260
- Reserves months
- —
- Total cash needed
- —
Loan-product check · same deal, 3 products live
Conventional
25% down · 7.5% · 30yr
- Down + closing
- —
- Monthly P&I
- —
- Monthly cashflow
- —
- DSCR
- —
- Eligible?
- —
Personal DTI + credit; lowest rate.
DSCR
20% down · 8.5% · 30yr
- Down + closing
- —
- Monthly P&I
- —
- Monthly cashflow
- —
- DSCR
- —
- Eligible?
- —
No personal income docs; deal must DSCR.
Hard money
10% down · 12.0% · 12mo
- Down + closing
- —
- Monthly P&I
- —
- Monthly cashflow
- —
- DSCR
- —
- Eligible?
- —
Short-term bridge; refi at stabilization.
Rent comps 4 comps
| Address | Beds | Baths | Sqft | Rent | $/sqft | DOM | Units | Dist |
|---|---|---|---|---|---|---|---|---|
| 418 Highway 96 W Saint Paul, MN | 1.0–2.0 | 1.0–2.0 | 867 | $1,480 | $1.71 | 0d | 1 | 1.11mi |
| 3500 Rice St Saint Paul, MN | 2.0 | 1.0–2.0 | 911 | $2,318 | $2.54 | 0d | 18 | 1.16mi |
| 577 Harriet Ave Shoreview, MN | 1.0–2.0 | 1.0–2.0 | 950 | $1,275 | $1.34 | 1d | 30 | 1.41mi |
| 3529 Owasso St Shoreview, MN | 1.0 | 1.0 | 625 | $1,550 | $2.48 | 46d | 1 | 1.46mi |
HOA detail condo
- Monthly dues
- $423 · $5,076/yr
- Likely covers
- pool
- Assessments
- None detected in remarks — confirm with the listing agent.
Listing history 12 events
-
2026-06-22days on market $142,000 Active 18 DOM
-
2026-06-21days on market $142,000 Active 17 DOM
-
2026-06-18days on market $142,000 Active 14 DOM
-
2026-06-17days on market $142,000 Active 13 DOM
-
2026-06-16days on market $142,000 Active 12 DOM
-
2026-06-15days on market $142,000 Active 11 DOM
-
2026-06-13days on market $142,000 Active 9 DOM
-
2026-06-13days on market $142,000 Active 8 DOM
-
2026-06-09days on market $142,000 Active 5 DOM
-
2026-06-08days on market $142,000 Active 4 DOM
-
2026-06-07remarks 699-char remark
-
2026-06-07$142,000 Active 3 DOM
ⓘ Source: listings_history table (triggers on properties + properties_extension) + one-shot
backfill from property_details.listing_events for pre-trigger history.
Tax reassessment forecast MN · Partial reset (capped growth)
- Current annual tax
- $1,984 · $165/mo
- Projected year-2 tax
- $1,984 · $165/mo
- Expected delta
- $0/yr ($0/mo · 0.0%)
ⓘ Screening estimate from a state-policy table — verify with the county assessor before closing.
Climate risk First Street
- Flood 1/10 Low FEMA zone X (unshaded) · 0% chance over 30 yrs
- Wildfire 1/10 Low
- Heat 2/10 Low 7 d/yr ≥100°F today · 14 d/yr by 30 yrs out
- Wind 2/10 Low
- Air quality 2/10 Low 1 unhealthy d/yr today · 1 by 30 yrs out
Nearby sold comps map
Loading sold comps map…
Walkable amenities ~0.75 mi
Loading nearby amenities…
Taxation est. · year 1
- Rental income
- $19,411
- − Mortgage interest
- −$7,954
- − Property taxes
- −$1,984
- − Insurance
- −$710
- − Repairs & maintenance
- −$1,553
- − Management
- −$1,553
- − HOA
- −$5,076
- − Depreciation
- −$4,131
- Taxable loss
- −$3,550
- Est. tax savings @ 24.0%
- +$852
- After-tax cash flow
- $-520/yr
For passive investors: Depreciation is non-cash, so a rental often shows a tax loss while cash-flowing — sheltering income. Rental losses are passive: they offset passive income freely, and up to $25,000/yr can offset ordinary (W-2) income if you actively participate and your MAGI is under $100k (phasing out to $0 by $150k); unused losses carry forward. On sale, claimed depreciation is recaptured at up to 25%, and gains may owe capital-gains tax (a 1031 exchange can defer both). Figures are a year-1 estimate at your 24.0% rate — not tax advice; consult a CPA.
Schools (NCES district)
- District
- Mounds View Public School District
- NCES district ID
- 2722950
- Math proficiency
- 58% ▼ -9.00%
- Reading proficiency
- 64% ▼ -3.00%
- Median HH income
- $72,492
- Composite
- 54.04/100
- National rank
- #1390
- State rank
- #30 of 301 in MN
Livability — Shoreview
- Score
- 79/100
- State rank
- #89
- US rank
- #2019
Category grades
Schools grade is shown separately in the Schools card above.
Census & demographics
- Census place
- Shoreview, MN
- County
- Ramsey County · 542,837 people
- City population
- 27,456
- Metro
- Minneapolis-St. Paul-Bloomington, MN-WI
- Population (ZIP)
- 27,456
- Household income
- $108,217
- Rent vs Own
- Severe rent burden
- 468.0
Population outlook (Ramsey County) Hauer SSP2
- Today (2025)
- 603,431 people
- By 2030
- 636,459 · +5.5%
- By 2040
- 700,596 · +16.1%
- By 2050
- 765,819 · +26.9%
- By 2075
- 929,297 · +54.0%
- By 2100
- 1,053,924 · +74.7%
Race, ethnicity, and origin ACS 2023
- Neighborhood character
- Predominantly White (76%)
- Race & ethnicity
- White 76% Asian 10% Two or more races 7% Hispanic / Latino 5% Black 4%
- Common ancestry
- Portuguese 11% Lithuanian 3% Romanian 3%
- Foreign-born
- 10% · China, Canada, South Korea
- Languages at home
- 88% English-only · Other Indo-European 3% Chinese 3% Spanish 2%
Political lean MEDSL · Ramsey
- 2024 margin
- Solid D (+43.3) · D 70.5% · R 27.2% · Other 2.3%
- 2008→2024 swing
- +9.4pp toward D · 2008: 33.9pp · 2024: 43.3pp
- All cycles
- 2024: D+43.3 2020: D+45.4 2016: D+39.4 2012: D+35.3 2008: D+33.9
Not yet ingested
- Civics
- —
Market trends
- HPI YoY
- ▼ -268.72%
- Current HPI
- 245.484
- Rent YoY
- ▲ 3.67%
- Metro
- Minneapolis-St. Paul-Bloomington, MN-WI
- State GDP YoY
- ▲ 2.41%
- F500 in state
- 34
Industry mix (Fortune 500 HQ in MN)
| Industry | F500 HQs | Revenue |
|---|---|---|
| Healthcare | 2 | $407B |
|
||
| Retail | 2 | $150B |
|
||
| Consumer Goods | 2 | $32B |
|
||
| Industrial Machinery | 2 | $6B |
|
||
| Agriculture | 1 | $40B |
|
||
| Healthcare / Medical Devices | 1 | $32B |
|
||
Price history
+448.3% since first listed26 events — show timeline
- 2026-06-04 Listed $142,000 NORTHSTARMLS as Distributed by MLS Grid
- 2022-09-23 Sold (Public Records) $145,000 Public Records
- 2022-08-26 Sold (MLS) $145,000 NORTHSTARMLS as Distributed by MLS Grid
- 2022-08-16 Pending — NORTHSTARMLS as Distributed by MLS Grid
- 2022-08-10 Listed $145,000 NORTHSTARMLS as Distributed by MLS Grid
- 2021-09-30 Sold (Public Records) $125,000 Public Records
- 2021-09-28 Sold (MLS) $125,000 NORTHSTARMLS as Distributed by MLS Grid
- 2021-08-31 Pending — NORTHSTARMLS as Distributed by MLS Grid
- 2021-08-12 Contingent — NORTHSTARMLS as Distributed by MLS Grid
- 2021-08-06 Listed $120,000 NORTHSTARMLS as Distributed by MLS Grid
- 2017-11-02 Sold (Public Records) $82,876 Public Records
- 2015-07-14 Sold (Public Records) $67,500 Public Records
- 2015-06-23 Sold (MLS) $67,500 NORTHSTARMLS as Distributed by MLS Grid
- 2015-05-20 Pending — NORTHSTARMLS as Distributed by MLS Grid
- 2015-04-22 Listed $70,000 NORTHSTARMLS as Distributed by MLS Grid
- 2014-03-13 Sold (MLS) $59,250 NORTHSTARMLS as Distributed by MLS Grid
- 2014-02-11 Pending — NORTHSTARMLS as Distributed by MLS Grid
- 2014-01-29 Contingent — NORTHSTARMLS as Distributed by MLS Grid
- 2014-01-08 Price Changed $57,500 NORTHSTARMLS as Distributed by MLS Grid
- 2013-12-12 Price Changed $64,900 NORTHSTARMLS as Distributed by MLS Grid
- 2013-11-07 Listed $74,900 NORTHSTARMLS as Distributed by MLS Grid
- 1994-09-26 Sold (MLS) $28,250 NORTHSTARMLS as Distributed by MLS Grid
- 1994-08-29 Listing Removed — NORTHSTARMLS as Distributed by MLS Grid
- 1994-07-05 Listed $29,900 NORTHSTARMLS as Distributed by MLS Grid
- 1992-05-30 Sold (MLS) $24,600 NORTHSTARMLS as Distributed by MLS Grid
- 1992-03-05 Listed $25,900 NORTHSTARMLS as Distributed by MLS Grid
Property tax history
+10.2%/yrLatest (2025): $1,984 · +2.5% YoY. Source: county tax records.
Cash-flow waterfall
monthlySold comps — $/sqft
last 12 mo · ≤1 miLoading sold comps…