 🌊 Lakefront
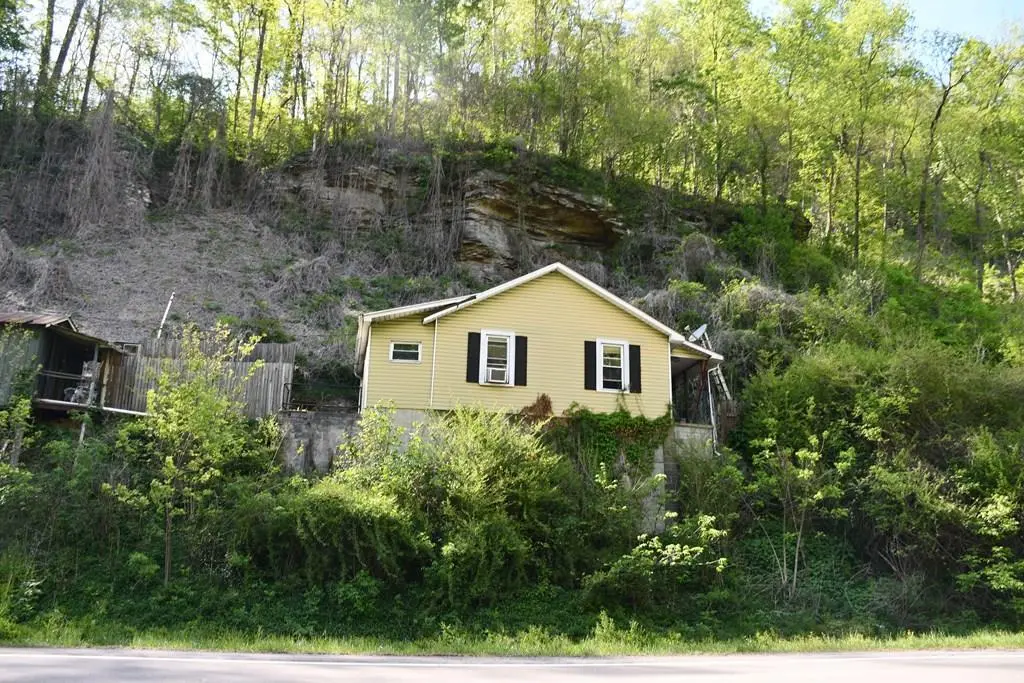
13162 Riverside Dr · Vansant, VA
Flood risk No data
- FEMA flood zone
- —
- Chance of flooding over 30 yrs
- —
- Est. flood insurance / yr
- —
Fire risk No data
- Est. fire insurance / yr
- —
Heat risk No data
- Hot days now (above threshold)
- —
- Hot days in 30 yrs
- —
Wind risk No data
- Chance of severe wind over 30 yrs
- —
Air-quality risk No data
- Unhealthy air days now
- —
- Unhealthy air days in 30 yrs
- —
Risk factors via First Street. Map © Google.
Why this score? — see what drove the A- grade
The composite is a weighted blend of 9 inputs, each scored 0–100. Each bar is that input's sub-score; the figure is the points it added to the 100-point composite (weight × sub-score).
- Cash flow +30.0/30.0
- ARV discount +15.0/15.0
- 1% rule +10.0/10.0
- DSCR +10.0/10.0
- Schools +4.8/10.0
- Appreciation +4.5/10.0
- Livability +2.7/5.0
- Rent growth +2.5/5.0
- Condition / age +2.5/5.0
$50,000
🖨 Deal sheet (PDF) 📄 Offer letter ✓ Due diligence
Listing remarks
Investor Special – Two Homes for the Price of One! Unlock the potential with this unique opportunity featuring two separate homes situated on a little over 2.25 acres. Each home offers 1 bedroom and 1 bathroom, making this an ideal setup for rental income, multi-generational living, or a creative renovation project. Whether you're looking to expand your investment portfolio or take on your next fixer-upper, this property offers flexibility and value. Conveniently located just minutes from the Appalachian College of Pharmacy. Bring your vision and turn this promising property into something special—opportunities like this don't come around often!
Key facts
- Two separate homes
- Over 2.25 acres
- Investment portfolio
Tags
Property features AI
Exterior
- Utilities: Public water; Public sewer
- Home design: Single family residence; One story
- Construction: Vinyl siding
- Exterior features: Shingle roof; Guest house on the property; Shed(s) on the property; Irregular, sloped lot
Interior
- Flooring: Laminate
- Bathrooms: 1 full bathroom; 1 half bathroom
- Interior features: Laminate flooring
Neighborhood map
What this means for you Summary
Snapshot
- This is a 2-bed/1.0-bath other listed at $50k.
Deal economics
- At list price, monthly cash flow is $303 ($4k/yr) — positive.
- The deal already cash-flows at list — no discount required.
- Meets the 1% rule at list price ($821 rent vs $50k).
- Recommended offer: $48k (3.0% below list) — sets the bar for market timing.
Location & tenants
- Location reads 54/100 on livability (#523 in VA) — a working-class tenant base; expect higher turnover. Strengths: cost of living A+, housing A+, crime A; Watch: amenities F, commute F, employment F.
- Buchanan County Public School District (rural): math 52% / reading 65% proficiency, ranked #76 of 131 in VA (top 58%) — acceptable for families but not a draw, mixed tenant base, ~2y average lease; 62% free/reduced lunch — lower-income household profile, screen leases tightly.
- Zoned schools: Riverview Elementary/Middle (math 49% / reading 60%, grade C, #650 of 1,108 statewide, top 62%, 750 students, 88% FRL); Grundy High (math 77% / reading 72%, grade B+, #107 of 319 statewide, top 37%, 355 students, 97% FRL) — zoned schools average 92% FRL vs 62% district-wide (30 pts higher); higher-poverty schools than district average — tighter screening recommended.
- Market conditions: 5 active listings in the ZIP; 12 units permitted in Buchanan County in 2024 (0 in 5+ unit buildings).
Forward outlook
- Local home prices are declining (-1.0%/yr); year-one equity from $346 of loan paydown is wiped out by about $480 of value loss. Plan a longer hold.
- Buchanan County population projected at -32% by 2050 — secular population decline; favor cash flow + early exit over multi-decade hold.
- At projected returns (-1.0% appreciation + 3.0% rent growth), your $14k cash investment doubles in ~4 years — after that, you're playing with house money.
Negotiation context
- It's been on market 58 days — a 3% lower offer ($48k) is reasonable based on typical stale-listing flexibility.
Risks & watch-outs
- Watch-outs: built in 1952 — expect roof / HVAC / electrical / plumbing capex.
Questions for the listing agent
- It's been on market 58 days. Have you received any prior offers? Is the seller open to a 3% concession, seller financing, or rate buy-down credit?
- Built in 1952 — when were the roof, HVAC, electrical panel, plumbing, and water heater last replaced?
- Is there a deadline driving the sale (1031 exchange, divorce, estate, relocation)? That informs how much negotiation room exists.
- Schools are F-rated, which usually means shorter tenancies and higher turnover. Who's the typical renter profile here, and what's been the actual vacancy rate?
- This sits on a lake — are riparian / water-frontage rights deeded with the parcel? Any dock permits, shoreline easements, or HOA water-use restrictions?
- What's the documented flood / surge / shoreline-erosion history here (FEMA AND non-FEMA — e.g., storm surge, creek backup, septic-field saturation)?
- Any water-quality or seasonal algae-bloom issues that affect tenant satisfaction or short-term-rental demand?
- What's the average days-on-market for RENTAL listings here right now (not sales)? A rising rental-DOM trend means longer vacancies and softer asking-rent achievability than the comps imply.
- What's the recent tenant-quality profile in this submarket — average credit score on applications, eviction rate, late-payment / NSF rate, and stable-employment percentage? A property-management company in the area should have these aggregated.
- How much new for-sale + rental construction is in the pipeline within 1–3 miles? Heavy new supply typically softens prices + rents 12–24 months out; constrained supply supports both.
Investment metrics
- 1% rule
- 1.64% ✓
- Cap rate
- 13.57%
- Cash-on-cash
- 25.99%
- DSCR
- 2.16
- GRM
- 5.1
CMA / ARV
- ARV (median comp)
- $88,125
- List price
- $50,000
- Delta
- -43.26%
- Verdict
- UNDERPRICED
- Comps
- 2 within 1.0 mi
Projected returns pro-forma
-0.96% appreciation · 3.0% rent growth · sell at horizon
- IRR
- 24.3%
- Equity multiple
- 2.12×
- Total profit
- $15,652
- Equity at exit
- $12,164
- IRR
- 29.4%
- Equity multiple
- 4.05×
- Total profit
- $42,717
- Equity at exit
- $12,854
Cash invested: $14,000 (down + closing). Projections, not guarantees.
Landlord ↔ Tenant lean methodology
- Overall (STATE)
- 55 Moderately Landlord-Leaning
- State Virginia
- 55 Moderately Landlord-Leaning · D+2
- County
- — inherits STATE
- City
- — inherits STATE
ZIP-level market 24631
- Home prices YoY
- -0.8%
- Active inventory
- 5
- Price-to-rent
- 5.1×
Monthly cashflow live
- Estimated rent
- $821 medium interval (Pro) →
- Mortgage (P&I)
- −$262
- Tax est. 1.5%
- −$62 /mo · $750/yr
- Insurance
- −$21
- HOA
- −$0
- Vacancy / Maint / Mgmt
- −$172
- Net cashflow
- $303
Break-even live
Sensitivity live
| Price | -10% $338 | -5% $321 | +0% $303 | +5% $286 | +10% $269 |
|---|---|---|---|---|---|
| Rent | -10% $238 | -5% $271 | +0% $303 | +5% $336 | +10% $368 |
| Rate | -1.0pp $328 | -0.5pp $316 | base $303 | +0.5pp $290 | +1.0pp $277 |
UW: 25.0% down · 7.5% · 30yr · 1.5% tax · 5.0% vac · 8.0% maint · 8.0% mgmt
Financing live
Cash to close
- Down payment
- $12,500
- Closing costs
- $1,500
- Reserves months
- —
- Total cash needed
- —
Loan-product check · same deal, 3 products live
Conventional
25% down · 7.5% · 30yr
- Down + closing
- —
- Monthly P&I
- —
- Monthly cashflow
- —
- DSCR
- —
- Eligible?
- —
Personal DTI + credit; lowest rate.
DSCR
20% down · 8.5% · 30yr
- Down + closing
- —
- Monthly P&I
- —
- Monthly cashflow
- —
- DSCR
- —
- Eligible?
- —
No personal income docs; deal must DSCR.
Hard money
10% down · 12.0% · 12mo
- Down + closing
- —
- Monthly P&I
- —
- Monthly cashflow
- —
- DSCR
- —
- Eligible?
- —
Short-term bridge; refi at stabilization.
Listing history 18 events
-
2026-06-21days on market $50,000 Active 58 DOM
-
2026-06-21days on market $50,000 Active 57 DOM
-
2026-06-18days on market $50,000 Active 55 DOM
-
2026-06-17days on market $50,000 Active 54 DOM
-
2026-06-16days on market $50,000 Active 53 DOM
-
2026-06-15days on market $50,000 Active 52 DOM
-
2026-06-15days on market $50,000 Active 51 DOM
-
2026-06-13days on market $50,000 Active 50 DOM
-
2026-06-12days on market $50,000 Active 49 DOM
-
2026-06-09days on market $50,000 Active 46 DOM
-
2026-06-08days on market $50,000 Active 45 DOM
-
2026-06-08days on market $50,000 Active 44 DOM
-
2026-06-07days on market $50,000 Active 43 DOM
-
2026-06-03days on market $50,000 Active 40 DOM
-
2026-06-02days on market $50,000 Active 39 DOM
-
2026-06-01days on market $50,000 Active 38 DOM
-
2026-05-31days on market $50,000 Active 37 DOM
-
2026-04-24$50,000 Active 665-char remark
ⓘ Source: listings_history table (triggers on properties + properties_extension) + one-shot
backfill from property_details.listing_events for pre-trigger history.
Nearby sold comps map
Loading sold comps map…
Walkable amenities ~0.75 mi
Loading nearby amenities…
Taxation est. · year 1
- Rental income
- $9,855
- − Mortgage interest
- −$2,801
- − Property taxes
- −$750
- − Insurance
- −$250
- − Repairs & maintenance
- −$788
- − Management
- −$788
- − Depreciation
- −$1,455
- Taxable income
- $3,023
- Est. tax owed @ 24.0%
- −$726
- After-tax cash flow
- $2,914/yr
For passive investors: Depreciation is non-cash, so a rental often shows a tax loss while cash-flowing — sheltering income. Rental losses are passive: they offset passive income freely, and up to $25,000/yr can offset ordinary (W-2) income if you actively participate and your MAGI is under $100k (phasing out to $0 by $150k); unused losses carry forward. On sale, claimed depreciation is recaptured at up to 25%, and gains may owe capital-gains tax (a 1031 exchange can defer both). Figures are a year-1 estimate at your 24.0% rate — not tax advice; consult a CPA.
Schools (NCES district)
- District
- Buchanan County Public School District
- NCES district ID
- 5100510
- Math proficiency
- 52% ▼ -27.00%
- Reading proficiency
- 65% ▼ -7.00%
- Median HH income
- $29,669
- Composite
- 47.84/100
- National rank
- #2221
- State rank
- #76 of 131 in VA
Livability — Vansant
- Score
- 54/100
- State rank
- #523
- US rank
- #24092
Category grades
Schools grade is shown separately in the Schools card above.
Census & demographics
- Population (ZIP)
- 2,076
Population outlook (Buchanan County) Hauer SSP2
- Today (2025)
- 20,160 people
- By 2030
- 18,734 · -7.1%
- By 2040
- 16,071 · -20.3%
- By 2050
- 13,815 · -31.5%
- By 2075
- 10,376 · -48.5%
- By 2100
- 8,432 · -58.2%
Race, ethnicity, and origin ACS 2023
- Neighborhood character
- Predominantly White (72%)
- Race & ethnicity
- White 72% Black 18% Hispanic / Latino 6% Two or more races 3% Asian 2%
- Hispanic origin (detail)
- Mexican 3% Puerto Rican 3%
- Foreign-born
- 0%
- Languages at home
- 97% English-only · Vietnamese 2% Spanish 1%
Political lean MEDSL · Buchanan
- 2024 margin
- Solid R (+70.6) · D 14.5% · R 85.1%
- 2008→2024 swing
- -65.1pp toward R · 2008: -5.5pp · 2024: -70.6pp
- All cycles
- 2024: R+70.6 2020: R+67.6 2016: R+60.4 2012: R+34.7 2008: R+5.5
Not yet ingested
- Civics
- —
Market trends
- HPI YoY
- ▼ -0.96%
- Current HPI
- 112.1359
- Rent YoY
- —
- Metro
- —
- State GDP YoY
- ▲ 2.40%
- F500 in state
- 50
Industry mix (Fortune 500 HQ in VA)
| Industry | F500 HQs | Revenue |
|---|---|---|
| Aerospace / Defense | 4 | $236B |
|
||
| Technology / Defense | 3 | $32B |
|
||
| Financial Services | 2 | $176B |
|
||
| Utilities | 2 | $27B |
|
||
| Insurance | 2 | $25B |
|
||
| Technology | 2 | $15B |
|
||
Price history
1 event — show timeline
- 2026-04-24 Listed $50,000 SWVAR
Property tax history
-1.6%/yrLatest (2025): $55 · +0.0% YoY. Source: county tax records.
Cash-flow waterfall
monthlySold comps — $/sqft
last 12 mo · ≤1 miLoading sold comps…