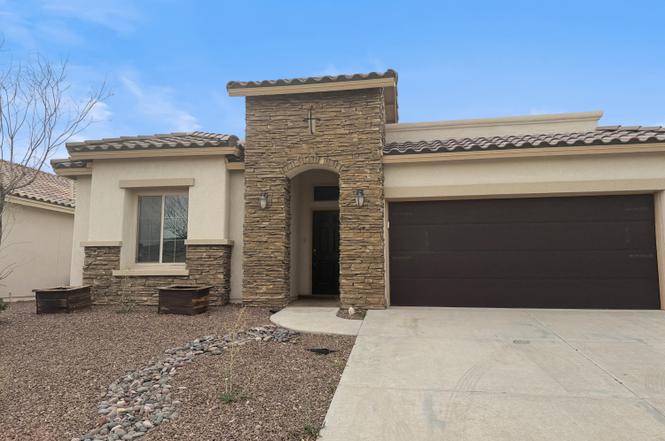
13421 Plumpton Rd · Horizon City, TX
Flood risk 1/10 · Minimal
- FEMA flood zone
- X
- Chance of flooding over 30 yrs
- 0.0%
- Est. flood insurance / yr
- $507 – $1,088
Fire risk 3/10 · Minor
- Est. fire insurance / yr
- $1,222 – $2,270
Heat risk 6/10 · Moderate
- Hot days now (above 101°F)
- 7 days/yr
- Hot days in 30 yrs
- 24 days/yr
Wind risk 1/10 · Minimal
- Chance of severe wind over 30 yrs
- —
Air-quality risk 3/10 · Minor
- Unhealthy air days now
- 2 days/yr
- Unhealthy air days in 30 yrs
- 2 days/yr
Risk factors via First Street. Map © Google.
Why this score? — see what drove the D- grade
The composite is a weighted blend of 9 inputs, each scored 0–100. Each bar is that input's sub-score; the figure is the points it added to the 100-point composite (weight × sub-score).
- Cash flow +9.4/30.0
- ARV discount +7.5/15.0
- 1% rule +5.1/10.0
- Livability +3.3/5.0
- Rent growth +3.2/5.0
- DSCR +2.6/10.0
- Schools +2.6/10.0
- Condition / age +2.5/5.0
- Appreciation +0.0/10.0
$234,890
🖨 Deal sheet 📄 Offer letter ✓ Due diligence
Listing remarks
This spacious 4-bedroom, 3-bathroom residence offers the quality construction and highly sought-after floor plan that buyers have come to appreciate. Featuring an open-concept layout with soaring ceilings, the home provides a bright and inviting atmosphere with excellent flow for everyday living and entertaining. The thoughtfully designed split-bedroom floor plan includes a private primary suite complete with a generously sized bathroom, separate soaking tub, and walk-in shower. With solid construction, great bones, and endless potential, this property presents an excellent opportunity for buyers looking to personalize a home and add their own style and updates over time. Conveniently desig
Key facts
- 5,509 sq ft lot
- 2 garage spots
- Built 2018
Property features AI
Exterior
- Parking: Parking details not provided
- Security: Security details not provided
- Utilities: Utility details not provided
- Home design: Single family residence
- Construction: Stucco exterior; Flat and tile roof
- Exterior features: Back yard access
Interior
- Kitchen: Appliances and other kitchen details available — see remarks
- Bedrooms: Master bedroom with zoning (exact room levels not specified)
- Flooring: Tile; Carpet
- Bathrooms: 3 full bathrooms
- Heating & cooling: Heating details: see remarks; Central cooling
- Interior features: Kitchen island; Walk-in closets; Zoned master bedroom
- Laundry & utility: Laundry and utility details not provided
Neighborhood map
What this means for you Summary
Snapshot
- This is a 4-bed/2.5-bath single-family listed at $235k.
Deal economics
- At list price, monthly cash flow is $-170 ($-2k/yr) — negative.
- To cash-flow at today's rent, offer at most $205k (12.8% below list).
- Meets the 1% rule at list price ($2k rent vs $235k).
- Recommended offer: $205k (12.8% below list) — sets the bar for cash-flow.
Location & tenants
- Location reads 66/100 on livability (#619 in TX) — a middle-class / working-renter tenant base. Strengths: crime A+, cost of living A+, housing A+; Watch: employment D, amenities F, commute F.
- Socorro ISD (urban): math 23% / reading 36% proficiency, ranked #624 of 826 in TX (top 76%) — low school quality limits family demand, transient renter base, plan for 1-2y turnover; 66% free/reduced lunch — lower-income household profile, screen leases tightly.
- Zoned schools: Dr Sue A Shook School (math 26% / reading 33%, grade F, #2,525 of 4,322 statewide, top 62%, 1,058 students, 68% FRL); Eastlake H S (math 28% / reading 47%, grade F, #888 of 1,632 statewide, top 55%, 2,851 students, 73% FRL) — zoned schools at 70% FRL track the district average.
- Market conditions: Rents rising (+2.9%/yr); 2088 active listings in the ZIP; 40 comparable units currently listed for rent nearby; rentals at typical pace (median 24d on market — plan ~3-4 weeks tenant-placement turnaround); 45% of comp listings sitting > 30 days — soft ceiling on asking rent; solid renter incomes; 2,196 units permitted in El Paso County in 2024 (143 in 5+ unit buildings).
- This rent runs 37% of the median local income ($77k/yr) — at the standard rent-burdened threshold; future hikes will face affordability resistance.
Forward outlook
- Local home prices are declining (-3.0%/yr); year-one equity from $2k of loan paydown is wiped out by about $7k of value loss. Plan a longer hold.
- El Paso County population projected at +10% by 2050 — modest demand growth; plan on rents tracking national, not racing it.
Negotiation context
- Only 1 days on market — expect competitive offers; lowballing is unlikely to land.
- 5 sale attempts since 6y ago with the ask held roughly flat each time — persistent listings suggest the price (not the market) is what's stuck; bring a comps-based counter.
Risks & watch-outs
- Watch-outs: property tax is 3.6% of price.
- Climate carrying-cost: extreme-heat days projected 7→24/yr by 2055 (HVAC capex compounding) — expect insurance premiums to compound above CPI over the hold.
Questions for the listing agent
- What do current leases actually rent for vs. the listed asking? Can we see a recent rent roll and the last 12 months of T-12 income?
- Property tax is high relative to price — has the assessment been appealed recently, and will the sale trigger a re-assessment?
- Is there a deadline driving the sale (1031 exchange, divorce, estate, relocation)? That informs how much negotiation room exists.
- Schools are D-rated, which usually means shorter tenancies and higher turnover. Who's the typical renter profile here, and what's been the actual vacancy rate?
- The area grade is low — what's the realistic commute time and amenity access for the typical tenant pool here? Any planned neighborhood developments (good or bad) we should know about?
- What's the average days-on-market for RENTAL listings here right now (not sales)? A rising rental-DOM trend means longer vacancies and softer asking-rent achievability than the comps imply.
- What's the recent tenant-quality profile in this submarket — average credit score on applications, eviction rate, late-payment / NSF rate, and stable-employment percentage? A property-management company in the area should have these aggregated.
- How much new for-sale + rental construction is in the pipeline within 1–3 miles? Heavy new supply typically softens prices + rents 12–24 months out; constrained supply supports both.
Investment metrics
- 1% rule
- 1.01% ✓
- Cap rate
- 5.43%
- Cash-on-cash
- -3.10%
- DSCR
- 0.86
- GRM
- 8.3
CMA / ARV
No comps found within radius.
Projected returns pro-forma
-3.0% appreciation · 2.93% rent growth · sell at horizon
- IRR
- -21.4%
- Equity multiple
- 0.26×
- Total profit
- $-48,743
- Equity at exit
- $35,023
- IRR
- -14.9%
- Equity multiple
- 0.15×
- Total profit
- $-55,858
- Equity at exit
- $20,309
Cash invested: $65,769 (down + closing). Projections, not guarantees.
Landlord ↔ Tenant lean methodology
- Overall (STATE)
- 87 Strongly Landlord-Friendly
- State Texas
- 87 Strongly Landlord-Friendly · R+5
- County
- — inherits STATE
- City
- — inherits STATE
ZIP-level market 79928
- Home prices YoY
- -16.9%
- Rents YoY
- 2.9%
- Active inventory
- 2088
- Price-to-rent
- 8.3×
Monthly cashflow live
- Estimated rent
- $2,365 high interval (Pro) →
- Mortgage (P&I)
- −$1,232
- Tax from tax record
- −$709 /mo · $8,505/yr
- Insurance
- −$98
- HOA
- −$0
- Vacancy / Maint / Mgmt
- −$497
- Net cashflow
- $-170
Break-even live
UW: 25.0% down · 7.5% · 30yr · 1.5% tax · 5.0% vac · 8.0% maint · 8.0% mgmt
Financing live
Cash to close
- Down payment
- $58,722
- Closing costs
- $7,047
- Reserves months
- —
- Total cash needed
- —
Loan-product check · same deal, 3 products live
Conventional
25% down · 7.5% · 30yr
- Down + closing
- —
- Monthly P&I
- —
- Monthly cashflow
- —
- DSCR
- —
- Eligible?
- —
Personal DTI + credit; lowest rate.
DSCR
20% down · 8.5% · 30yr
- Down + closing
- —
- Monthly P&I
- —
- Monthly cashflow
- —
- DSCR
- —
- Eligible?
- —
No personal income docs; deal must DSCR.
Hard money
10% down · 12.0% · 12mo
- Down + closing
- —
- Monthly P&I
- —
- Monthly cashflow
- —
- DSCR
- —
- Eligible?
- —
Short-term bridge; refi at stabilization.
Rent comps 40 comps
| Address | Beds | Baths | Sqft | Rent | $/sqft | DOM | Units | Dist |
|---|---|---|---|---|---|---|---|---|
| 844 Chillington Rd Horizon City, TX | 4.0 | 3.0 | 1954 | $2,850 | $1.46 | 14d | 1 | 0.20mi |
| 13401 Carterton Ave Horizon City, TX | 4.0 | 2.5 | 1987 | $2,450 | $1.23 | 43d | 1 | 0.27mi |
| 945 Penrith St El Paso, TX | 3.0 | 2.5 | 1819 | $1,950 | $1.07 | 14d | 1 | 0.28mi |
| 945 Penrith St El Paso, TX | 3.0 | 2.5 | 1937 | $1,950 | $1.01 | 43d | 1 | 0.28mi |
| 13389 Carterton Ave Horizon City, TX | 4.0 | 2.5 | 1970 | $2,645 | $1.34 | 2d | 1 | 0.28mi |
| 956 Clapham St El Paso, TX | 4.0 | 2.5 | 2288 | $2,050 | $0.90 | 14d | 1 | 0.28mi |
| 800 Caterick St El Paso, TX | 4.0 | 2.5 | 1876 | $2,085 | $1.11 | 10d | 1 | 0.31mi |
| 13470 Everingham St El Paso, TX | 4.0 | 2.0 | 1844 | $2,000 | $1.08 | 23d | 1 | 0.35mi |
| 13482 Bradford St Horizon City, TX | 4.0 | 2.5 | 2128 | $2,530 | $1.19 | 10d | 1 | 0.40mi |
| 13482 Bradford St Horizon City, TX | 4.0 | 2.5 | 2128 | $2,530 | $1.19 | 3d | 1 | 0.40mi |
| 781 Croxdale St Horizon City, TX | 4.0 | 2.0 | 1433 | $1,800 | $1.26 | 43d | 1 | 0.42mi |
| 13172 Willitoft Rd El Paso, TX | 4.0 | 2.0 | 1450 | $2,450 | $1.69 | 43d | 1 | 0.48mi |
| 13539 Doncaster St El Paso, TX | 3.0 | 2.0 | 1525 | $1,850 | $1.21 | 43d | 1 | 0.51mi |
| 13257 Coldham St Horizon City, TX | 4.0 | 2.5 | 2090 | $2,300 | $1.10 | 3d | 1 | 0.53mi |
| 13483 Halifax St Horizon City, TX | 3.0 | 2.5 | 2061 | $2,250 | $1.09 | 2d | 1 | 0.56mi |
| 13677 Holbeck St El Paso, TX | 4.0 | 2.0 | 1869 | $2,060 | $1.10 | 43d | 1 | 0.64mi |
| 13709 Paseo Sereno Dr El Paso, TX | 4.0 | 2.0 | 1757 | $1,800 | $1.02 | 23d | 1 | 0.70mi |
| 13113 Wellington Horizon City, TX | 3.0 | 2.0 | 1474 | $2,700 | $1.83 | 14d | 1 | 0.74mi |
| 454 Claiborne St Horizon City, TX | 3.0 | 2.0 | 2018 | $1,775 | $0.88 | 43d | 1 | 0.80mi |
| 452 Emerald Pass Ave Horizon City, TX | 4.0 | 2.5 | 2135 | $1,800 | $0.84 | 43d | 1 | 0.87mi |
| 13637 Chepstow Ct El Paso, TX | 5.0 | 4.0 | 2627 | $3,200 | $1.22 | 3d | 1 | 1.01mi |
| 12964 Runway Ave El Paso, TX | 3.0 | 3.0 | 1410 | $1,695 | $1.20 | 44d | 1 | 1.02mi |
| 12956 Runway Ave El Paso, TX | 4.0 | 2.0 | 1446 | $1,795 | $1.24 | 43d | 1 | 1.04mi |
| 12805 Kingsbury Ave El Paso, TX | 4.0 | 2.0 | 1755 | $2,250 | $1.28 | 3d | 1 | 1.04mi |
| 1130 Gaitan St El Paso, TX | 3.0 | 2.0 | 1960 | $2,200 | $1.12 | 23d | 1 | 1.09mi |
| 369 Emerald Acres Horizon City, TX | 4.0 | 3.0 | 2471 | $2,350 | $0.95 | 3d | 1 | 1.09mi |
| 13146 Cleethorpes St El Paso, TX | 3.0 | 2.5 | 2085 | $2,075 | $1.00 | 43d | 1 | 1.10mi |
| 392 Frodsham St El Paso, TX | 4.0 | 2.5 | 1801 | $2,075 | $1.15 | 43d | 1 | 1.11mi |
| 393 Frodsham St El Paso, TX | 4.0 | 2.0 | 1788 | $2,000 | $1.12 | 11d | 1 | 1.13mi |
| 12716 Middlesbrough Ave Horizon City, TX | 4.0 | 2.5 | 1825 | $2,595 | $1.42 | 11d | 1 | 1.15mi |
| 544 Cedarwood Ave El Paso, TX | 3.0 | 2.0 | 1523 | $1,795 | $1.18 | 43d | 1 | 1.17mi |
| 908 Felton Pl El Paso, TX | 4.0 | 3.5 | 2132 | $2,250 | $1.06 | 43d | 1 | 1.21mi |
| 19004 Bremerton Dr Horizon City, TX | 4.0 | 2.5 | 2442 | $2,300 | $0.94 | 3d | 1 | 1.22mi |
| 19004 Bremerton Dr Horizon City, TX | 4.0 | 3.0 | 2442 | $2,300 | $0.94 | 11d | 1 | 1.22mi |
| 13804 Summer Camp Ct El Paso, TX | 4.0 | 2.5 | 2665 | $3,300 | $1.24 | 43d | 1 | 1.24mi |
| 13122 Salterton Ave Unit NA El Paso, TX | 4.0 | 2.0 | 1550 | $1,850 | $1.19 | 43d | 1 | 1.24mi |
| 1028 Flyer Pl El Paso, TX | 5.0 | 3.0 | 2811 | $2,750 | $0.98 | 11d | 1 | 1.26mi |
| 828 Acton St Unit 1 Horizon City, TX | 4.0 | 3.0 | 2120 | $3,861 | $1.82 | 43d | 1 | 1.27mi |
| 1149 Stoke St El Paso, TX | 4.0 | 3.0 | 2146 | $2,500 | $1.16 | 43d | 1 | 1.27mi |
| 13131 Oakhampton Ave El Paso, TX | 3.0 | 2.0 | 1512 | $2,000 | $1.32 | 23d | 1 | 1.30mi |
Listing history 2 events
-
2026-06-18remarks 699-char remark
-
2026-06-18$234,890 Active 1 DOM
ⓘ Source: listings_history table (triggers on properties + properties_extension) + one-shot
backfill from property_details.listing_events for pre-trigger history.
Tax reassessment forecast TX · Resets to sale price
- Current annual tax
- $8,505 · $709/mo
- Projected year-2 tax
- $8,505 · $709/mo
- Expected delta
- $0/yr ($0/mo · 0.0%)
ⓘ Screening estimate from a state-policy table — verify with the county assessor before closing.
Climate risk First Street
- Flood 1/10 Low FEMA zone X · 0% chance over 30 yrs
- Wildfire 3/10 Moderate
- Heat 6/10 Major 7 d/yr ≥101°F today · 24 d/yr by 30 yrs out
- Wind 1/10 Low
- Air quality 3/10 Moderate 2 unhealthy d/yr today · 2 by 30 yrs out
Nearby sold comps map
Loading sold comps map…
Walkable amenities ~0.75 mi
Loading nearby amenities…
Taxation est. · year 1
- Rental income
- $28,386
- − Mortgage interest
- −$13,157
- − Property taxes
- −$8,505
- − Insurance
- −$1,174
- − Repairs & maintenance
- −$2,271
- − Management
- −$2,271
- − Depreciation
- −$6,833
- Taxable loss
- −$5,826
- Est. tax savings @ 24.0%
- +$1,398
- After-tax cash flow
- $-638/yr
For passive investors: Depreciation is non-cash, so a rental often shows a tax loss while cash-flowing — sheltering income. Rental losses are passive: they offset passive income freely, and up to $25,000/yr can offset ordinary (W-2) income if you actively participate and your MAGI is under $100k (phasing out to $0 by $150k); unused losses carry forward. On sale, claimed depreciation is recaptured at up to 25%, and gains may owe capital-gains tax (a 1031 exchange can defer both). Figures are a year-1 estimate at your 24.0% rate — not tax advice; consult a CPA.
Schools (NCES district)
- District
- Socorro ISD
- NCES district ID
- 4840710
- Math proficiency
- 23% ▼ -34.00%
- Reading proficiency
- 36% ▼ -14.00%
- Median HH income
- $49,318
- Composite
- 25.67/100
- National rank
- #7396
- State rank
- #624 of 826 in TX
Livability — Horizon City
- Score
- 66/100
- State rank
- #619
- US rank
- #11815
Category grades
Schools grade is shown separately in the Schools card above.
Census & demographics
- County
- El Paso County · 761,266 people
- City population
- 86,599
- Metro
- El Paso, TX
- Population (ZIP)
- 86,599
- Household income
- $76,643
- Rent vs Own
- Severe rent burden
- 838.0
Population outlook (El Paso County) Hauer SSP2
- Today (2025)
- 897,899 people
- By 2030
- 922,694 · +2.8%
- By 2040
- 960,492 · +7.0%
- By 2050
- 982,919 · +9.5%
- By 2075
- 997,266 · +11.1%
- By 2100
- 900,630 · +0.3%
Race, ethnicity, and origin ACS 2023
- Neighborhood character
- Predominantly Hispanic (89%)
- Race & ethnicity
- Hispanic / Latino 89% Two or more races 39% White 7% Black 2% Native American 2%
- Hispanic origin (detail)
- Mexican 84%
- Foreign-born
- 23% · Canada
- Languages at home
- 25% English-only · Spanish 74% Other Asian/Pacific 1%
Political lean MEDSL · El Paso
- 2024 margin
- D (+15.1) · D 57.0% · R 41.8% · Other 1.2%
- 2008→2024 swing
- -17.4pp toward R · 2008: 32.5pp · 2024: 15.1pp
- All cycles
- 2024: D+15.1 2020: D+35.1 2016: D+43.2 2012: D+32.6 2008: D+32.5
Not yet ingested
- Civics
- —
Market trends
- HPI YoY
- ▼ -40.72%
- Current HPI
- 200.6454
- Rent YoY
- ▲ 2.93%
- Metro
- El Paso, TX
- State GDP YoY
- ▲ 3.95%
- F500 in state
- 110
Industry mix (Fortune 500 HQ in TX)
| Industry | F500 HQs | Revenue |
|---|---|---|
| Energy | 16 | $1,198B |
|
||
| Technology | 5 | $198B |
|
||
| Engineering / Construction | 4 | $72B |
|
||
| Energy Services | 3 | $60B |
|
||
| Utilities | 3 | $41B |
|
||
| Healthcare | 2 | $330B |
|
||
Price history
-14.6% since first listed14 events — show timeline
- 2026-06-17 Listed $234,890 GEPARMLS
- 2025-07-22 Listing Removed — GEPARMLS
- 2025-07-17 Listed $249,000 GEPARMLS
- 2024-11-11 Rental Removed $2,350 GEPARMLS
- 2024-11-05 Sold (Public Records) — Public Records
- 2024-10-12 Listed for Rent $2,350 GEPARMLS
- 2024-10-10 Listing Removed — GEPARMLS
- 2024-08-28 Price Changed $312,500 GEPARMLS
- 2024-08-16 Price Changed $322,500 GEPARMLS
- 2024-07-16 Price Changed $325,000 GEPARMLS
- 2024-07-01 Listed $330,000 GEPARMLS
- 2020-08-11 Sold (Public Records) $260,000 Public Records
- 2020-07-12 Listing Removed — GEPARMLS
- 2020-06-16 Listed $275,000 GEPARMLS
Property tax history
+42.1%/yrLatest (2025): $8,505 · -0.1% YoY. Source: county tax records.
Cash-flow waterfall
monthlySold comps — $/sqft
last 12 mo · ≤1 miLoading sold comps…