 8-Plex
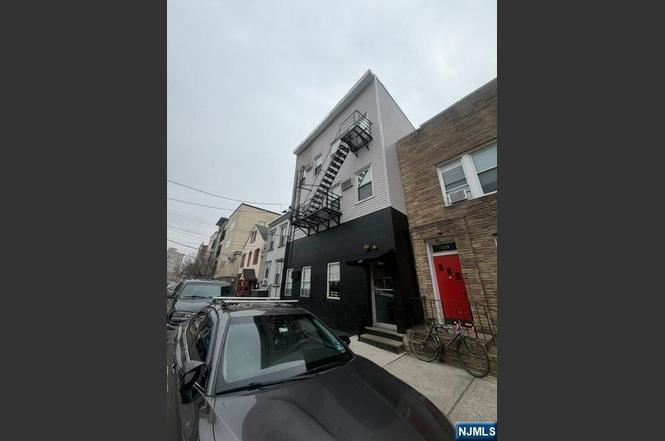
137 70th St · Guttenberg, NJ
Flood risk 5/10 · Moderate
- FEMA flood zone
- X (unshaded)
- Chance of flooding over 30 yrs
- 0.51%
- Est. flood insurance / yr
- $507 – $1,088
Fire risk 1/10 · Minimal
- Est. fire insurance / yr
- $526 – $976
Heat risk 7/10 · Major
- Hot days now (above 99°F)
- 7 days/yr
- Hot days in 30 yrs
- 15 days/yr
Wind risk 6/10 · Moderate
- Chance of severe wind over 30 yrs
- 27.0%
Air-quality risk 4/10 · Minor
- Unhealthy air days now
- 5 days/yr
- Unhealthy air days in 30 yrs
- 6 days/yr
Risk factors via First Street. Map © Google.
Why this score? — see what drove the C grade
The composite is a weighted blend of 9 inputs, each scored 0–100. Each bar is that input's sub-score; the figure is the points it added to the 100-point composite (weight × sub-score).
- Cash flow +25.4/30.0
- DSCR +8.4/10.0
- ARV discount +7.5/15.0
- 1% rule +6.3/10.0
- Livability +4.1/5.0
- Rent growth +3.2/5.0
- Condition / age +2.5/5.0
- Schools +1.7/10.0
- Appreciation +0.0/10.0
$1,695,000
🖨 Deal sheet (PDF) 📄 Offer letter ✓ Due diligence
Multi-family units
County records classify this as Multi-Family (5+ Unit). Listing-text estimate: 8 units. confirmed
5+ unit building — per-unit beds/baths from public records are typically unavailable; the breakdown below (if shown) is an estimate from the listing text.
Listing remarks
Well maintained 8 Family building Family owned since 2007 Quiet Building Close to all forms of transportation Plenty of shops with-in walking distance for tenants immediate needs Nice quiet Neighborhood Solid Investment Low turnover vacancy Call for additional Information City View Brokers 201-687-7711 Pedro Padron Broker
Key facts
- City view
- Plenty of shops
- Listed 107 days
Tags
Property features AI
Exterior
- Home design: Residential income, mixed-use property
- Construction: Flat roof construction
- Exterior features: Flat roof
Interior
- Interior features: Mixed-use residential income property
Neighborhood map
What this means for you Summary
Snapshot
- This is a 8 × 2-bed/1.5-bath units multifamily listed at $1.70M.
Deal economics
- At list price, monthly cash flow is $4k ($47k/yr) — positive. Per door: $485/mo.
- The deal already cash-flows at list — no discount required.
- Meets the 1% rule at list price ($19k rent vs $1.70M).
- Recommended offer: $1.54M (9.0% below list) — sets the bar for market timing.
- Cap rate 9.0% vs local median 2.3% in Guttenberg — top-decile yield for the area; either an underpriced asset or a hidden risk that comps aren't pricing in. Stress-test before assuming the spread holds.
Location & tenants
- Location reads 82/100 on livability (#51 in NJ, #1,253 nationally) — a professional / high-income tenant draw. Strengths: amenities A+, commute A+, health & safety A; Watch: schools C-, cost of living F.
- Guttenberg School District (suburban): math 10% / reading 28% proficiency, ranked #435 of 472 in NJ (top 92%) — low school quality limits family demand, transient renter base, plan for 1-2y turnover; 70% free/reduced lunch — lower-income household profile, screen leases tightly.
- Market conditions: Rents rising (+2.7%/yr); 265 active listings in the ZIP; 40 comparable units currently listed for rent nearby; rentals at typical pace (median 24d on market — plan ~3-4 weeks tenant-placement turnaround); 5,310 units permitted in Hudson County in 2024 (4,154 in 5+ unit buildings).
- At $19,148/mo this rent would consume 314% of the median local household income ($73k/yr) (locally 5546% of renters already pay >50% of income on rent) — very limited rent-growth headroom before tenants either downsize or default.
Forward outlook
- Local home prices are declining (-3.0%/yr); year-one equity from $12k of loan paydown is wiped out by about $51k of value loss. Plan a longer hold.
- Hudson County population projected at +29% by 2050 — long-run rental-demand tailwind backs the buy-and-hold thesis.
Negotiation context
- It's been on market 108 days — a 9% lower offer ($1.54M) is reasonable based on typical stale-listing flexibility.
Risks & watch-outs
- Watch-outs: built in 1900 — expect roof / HVAC / electrical / plumbing capex.
- Climate carrying-cost: moderate flood risk; major wind risk, 27% chance of damaging wind over 30y; extreme-heat days projected 7→15/yr by 2055 (HVAC capex compounding) — expect insurance premiums to compound above CPI over the hold.
Questions for the listing agent
- It's been on market 108 days. Have you received any prior offers? Is the seller open to a 9% concession, seller financing, or rate buy-down credit?
- Can we see the unit-by-unit rent roll, current vacancy, and any below-market leases? What's the average tenancy length?
- What capital expenditures (roof, boiler, parking lot, exteriors) have been made in the last 5 years, and what's planned in the next 2?
- Built in 1900 — when were the roof, HVAC, electrical panel, plumbing, and water heater last replaced?
- Why hasn't it sold? Are there any deal-killer items the seller is aware of (foundation, flood, title, zoning, code violations)?
- Is there a deadline driving the sale (1031 exchange, divorce, estate, relocation)? That informs how much negotiation room exists.
- What's the average days-on-market for RENTAL listings here right now (not sales)? A rising rental-DOM trend means longer vacancies and softer asking-rent achievability than the comps imply.
- What's the recent tenant-quality profile in this submarket — average credit score on applications, eviction rate, late-payment / NSF rate, and stable-employment percentage? A property-management company in the area should have these aggregated.
- How much new apartment / multifamily construction is in the pipeline within 1–3 miles? Heavy new supply (>2% of stock underway) typically softens rents 12–24 months out; light construction supports rent growth.
Investment metrics
- 1% rule
- 1.13% ✓
- Cap rate
- 9.04%
- Cash-on-cash
- 9.81%
- DSCR
- 1.44
- GRM
- 7.4
CMA / ARV
No comps found within radius.
Show comp detail 12 sales within ~0.75 mi
| Address | Dist | Beds/Ba | Sqft | Sold | Price | $/sf | Match |
|---|---|---|---|---|---|---|---|
| 55 71ST St | 0.20mi | 8/5.0 | — | 2mo | $1,375,000 | — | 76 |
| 143 64TH St | 0.29mi | 10/4.0 | — | 4mo | $960,000 | — | 70 |
| 6314 Broadway | 0.29mi | 10/4.0 | — | 4mo | $860,800 | — | 70 |
| 421 73RD St | 0.34mi | 6/2.0 | — | 2mo | $900,000 | — | 70 |
| 7722 BROADWAY | 0.38mi | 5/3.0 | — | 1mo | $1,260,000 | — | 69 |
| 6107A PALISADE Ave | 0.49mi | 5/3.0 | — | 1mo | $801,000 | — | 64 |
| 6107 Palisade Ave | 0.50mi | 5/3.0 | — | 1mo | $801,000 | — | 64 |
| 6034 Park Ave | 0.50mi | —/— | — | 2mo | $815,000 | — | 62 |
| 7405 2ND Ave | 0.53mi | 3/2.0 | — | 1mo | $675,000 | — | 62 |
| 7204 ADAMS St | 0.57mi | 5/2.0 | — | 0mo | $650,000 | — | 61 |
| 7517 1St Ave | 0.53mi | —/— | — | 3mo | $670,000 | — | 61 |
| 6910 JACKSON St | 0.51mi | 9/3.0 | — | 4mo | $772,000 | — | 60 |
Match score weights: distance 35% · size 25% · config 20% · recency 20%. Top-matched comps best support the ARV.
Projected returns pro-forma
-3.0% appreciation · 2.71% rent growth · sell at horizon
- IRR
- -1.8%
- Equity multiple
- 0.93×
- Total profit
- $-33,065
- Equity at exit
- $252,730
- IRR
- 7.5%
- Equity multiple
- 1.56×
- Total profit
- $266,754
- Equity at exit
- $146,553
Cash invested: $474,600 (down + closing). Projections, not guarantees.
Landlord ↔ Tenant lean methodology
- Overall (STATE)
- 21 Tenant-Leaning
- State New Jersey
- 21 Tenant-Leaning · D+6
- County
- — inherits STATE
- City
- — inherits STATE
ZIP-level market 07093
- Home prices YoY
- -7.6%
- Rents YoY
- 2.7%
- Active inventory
- 265
- Price-to-rent
- 59.0×
Monthly cashflow live
- Estimated rent
- $19,148 high interval (Pro) →
- Mortgage (P&I)
- −$8,889
- Tax from tax record
- −$1,651 /mo · $19,814/yr
- Insurance
- −$706
- HOA
- −$0
- Vacancy / Maint / Mgmt
- −$4,021
- Net cashflow
- $3,881
Break-even live
Sensitivity live
| Price | -10% $4,840 | -5% $4,361 | +0% $3,881 | +5% $3,401 | +10% $2,921 |
|---|---|---|---|---|---|
| Rent | -10% $2,368 | -5% $3,124 | +0% $3,881 | +5% $4,637 | +10% $5,393 |
| Rate | -1.0pp $4,734 | -0.5pp $4,312 | base $3,881 | +0.5pp $3,442 | +1.0pp $2,995 |
8-unit breakdown (identical units grouped — click to expand)
| Units | Beds | Baths | Est. rent |
|---|---|---|---|
| 8× units | 2 | 1.5 | $19,152 |
| #1 | 2 | 1.5 | $2,394 |
| #2 | 2 | 1.5 | $2,394 |
| #3 | 2 | 1.5 | $2,394 |
| #4 | 2 | 1.5 | $2,394 |
| #5 | 2 | 1.5 | $2,394 |
| #6 | 2 | 1.5 | $2,394 |
| #7 | 2 | 1.5 | $2,394 |
| #8 | 2 | 1.5 | $2,394 |
| Total (8 units) | $19,148 | ||
UW: 25.0% down · 7.5% · 30yr · 1.5% tax · 5.0% vac · 8.0% maint · 8.0% mgmt
Financing live
Cash to close
- Down payment
- $423,750
- Closing costs
- $50,850
- Reserves months
- —
- Total cash needed
- —
Loan-product check · same deal, 3 products live
Conventional
25% down · 7.5% · 30yr
- Down + closing
- —
- Monthly P&I
- —
- Monthly cashflow
- —
- DSCR
- —
- Eligible?
- —
Personal DTI + credit; lowest rate.
DSCR
20% down · 8.5% · 30yr
- Down + closing
- —
- Monthly P&I
- —
- Monthly cashflow
- —
- DSCR
- —
- Eligible?
- —
No personal income docs; deal must DSCR.
Hard money
10% down · 12.0% · 12mo
- Down + closing
- —
- Monthly P&I
- —
- Monthly cashflow
- —
- DSCR
- —
- Eligible?
- —
Short-term bridge; refi at stabilization.
Rent comps 40 comps
| Address | Beds | Baths | Sqft | Rent | $/sqft | DOM | Units | Dist |
|---|---|---|---|---|---|---|---|---|
| 139 70th St Unit 3 Guttenberg, NJ | 1.0 | 1.0 | 525 | $1,775 | $3.38 | 16d | 1 | 0.01mi |
| 148 70th St Unit 401 Guttenberg, NJ | 2.0 | 2.0 | 1100 | $3,250 | $2.95 | 26d | 1 | 0.04mi |
| 148 70th St Unit 401 Guttenberg, NJ | 2.0 | 2.0 | 1100 | $3,250 | $2.95 | 19d | 1 | 0.04mi |
| 148 70th St Unit 303 Guttenberg, NJ | 1.0 | 1.0 | 753 | $2,400 | $3.19 | 19d | 1 | 0.05mi |
| 148 70th St Unit 303 Guttenberg, NJ | 1.0 | 1.0 | 753 | $2,400 | $3.19 | 26d | 1 | 0.05mi |
| 140 71st St Guttenberg, NJ | 1.0 | 1.0 | — | $1,795 | — | 6d | 1 | 0.08mi |
| 140 71st St Unit 8 Guttenberg, NJ | 3.0 | 2.0 | 1100 | $2,750 | $2.50 | 19d | 1 | 0.08mi |
| 140 71st St Unit 5 Guttenberg, NJ | 1.0 | 1.0 | 500 | $1,800 | $3.60 | 8d | 1 | 0.08mi |
| 140 71st St Guttenberg, NJ | 3.0 | 1.5 | — | $2,750 | — | 8d | 1 | 0.08mi |
| 134 71st St Unit GR Guttenberg, NJ | 1.0 | 1.0 | 1000 | $1,750 | $1.75 | 26d | 1 | 0.09mi |
| 212 70th St Unit 203 Guttenberg, NJ | 1.0 | 1.0 | — | $2,400 | — | 23d | 1 | 0.09mi |
| 110 68th St Apt 2E Guttenberg, NJ | 1.0 | 1.0 | 700 | $1,800 | $2.57 | 26d | 1 | 0.09mi |
| 116 71st St #14 Guttenberg, NJ | 2.0 | 1.0 | 700 | $2,500 | $3.57 | 8d | 1 | 0.10mi |
| 7007 Park Ave Unit 2nd Floor Guttenberg, NJ | 2.0 | 1.0 | — | $2,100 | — | 14d | 1 | 0.10mi |
| 226 70th St #1 Guttenberg, NJ | 1.0 | 1.0 | — | $1,750 | — | 26d | 1 | 0.12mi |
| 78 69th St Unit 1A Guttenberg, NJ | 1.0 | 1.0 | — | $1,950 | — | 20d | 1 | 0.13mi |
| 78 69th St Unit 9A Guttenberg, NJ | 1.0 | 1.0 | 500 | $1,800 | $3.60 | 6d | 1 | 0.13mi |
| 74 69th St Unit 3B Guttenberg, NJ | 1.0 | 1.0 | 535 | $2,050 | $3.83 | 26d | 1 | 0.13mi |
| 110 67th St Unit 2nd floor West New York, NJ | 3.0 | 1.5 | — | $3,000 | — | 23d | 1 | 0.13mi |
| 230 68th St #3 Guttenberg, NJ | 1.0 | 1.0 | — | $1,850 | — | 26d | 1 | 0.14mi |
| 141 67th St Unit 1 West New York, NJ | 2.0 | 1.0 | — | $1,800 | — | 22d | 1 | 0.14mi |
| 6710 Park Ave #205 Guttenberg, NJ | 1.0 | 1.0 | 700 | $2,550 | $3.64 | 26d | 1 | 0.15mi |
| 6710 Park Ave #203 Guttenberg, NJ | 1.0 | 1.0 | 700 | $2,500 | $3.57 | 26d | 1 | 0.15mi |
| 70 69th St #4 Guttenberg, NJ | 1.0 | 1.0 | — | $2,250 | — | 26d | 1 | 0.15mi |
| 62 69th St Guttenberg, NJ | 1.0 | 1.0 | 829 | $2,495 | $3.01 | 19d | 1 | 0.15mi |
| 80 71st St #2 Guttenberg, NJ | 1.0 | 1.0 | — | $2,200 | — | 26d | 1 | 0.15mi |
| 109 67th St Unit 13 West New York, NJ | 1.0 | 1.0 | — | $1,800 | — | 23d | 1 | 0.15mi |
| 109 67th St Apt B1 West New York, NJ | 2.0 | 1.0 | — | $1,800 | — | 26d | 1 | 0.15mi |
| 64 70th St #2 Guttenberg, NJ | 3.0 | 2.0 | 1450 | $2,900 | $2.00 | 0d | 1 | 0.17mi |
| 67 71st St Unit 2 Guttenberg, NJ | 3.0 | 2.0 | — | $3,600 | — | 8d | 1 | 0.17mi |
| 124 73rd St Unit 3 North Bergen, NJ | 2.0 | 1.0 | — | $2,200 | — | 26d | 1 | 0.18mi |
| 310 70th St Guttenberg, NJ | 1.0 | 1.0 | 600 | $1,850 | $3.08 | 26d | 1 | 0.19mi |
| 307 71st St Guttenberg, NJ | 3.0 | 1.0 | — | $3,200 | — | 26d | 1 | 0.19mi |
| 60 68th St Unit 505 Guttenberg, NJ | 1.0 | 1.0 | 670 | $2,550 | $3.81 | 14d | 1 | 0.19mi |
| 60 68th St Unit 406 Guttenberg, NJ | 1.0 | 1.0 | 700 | $2,600 | $3.71 | 14d | 1 | 0.19mi |
| 56 68th St #7 Guttenberg, NJ | 1.0 | 1.0 | — | $2,200 | — | 26d | 1 | 0.19mi |
| 6816 Bellevue Ave Unit 3A Guttenberg, NJ | 3.0 | 1.0 | — | $3,300 | — | 7d | 1 | 0.21mi |
| 320 67th St Unit 2 West New York, NJ | 2.0 | 1.0 | 600 | $2,400 | $4.00 | 26d | 1 | 0.22mi |
| 6515 Hudson Ave Unit 3 West New York, NJ | 2.0 | 1.0 | 1000 | $2,800 | $2.80 | 5d | 1 | 0.23mi |
| 332 70th St Unit 2 Guttenberg, NJ | 2.0 | 1.0 | — | $2,200 | — | 26d | 1 | 0.24mi |
Listing history 17 events
-
2026-06-21days on market $1,695,000 Active 108 DOM
-
2026-06-18days on market $1,695,000 Active 105 DOM
-
2026-06-17days on market $1,695,000 Active 104 DOM
-
2026-06-16days on market $1,695,000 Active 103 DOM
-
2026-06-15days on market $1,695,000 Active 102 DOM
-
2026-06-13days on market $1,695,000 Active 100 DOM
-
2026-06-13days on market $1,695,000 Active 99 DOM
-
2026-06-09days on market $1,695,000 Active 96 DOM
-
2026-06-08days on market $1,695,000 Active 95 DOM
-
2026-06-07days on market $1,695,000 Active 94 DOM
-
2026-06-04days on market $1,695,000 Active 91 DOM
-
2026-06-03days on market $1,695,000 Active 90 DOM
-
2026-06-02days on market $1,695,000 Active 89 DOM
-
2026-06-01days on market $1,695,000 Active 88 DOM
-
2026-05-31days on market $1,695,000 Active 87 DOM
-
2026-04-23price $1,695,000
-
2026-03-05$1,850,000 Active
ⓘ Source: listings_history table (triggers on properties + properties_extension) + one-shot
backfill from property_details.listing_events for pre-trigger history.
Tax reassessment forecast NJ · Partial reset (capped growth)
- Current annual tax
- $19,814 · $1,651/mo
- Projected year-2 tax
- $31,010 · $2,584/mo
- Expected delta
- +$11,196/yr (+$933/mo · 56.5%)
ⓘ Screening estimate from a state-policy table — verify with the county assessor before closing.
Climate risk First Street
- Flood 5/10 Major FEMA zone X (unshaded) · 51% chance over 30 yrs
- Wildfire 1/10 Low
- Heat 7/10 Severe 7 d/yr ≥99°F today · 15 d/yr by 30 yrs out
- Wind 6/10 Major 27% chance of damaging wind over 30 yrs
- Air quality 4/10 Moderate 5 unhealthy d/yr today · 6 by 30 yrs out
Nearby sold comps map
Loading sold comps map…
Walkable amenities ~0.75 mi
Loading nearby amenities…
Taxation est. · year 1
- Rental income
- $229,776
- − Mortgage interest
- −$94,946
- − Property taxes
- −$19,814
- − Insurance
- −$8,475
- − Repairs & maintenance
- −$18,382
- − Management
- −$18,382
- − Depreciation
- −$49,309
- Taxable income
- $20,468
- Est. tax owed @ 24.0%
- −$4,912
- After-tax cash flow
- $41,657/yr
For passive investors: Depreciation is non-cash, so a rental often shows a tax loss while cash-flowing — sheltering income. Rental losses are passive: they offset passive income freely, and up to $25,000/yr can offset ordinary (W-2) income if you actively participate and your MAGI is under $100k (phasing out to $0 by $150k); unused losses carry forward. On sale, claimed depreciation is recaptured at up to 25%, and gains may owe capital-gains tax (a 1031 exchange can defer both). Figures are a year-1 estimate at your 24.0% rate — not tax advice; consult a CPA.
Schools (NCES district)
- District
- Guttenberg School District
- NCES district ID
- 3406240
- Math proficiency
- 10% ▼ -28.00%
- Reading proficiency
- 28% ▼ -25.00%
- Median HH income
- $53,491
- Composite
- 17.35/100
- National rank
- #9079
- State rank
- #435 of 472 in NJ
Livability — Guttenberg
- Score
- 82/100
- State rank
- #51
- US rank
- #1253
Category grades
Schools grade is shown separately in the Schools card above.
Census & demographics
- Census place
- Guttenberg, NJ
- County
- Hudson County · 718,323 people
- Metro
- New York-Newark-Jersey City, NY-NJ-PA
- Population (ZIP)
- 63,758
- Household income
- $73,174
- Rent vs Own
- Severe rent burden
- 5546.0
Population outlook (Hudson County) Hauer SSP2
- Today (2025)
- 771,834 people
- By 2030
- 818,028 · +6.0%
- By 2040
- 907,866 · +17.6%
- By 2050
- 994,480 · +28.8%
- By 2075
- 1,163,301 · +50.7%
- By 2100
- 1,254,703 · +62.6%
Race, ethnicity, and origin ACS 2023
- Neighborhood character
- Predominantly Hispanic (75%)
- Race & ethnicity
- Hispanic / Latino 75% Two or more races 27% White 15% Asian 7% Black 2% Native American 2%
- Hispanic origin (detail)
- Mexican 6% Puerto Rican 4% Cuban 12% Dominican 15%
- Common ancestry
- Romanian 1% Scotch-Irish 1% Lithuanian 1%
- Foreign-born
- 58% · Canada, Jamaica, China
- Languages at home
- 22% English-only · Spanish 67% Other Indo-European 2% Chinese 2%
Political lean MEDSL · Hudson
- 2024 margin
- Strong D (+28.1) · D 62.6% · R 34.6% · Other 2.8%
- 2008→2024 swing
- -18.7pp toward R · 2008: 46.7pp · 2024: 28.1pp
- All cycles
- 2024: D+28.1 2020: D+46.2 2016: D+51.8 2012: D+55.7 2008: D+46.7
Not yet ingested
- Civics
- —
Market trends
- HPI YoY
- ▼ -29.80%
- Current HPI
- 364.4128
- Rent YoY
- ▲ 2.71%
- Metro
- New York-Newark-Jersey City, NY-NJ-PA
- State GDP YoY
- ▲ 2.05%
- F500 in state
- 34
Industry mix (Fortune 500 HQ in NJ)
| Industry | F500 HQs | Revenue |
|---|---|---|
| Consumer Goods | 3 | $31B |
|
||
| Pharmaceuticals | 2 | $153B |
|
||
| Technology | 2 | $21B |
|
||
| Insurance | 2 | $20B |
|
||
| Healthcare | 2 | $19B |
|
||
| Financial Services | 1 | $70B |
|
||
Price history
-8.4% since first listed2 events — show timeline
- 2026-04-23 Price Changed $1,695,000 NJMLS
- 2026-03-05 Listed $1,850,000 NJMLS
Property tax history
+0.9%/yrLatest (2025): $19,814 · +1.3% YoY. Source: county tax records.
Cash-flow waterfall
monthlySold comps — $/sqft
last 12 mo · ≤1 miLoading sold comps…