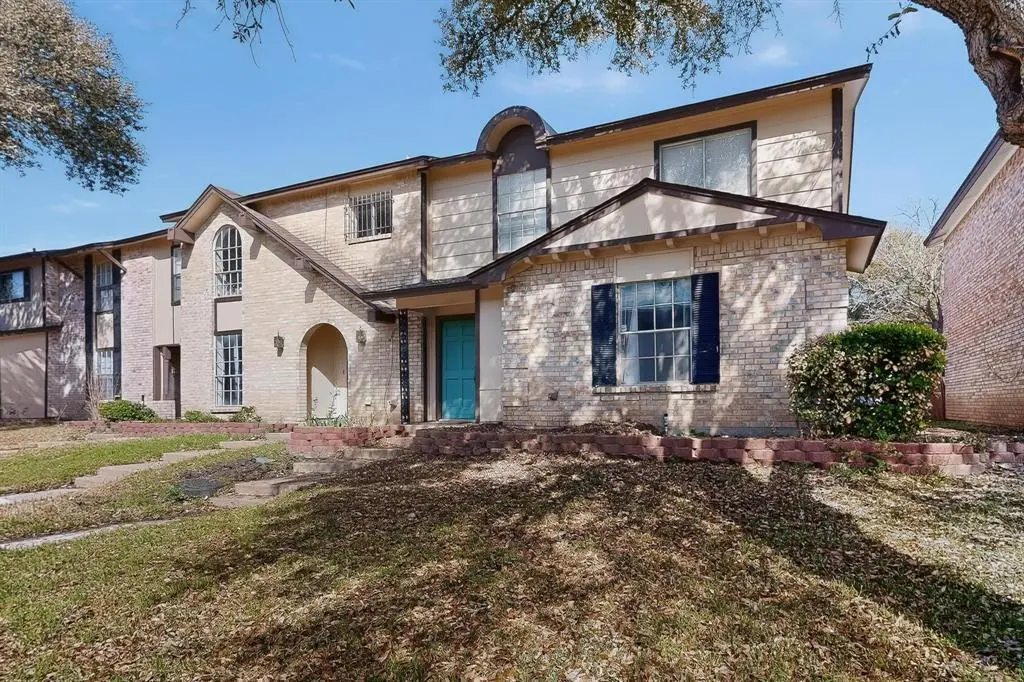
2308 Long Rdg · Arlington, TX
Flood risk 1/10 · Minimal
- FEMA flood zone
- X (unshaded)
- Chance of flooding over 30 yrs
- 0.0%
- Est. flood insurance / yr
- $507 – $1,088
Fire risk 1/10 · Minimal
- Est. fire insurance / yr
- $1,222 – $2,270
Heat risk 7/10 · Major
- Hot days now (above 109°F)
- 7 days/yr
- Hot days in 30 yrs
- 22 days/yr
Wind risk 6/10 · Moderate
- Chance of severe wind over 30 yrs
- 27.0%
Air-quality risk 3/10 · Minor
- Unhealthy air days now
- 2 days/yr
- Unhealthy air days in 30 yrs
- 4 days/yr
Risk factors via First Street. Map © Google.
Why this score? — see what drove the D grade
The composite is a weighted blend of 9 inputs, each scored 0–100. Each bar is that input's sub-score; the figure is the points it added to the 100-point composite (weight × sub-score).
- ARV discount +15.0/15.0
- Cash flow +7.8/30.0
- 1% rule +4.1/10.0
- Livability +3.9/5.0
- Rent growth +3.5/5.0
- Schools +2.5/10.0
- Condition / age +2.5/5.0
- DSCR +1.9/10.0
- Appreciation +0.0/10.0
$205,000
🖨 Deal sheet 📄 Offer letter ✓ Due diligence
Listing remarks MLS
Located in a prime Arlington location, this property offers an excellent opportunity for both homeowners and investors. Conveniently situated near major highways, shopping, dining, and just minutes from AT&T Stadium, this home is in an area with strong demand and great accessibility. Currently operating as a successful Airbnb, the property stays consistently booked, making it an ideal income-producing opportunity.
Key facts
- Near dining
- Near shopping
- Near major highways
Tags
Neighborhood map
What this means for you Summary
Snapshot
- This is a 3-bed/2.0-bath townhouse listed at $205k.
Deal economics
- At list price, monthly cash flow is $-226 ($-3k/yr) — negative.
- To cash-flow at today's rent, offer at most $165k (19.5% below list).
- To meet the 1% rule (rent ≥ 1% of price), the offer needs to be $186k (9.1% below list).
- Recommended offer: $165k (19.5% below list) — sets the bar for cash-flow.
- Cap rate 5.0% vs local median 3.7% in Arlington — top-decile yield for the area; either an underpriced asset or a hidden risk that comps aren't pricing in. Stress-test before assuming the spread holds.
Location & tenants
- Location reads 78/100 on livability (#75 in TX, #2,697 nationally) — a middle-class / working-renter tenant base. Strengths: amenities A+, cost of living A+, housing A+; Watch: schools D+, crime F, commute F.
- Arlington ISD (urban): math 24% / reading 34% proficiency, ranked #629 of 826 in TX (top 76%) — low school quality limits family demand, transient renter base, plan for 1-2y turnover.
- Market conditions: Rents rising fast (+4.1%/yr); 67 active listings in the ZIP; 40 comparable units currently listed for rent nearby; rentals at typical pace (median 20d on market — plan ~3-4 weeks tenant-placement turnaround); 18,938 units permitted in Tarrant County in 2024 (8,336 in 5+ unit buildings).
- This rent runs 37% of the median local income ($60k/yr) — at the standard rent-burdened threshold; future hikes will face affordability resistance.
Forward outlook
- Local home prices are declining (-3.0%/yr); year-one equity from $1k of loan paydown is wiped out by about $6k of value loss. Plan a longer hold.
- Tarrant County population projected at +41% by 2050 — long-run rental-demand tailwind backs the buy-and-hold thesis.
Negotiation context
- It's been on market 108 days — a 9% lower offer ($187k) is reasonable based on typical stale-listing flexibility.
- 9 sale attempts since 20y ago; this cycle's ask has dropped $25k (11%) from the opening price — seller is motivated, your offer sets the floor, not the list.
Risks & watch-outs
- Climate carrying-cost: major wind risk, 27% chance of damaging wind over 30y; extreme-heat days projected 7→22/yr by 2055 (HVAC capex compounding) — expect insurance premiums to compound above CPI over the hold.
Questions for the listing agent
- What do current leases actually rent for vs. the listed asking? Can we see a recent rent roll and the last 12 months of T-12 income?
- It's been on market 108 days. Have you received any prior offers? Is the seller open to a 20% concession, seller financing, or rate buy-down credit?
- Built in 1973 — when were the roof, HVAC, electrical panel, plumbing, and water heater last replaced?
- What does the HOA fee cover, when was the last increase, and are there any pending special assessments or reserve-fund shortfalls?
- Why hasn't it sold? Are there any deal-killer items the seller is aware of (foundation, flood, title, zoning, code violations)?
- Is there a deadline driving the sale (1031 exchange, divorce, estate, relocation)? That informs how much negotiation room exists.
- Schools are D-rated, which usually means shorter tenancies and higher turnover. Who's the typical renter profile here, and what's been the actual vacancy rate?
- Crime grade is F in this area — have there been break-ins, vandalism, or insurance claims at this property in the last 3 years? What carrier currently insures it and at what premium?
- The area grade is low — what's the realistic commute time and amenity access for the typical tenant pool here? Any planned neighborhood developments (good or bad) we should know about?
- What's the average days-on-market for RENTAL listings here right now (not sales)? A rising rental-DOM trend means longer vacancies and softer asking-rent achievability than the comps imply.
- What's the recent tenant-quality profile in this submarket — average credit score on applications, eviction rate, late-payment / NSF rate, and stable-employment percentage? A property-management company in the area should have these aggregated.
- How much new for-sale + rental construction is in the pipeline within 1–3 miles? Heavy new supply typically softens prices + rents 12–24 months out; constrained supply supports both.
Investment metrics
- 1% rule
- 0.91% ✗
- Cap rate
- 4.97%
- Cash-on-cash
- -4.73%
- DSCR
- 0.79
- GRM
- 9.2
CMA / ARV
- ARV (median comp)
- $258,120
- List price
- $205,000
- Delta
- -20.58%
- Verdict
- UNDERPRICED
- Comps
- 20 within 1.0 mi
Show comp detail 2 sales within ~0.75 mi
| Address | Dist | Beds/Ba | Sqft | Sold | Price | $/sf | Match |
|---|---|---|---|---|---|---|---|
| 2326 Overland Ln | 0.09mi | 3/2.0 | 1,239 (0%) | 12mo | $180,000 | $145 | 86 |
| 2312 Long Ridge Ln | 0.01mi | 3/2.0 | 1,239 (0%) | 21mo | $215,000 | $174 | 82 |
Match score weights: distance 35% · size 25% · config 20% · recency 20%. Top-matched comps best support the ARV.
Projected returns pro-forma
-3.0% appreciation · 4.08% rent growth · sell at horizon
- IRR
- -22.7%
- Equity multiple
- 0.21×
- Total profit
- $-45,383
- Equity at exit
- $30,566
- IRR
- -13.8%
- Equity multiple
- 0.15×
- Total profit
- $-48,672
- Equity at exit
- $17,725
Cash invested: $57,400 (down + closing). Projections, not guarantees.
Landlord ↔ Tenant lean methodology
- Overall (STATE)
- 87 Strongly Landlord-Friendly
- State Texas
- 87 Strongly Landlord-Friendly · R+5
- County
- — inherits STATE
- City
- — inherits STATE
ZIP-level market 76014
- Home prices YoY
- -30.2%
- Rents YoY
- 4.1%
- Active inventory
- 67
- Price-to-rent
- 9.2×
Monthly cashflow live
- Estimated rent
- $1,864 high interval (Pro) →
- Mortgage (P&I)
- −$1,075
- Tax from tax record
- −$378 /mo · $4,541/yr
- Insurance
- −$85
- HOA
- −$160
- Vacancy / Maint / Mgmt
- −$391
- Net cashflow
- $-226
Break-even live
UW: 25.0% down · 7.5% · 30yr · 1.5% tax · 5.0% vac · 8.0% maint · 8.0% mgmt
Financing live
Cash to close
- Down payment
- $51,250
- Closing costs
- $6,150
- Reserves months
- —
- Total cash needed
- —
Loan-product check · same deal, 3 products live
Conventional
25% down · 7.5% · 30yr
- Down + closing
- —
- Monthly P&I
- —
- Monthly cashflow
- —
- DSCR
- —
- Eligible?
- —
Personal DTI + credit; lowest rate.
DSCR
20% down · 8.5% · 30yr
- Down + closing
- —
- Monthly P&I
- —
- Monthly cashflow
- —
- DSCR
- —
- Eligible?
- —
No personal income docs; deal must DSCR.
Hard money
10% down · 12.0% · 12mo
- Down + closing
- —
- Monthly P&I
- —
- Monthly cashflow
- —
- DSCR
- —
- Eligible?
- —
Short-term bridge; refi at stabilization.
Rent comps 40 comps
| Address | Beds | Baths | Sqft | Rent | $/sqft | DOM | Units | Dist |
|---|---|---|---|---|---|---|---|---|
| 109 Kevin Ln Arlington, TX | 3.0 | 2.0 | 1375 | $1,550 | $1.13 | 24d | 1 | 0.01mi |
| 2310 Chapel Hill Ln Arlington, TX | 3.0 | 2.5 | 1375 | $1,795 | $1.31 | 4d | 1 | 0.05mi |
| 415 Stonehenge Dr Arlington, TX | 3.0 | 2.0 | 1334 | $2,095 | $1.57 | 24d | 1 | 0.09mi |
| 415 Stonehenge Dr Arlington, TX | 3.0 | 1.5 | 1344 | $2,095 | $1.56 | 17d | 1 | 0.09mi |
| 300 W Pioneer Pkwy Arlington, TX | 1.0–3.0 | 1.0–2.0 | 975 | $1,550 | $1.59 | 3d | 3 | 0.15mi |
| 2508 S Center St Arlington, TX | 4.0 | 2.0 | 1105 | $1,975 | $1.79 | 43d | 1 | 0.19mi |
| 600 W Pioneer Pkwy Arlington, TX | 1.0–2.0 | 1.0–1.5 | 800 | $1,225 | $1.53 | 43d | 1 | 0.26mi |
| 600 E Arkansas Ln Arlington, TX | 1.0–2.0 | 1.0–2.0 | 955 | $1,200 | $1.26 | 3d | 8 | 0.40mi |
| 2001 S Cooper St Arlington, TX | 3.0 | 1.0–2.0 | 745 | $1,675 | $2.25 | 24d | 34 | 0.49mi |
| 2001 S Cooper St Arlington, TX | 3.0 | 2.0 | 1054 | $1,675 | $1.59 | 17d | 1 | 0.49mi |
| 2001 S Cooper St Arlington, TX | 3.0 | 2.0 | 1054 | $1,675 | $1.59 | 18d | 1 | 0.49mi |
| 2001 S Cooper St Arlington, TX | 2.0 | 2.0 | 966 | $1,525 | $1.58 | 19d | 1 | 0.49mi |
| 2001 S Cooper St Unit 2028 Arlington, TX | 2.0 | 2.0 | 890 | $1,402 | $1.58 | 3d | 1 | 0.49mi |
| 812 Cooper Square Cir Arlington, TX | 1.0–2.0 | 1.0–2.0 | 870 | $1,277 | $1.47 | 1d | 25 | 0.56mi |
| 1012 W Pioneer Pkwy Arlington, TX | 3.0 | 1.0 | 647 | $1,815 | $2.80 | 2d | 23 | 0.56mi |
| 2252 Joey Ln Arlington, TX | 3.0 | 2.0 | 1345 | $1,644 | $1.22 | 43d | 1 | 0.57mi |
| 1905 Brookview Dr Arlington, TX | 3.0 | 2.0 | 1011 | $1,880 | $1.86 | 19d | 1 | 0.59mi |
| 1023 W Pioneer Pkwy Arlington, TX | 3.0 | 1.0–2.0 | 742 | $1,765 | $2.38 | 43d | 10 | 0.62mi |
| 1905 S Cooper St Arlington, TX | 3.0 | 2.5 | 968 | $1,700 | $1.76 | 7d | 1 | 0.66mi |
| 729 Buckskin Trl Arlington, TX | 2.0 | 1.0 | 1245 | $1,800 | $1.45 | 43d | 1 | 0.70mi |
| 903 Love Wood Ln Arlington, TX | 3.0 | 2.0 | 1461 | $2,000 | $1.37 | 43d | 1 | 0.70mi |
| 2900 Matlock Rd Arlington, TX | 2.0–3.0 | 1.5 | 1355 | $2,015 | $1.49 | 2d | 19 | 0.72mi |
| 848 Mirabell Ct #850 Arlington, TX | 3.0 | 2.0 | 1116 | $1,700 | $1.52 | 24d | 1 | 0.72mi |
| 2509 E Williamsburg Mnr Arlington, TX | 3.0 | 2.0 | 1478 | $1,996 | $1.35 | 20d | 1 | 0.73mi |
| 509 Baylor Dr Arlington, TX | 3.0 | 2.0 | 1390 | $1,995 | $1.44 | 43d | 1 | 0.82mi |
| 1808 Donna St Arlington, TX | 3.0 | 1.0 | 1277 | $2,800 | $2.19 | 24d | 1 | 0.83mi |
| 512 Rita Ln Unit D Arlington, TX | 2.0 | 1.5 | 1060 | $1,575 | $1.49 | 24d | 1 | 0.83mi |
| 1006 Bland Dr Unit 1012 Arlington, TX | 2.0 | 1.5 | 1067 | $1,245 | $1.17 | 24d | 1 | 0.85mi |
| 3006 Franciscan Dr Arlington, TX | 1.0–3.0 | 1.0–2.0 | 962 | $2,219 | $2.31 | 2d | 30 | 0.86mi |
| 2811 S Cooper St Arlington, TX | 2.0 | 1.0–2.0 | 902 | $2,260 | $2.50 | 2d | 36 | 0.87mi |
| 3200 S Center St Arlington, TX | 2.0 | 2.0 | 1110 | $2,040 | $1.84 | 24d | 1 | 0.87mi |
| 3012 Franciscan Dr Unit 2513 Arlington, TX | 3.0 | 2.0 | 1306 | $2,239 | $1.71 | 43d | 1 | 0.92mi |
| 1037 Southmoor Dr Arlington, TX | 2.0 | 1.0 | 928 | $1,450 | $1.56 | 24d | 1 | 0.94mi |
| 2910 S Collins St Arlington, TX | 1.0–3.0 | 1.0–2.0 | 815 | $1,499 | $1.84 | 13d | 12 | 0.95mi |
| 805 Biggs Ter Arlington, TX | 2.0 | 1.0 | 1300 | $1,500 | $1.15 | 2d | 1 | 0.96mi |
| 112 Holly Park Dr Arlington, TX | 1.0–3.0 | 1.0–2.0 | 790 | $1,700 | $2.15 | 6d | 16 | 0.97mi |
| 1104 Southmoor Dr Unit B Arlington, TX | 2.0 | 1.0 | 912 | $1,275 | $1.40 | 22d | 1 | 0.99mi |
| 420 W Park Row Dr Arlington, TX | 3.0 | 1.0–2.0 | 759 | $1,665 | $2.19 | 1d | 50 | 1.00mi |
| 825 W Mayfield Rd Arlington, TX | 1.0–3.0 | 1.0–2.5 | 960 | $2,614 | $2.72 | 3d | 9 | 1.02mi |
| 1003 Candlewick St Arlington, TX | 3.0 | 2.0 | 1230 | $2,106 | $1.71 | 7d | 1 | 1.08mi |
HOA detail
- Monthly dues
- $160 · $1,920/yr
Listing history 47 events
-
2026-06-18days on market $205,000 Active 108 DOM
-
2026-06-17days on market $205,000 Active 107 DOM
-
2026-06-16days on market $205,000 Active 106 DOM
-
2026-06-15days on market $205,000 Active 105 DOM
-
2026-06-13days on market $205,000 Active 103 DOM
-
2026-06-09days on market $205,000 Active 99 DOM
-
2026-06-08days on market $205,000 Active 98 DOM
-
2026-06-07days on market $205,000 Active 97 DOM
-
2026-06-04days on market $205,000 Active 94 DOM
-
2026-06-03days on market $205,000 Active 93 DOM
-
2026-06-02days on market $205,000 Active 92 DOM
-
2026-06-01days on market $205,000 Active 91 DOM
-
2026-05-31days on market $205,000 Active 90 DOM
-
2026-05-14price $205,000 424-char remark
Show marketing remark (424 chars)
Located in a prime Arlington location, this property offers an excellent opportunity for both homeowners and investors. Conveniently situated near major highways, shopping, dining, and just minutes from AT&T Stadium, this home is in an area with strong demand and great accessibility. Currently operating as a successful Airbnb, the property stays consistently booked, making it an ideal income-producing opportunity.
-
2026-04-16price $210,000 424-char remark
Show marketing remark (424 chars)
Located in a prime Arlington location, this property offers an excellent opportunity for both homeowners and investors. Conveniently situated near major highways, shopping, dining, and just minutes from AT&T Stadium, this home is in an area with strong demand and great accessibility. Currently operating as a successful Airbnb, the property stays consistently booked, making it an ideal income-producing opportunity.
-
2026-04-07price $220,000 424-char remark
Show marketing remark (424 chars)
Located in a prime Arlington location, this property offers an excellent opportunity for both homeowners and investors. Conveniently situated near major highways, shopping, dining, and just minutes from AT&T Stadium, this home is in an area with strong demand and great accessibility. Currently operating as a successful Airbnb, the property stays consistently booked, making it an ideal income-producing opportunity.
-
2026-03-17price $225,000 424-char remark
Show marketing remark (424 chars)
Located in a prime Arlington location, this property offers an excellent opportunity for both homeowners and investors. Conveniently situated near major highways, shopping, dining, and just minutes from AT&T Stadium, this home is in an area with strong demand and great accessibility. Currently operating as a successful Airbnb, the property stays consistently booked, making it an ideal income-producing opportunity.
-
2026-02-24$230,000 Active 424-char remark
Show marketing remark (424 chars)
Located in a prime Arlington location, this property offers an excellent opportunity for both homeowners and investors. Conveniently situated near major highways, shopping, dining, and just minutes from AT&T Stadium, this home is in an area with strong demand and great accessibility. Currently operating as a successful Airbnb, the property stays consistently booked, making it an ideal income-producing opportunity.
-
2022-02-23soldstatus
-
2022-02-17soldstatus Sold 443-char remark
Show marketing remark (443 chars)
This townhome is located on a street lined with Beautiful Majestic trees and would make a great investment property! Come see the high ceilings, good sizes bedrooms, covered 2 car carport, and small backyard space. The primary bedroom is downstairs, while the secondary bedrooms are upstairs all with walk-in closets. Located minutes from The Parks Shopping Center, restaurants, major highways, and much more! The seller will need a leaseback.
-
2022-02-02status Pending 443-char remark
Show marketing remark (443 chars)
This townhome is located on a street lined with Beautiful Majestic trees and would make a great investment property! Come see the high ceilings, good sizes bedrooms, covered 2 car carport, and small backyard space. The primary bedroom is downstairs, while the secondary bedrooms are upstairs all with walk-in closets. Located minutes from The Parks Shopping Center, restaurants, major highways, and much more! The seller will need a leaseback.
-
2022-01-28historical Active Option Contract 443-char remark
Show marketing remark (443 chars)
This townhome is located on a street lined with Beautiful Majestic trees and would make a great investment property! Come see the high ceilings, good sizes bedrooms, covered 2 car carport, and small backyard space. The primary bedroom is downstairs, while the secondary bedrooms are upstairs all with walk-in closets. Located minutes from The Parks Shopping Center, restaurants, major highways, and much more! The seller will need a leaseback.
-
2022-01-19$198,000 Active 443-char remark
Show marketing remark (443 chars)
This townhome is located on a street lined with Beautiful Majestic trees and would make a great investment property! Come see the high ceilings, good sizes bedrooms, covered 2 car carport, and small backyard space. The primary bedroom is downstairs, while the secondary bedrooms are upstairs all with walk-in closets. Located minutes from The Parks Shopping Center, restaurants, major highways, and much more! The seller will need a leaseback.
-
2021-12-21historical
-
2021-12-14status Active
-
2021-11-16status Pending
-
2021-11-15price $190,000
-
2021-11-15historical
-
2021-11-10status Active
-
2021-11-04status Pending
-
2021-10-27status Active
-
2021-08-09historical
-
2021-07-09$175,000
-
2019-03-21soldstatus
-
2019-03-20soldstatus Sold
-
2019-03-01status Pending
-
2019-02-20historical Active Option Contract
-
2019-02-15$128,900 Active
-
2009-10-15soldstatus
-
2009-10-09soldstatus
-
2009-09-06historical
-
2009-06-03$75,000
-
2007-02-15soldstatus
-
2007-02-09soldstatus
-
2007-01-27historical
-
2006-10-23$69,500
-
1995-08-18soldstatus
ⓘ Source: listings_history table (triggers on properties + properties_extension) + one-shot
backfill from property_details.listing_events for pre-trigger history.
Tax reassessment forecast TX · Resets to sale price
- Current annual tax
- $4,541 · $378/mo
- Projected year-2 tax
- $4,541 · $378/mo
- Expected delta
- $0/yr ($0/mo · 0.0%)
ⓘ Screening estimate from a state-policy table — verify with the county assessor before closing.
Climate risk First Street
- Flood 1/10 Low FEMA zone X (unshaded) · 0% chance over 30 yrs
- Wildfire 1/10 Low
- Heat 7/10 Severe 7 d/yr ≥109°F today · 22 d/yr by 30 yrs out
- Wind 6/10 Major 27% chance of damaging wind over 30 yrs
- Air quality 3/10 Moderate 2 unhealthy d/yr today · 4 by 30 yrs out
Nearby sold comps map
Loading sold comps map…
Walkable amenities ~0.75 mi
Loading nearby amenities…
Taxation est. · year 1
- Rental income
- $22,368
- − Mortgage interest
- −$11,483
- − Property taxes
- −$4,541
- − Insurance
- −$1,025
- − Repairs & maintenance
- −$1,789
- − Management
- −$1,789
- − HOA
- −$1,920
- − Depreciation
- −$5,964
- Taxable loss
- −$6,144
- Est. tax savings @ 24.0%
- +$1,474
- After-tax cash flow
- $-1,241/yr
For passive investors: Depreciation is non-cash, so a rental often shows a tax loss while cash-flowing — sheltering income. Rental losses are passive: they offset passive income freely, and up to $25,000/yr can offset ordinary (W-2) income if you actively participate and your MAGI is under $100k (phasing out to $0 by $150k); unused losses carry forward. On sale, claimed depreciation is recaptured at up to 25%, and gains may owe capital-gains tax (a 1031 exchange can defer both). Figures are a year-1 estimate at your 24.0% rate — not tax advice; consult a CPA.
Schools (NCES district)
- District
- Arlington ISD
- NCES district ID
- 4808700
- Math proficiency
- 24% ▼ -21.00%
- Reading proficiency
- 34% ▼ -8.00%
- Median HH income
- $50,873
- Composite
- 25.42/100
- National rank
- #7458
- State rank
- #629 of 826 in TX
Livability — Arlington
- Score
- 78/100
- State rank
- #75
- US rank
- #2697
Category grades
Schools grade is shown separately in the Schools card above.
Census & demographics
- Census place
- Arlington, TX
- County
- Tarrant County · 2,033,669 people
- City population
- 366,588
- Metro
- Dallas-Fort Worth-Arlington, TX
- Population (ZIP)
- 32,818
- Household income
- $60,333
- Rent vs Own
- Severe rent burden
- 2233.0
Population outlook (Tarrant County) Hauer SSP2
- Today (2025)
- 2,380,417 people
- By 2030
- 2,578,900 · +8.3%
- By 2040
- 2,974,995 · +25.0%
- By 2050
- 3,350,489 · +40.8%
- By 2075
- 4,216,909 · +77.2%
- By 2100
- 4,741,527 · +99.2%
Race, ethnicity, and origin ACS 2023
- Neighborhood character
- Highly diverse neighborhood (Simpson 0.70)
- Race & ethnicity
- Hispanic / Latino 44% Two or more races 25% Black 24% White 19% Asian 9%
- Hispanic origin (detail)
- Mexican 36% Puerto Rican 2%
- Common ancestry
- Italian 1% Slovak 1%
- Foreign-born
- 30% · Canada, Vietnam, Jamaica
- Languages at home
- 49% English-only · Spanish 35% Vietnamese 7% German/W. Germanic 1%
Political lean MEDSL · Tarrant
- 2024 margin
- Lean R (+5.1) · D 46.7% · R 51.9% · Other 1.4%
- 2008→2024 swing
- +6.6pp toward D · 2008: -11.7pp · 2024: -5.1pp
- All cycles
- 2024: R+5.1 2020: D+0.2 2016: R+8.7 2012: R+15.7 2008: R+11.7
Not yet ingested
- Civics
- —
Market trends
- HPI YoY
- ▼ -149.12%
- Current HPI
- 344.4376
- Rent YoY
- ▲ 4.08%
- Metro
- Dallas-Fort Worth-Arlington, TX
- State GDP YoY
- ▲ 3.95%
- F500 in state
- 110
Industry mix (Fortune 500 HQ in TX)
| Industry | F500 HQs | Revenue |
|---|---|---|
| Energy | 16 | $1,198B |
|
||
| Technology | 5 | $198B |
|
||
| Engineering / Construction | 4 | $72B |
|
||
| Energy Services | 3 | $60B |
|
||
| Utilities | 3 | $41B |
|
||
| Healthcare | 2 | $330B |
|
||
Price history
+195.0% since first listed34 events — show timeline
- 2026-05-14 Price Changed $205,000 NTREIS
- 2026-04-16 Price Changed $210,000 NTREIS
- 2026-04-07 Price Changed $220,000 NTREIS
- 2026-03-17 Price Changed $225,000 NTREIS
- 2026-02-24 Listed $230,000 NTREIS
- 2022-02-23 Sold (Public Records) — Public Records
- 2022-02-17 Sold (MLS) — NTREIS
- 2022-02-02 Pending — NTREIS
- 2022-01-28 Contingent — NTREIS
- 2022-01-19 Listed $198,000 NTREIS
- 2021-12-21 Listing Removed — NTREIS
- 2021-12-14 Relisted — NTREIS
- 2021-11-16 Pending — NTREIS
- 2021-11-15 Listing Removed — NTREIS
- 2021-11-15 Price Changed $190,000 NTREIS
- 2021-11-10 Relisted — NTREIS
- 2021-11-04 Pending — NTREIS
- 2021-10-27 Relisted — NTREIS
- 2021-08-09 Listing Removed — NTREIS
- 2021-07-09 Listed $175,000 NTREIS
- 2019-03-21 Sold (Public Records) — Public Records
- 2019-03-20 Sold (MLS) — NTREIS
- 2019-03-01 Pending — NTREIS
- 2019-02-20 Contingent — NTREIS
- 2019-02-15 Listed $128,900 NTREIS
- 2009-10-15 Sold (Public Records) — Public Records
- 2009-10-09 Sold (MLS) — NTREIS
- 2009-09-06 Listing Removed — NTREIS
- 2009-06-03 Listed $75,000 NTREIS
- 2007-02-15 Sold (Public Records) — Public Records
- 2007-02-09 Sold (MLS) — NTREIS
- 2007-01-27 Listing Removed — NTREIS
- 2006-10-23 Listed $69,500 NTREIS
- 1995-08-18 Sold (Public Records) — Public Records
Property tax history
+7.3%/yrLatest (2025): $4,541 · +0.0% YoY. Source: county tax records.
Cash-flow waterfall
monthlySold comps — $/sqft
last 12 mo · ≤1 miLoading sold comps…