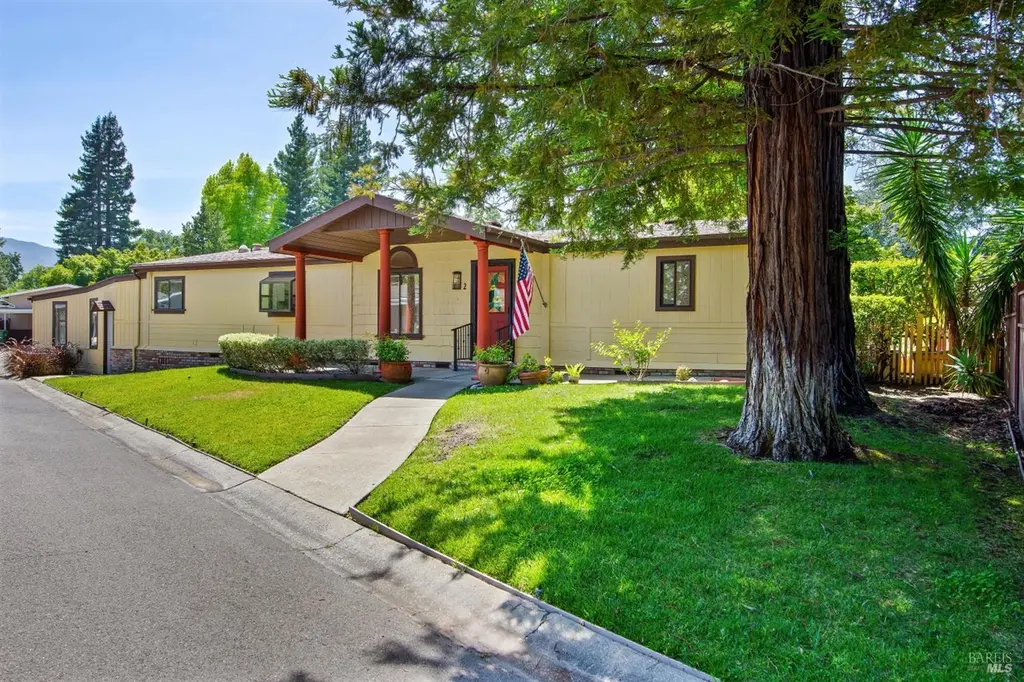
2 San Juan Ct · St. Helena, CA
Flood risk 9/10 · Severe
- FEMA flood zone
- X
- Chance of flooding over 30 yrs
- 0.99%
- Est. flood insurance / yr
- $507 – $1,088
Fire risk 6/10 · Moderate
- Est. fire insurance / yr
- $659 – $1,223
Heat risk 5/10 · Moderate
- Hot days now (above 99°F)
- 9 days/yr
- Hot days in 30 yrs
- 19 days/yr
Wind risk 1/10 · Minimal
- Chance of severe wind over 30 yrs
- —
Air-quality risk 10/10 · Severe
- Unhealthy air days now
- 22 days/yr
- Unhealthy air days in 30 yrs
- 22 days/yr
Risk factors via First Street. Map © Google.
Why this score? — see what drove the C+ grade
The composite is a weighted blend of 9 inputs, each scored 0–100. Each bar is that input's sub-score; the figure is the points it added to the 100-point composite (weight × sub-score).
- Cash flow +29.6/30.0
- DSCR +10.0/10.0
- 1% rule +8.3/10.0
- Schools +5.4/10.0
- Rent growth +2.5/5.0
- Livability +2.5/5.0
- Condition / age +2.5/5.0
- ARV discount +2.1/15.0
- Appreciation +0.0/10.0
$425,000
🖨 Deal sheet 📄 Offer letter ✓ Due diligence
Listing remarks
In the heart of wine country, a rare opportunity awaits in Napa Valley's premier 55+ community, Vineyard Valley. One of just a few three-bedroom, two-bath homes with a detached garage, this generously proportioned residence offers approximately 1,568 sq ft of living space plus a private side yard and backyard perfect for gardening or outdoor entertaining. Inside, you'll find a spacious kitchen and living room brightened by skylights, a large primary en suite with walk-in closet, laundry room, and two additional sizeable rooms. One of these versatile rooms, also with its own walk-in closet, features a sliding glass door leading to the backyard and can easily serve as a guest room, study, or
Key facts
- Laundry room
- Spacious kitchen
- Private side yard
Tags
Property features AI
Finance
- Financial info: Monthly land lease payment
- HOA & community: No homeowners association; Senior community
Exterior
- Parking: Detached garage; Guest parking available; Interior access; 3 parking spaces
- Utilities: Individual electric meter; Individual gas meter; Natural gas connected; Public sewer
- Home design: Manufactured home (double wide) in a park; Land lease community; Skirted with brick; Composition roof
- Construction: Manufacturer: FUQUA (09755 FUQUA HM INC)
- Exterior features: Fenced yard; Backyard; Front yard; Garden
Interior
- Kitchen: Dishwasher; Disposal; Electric cooktop; Free-standing electric oven; Free-standing refrigerator; Microwave; Breakfast area
- Bedrooms: 3 bedrooms
- Flooring: Carpet; Simulated wood
- Bathrooms: 2 full bathrooms; Double sinks; Shower stall(s); Tub with shower over
- Heating & cooling: Central heating; Central cooling; Gas-log fireplace with insert (1)
- Interior features: Cathedral ceiling; Bonus room; Laundry room; Storage; Utility room; Family room with cathedral/vaulted ceiling and skylights; Living room with cathedral/vaulted ceiling and skylights; Kitchen with breakfast area and skylight(s)
- Laundry & utility: Washer included; Dryer included; 220V in laundry
Neighborhood map
What this means for you Summary
Snapshot
- This is a 3-bed/2.0-bath manufactured listed at $425k.
Deal economics
- At list price, monthly cash flow is $1k ($18k/yr) — positive.
- The deal already cash-flows at list — no discount required.
- Meets the 1% rule at list price ($6k rent vs $425k).
- Recommended offer: $419k (1.5% below list) — sets the bar for market timing.
- Cap rate 10.6% vs local median 1.7% in St. Helena — top-decile yield for the area; either an underpriced asset or a hidden risk that comps aren't pricing in. Stress-test before assuming the spread holds.
Location & tenants
- Location reads: area grade C — affects rentability + tenant quality, not the cash-flow math above.
- Saint Helena Unified (town): math 50% / reading 67% proficiency, ranked #231 of 1,400 in CA (top 16%) — acceptable for families but not a draw, mixed tenant base, ~2y average lease.
- Market conditions: 127 active listings in the ZIP; 5 comparable units currently listed for rent nearby; rentals at typical pace (median 21d on market — plan ~3-4 weeks tenant-placement turnaround); high-income renter base; 427 units permitted in Napa County in 2024 (189 in 5+ unit buildings).
- At $5,664/mo this rent would consume 49% of the median local household income ($139k/yr) (locally 383% of renters already pay >50% of income on rent) — very limited rent-growth headroom before tenants either downsize or default.
Forward outlook
- Local home prices are declining (-3.0%/yr); year-one equity from $3k of loan paydown is wiped out by about $13k of value loss. Plan a longer hold.
- Napa County population projected at +14% by 2050 — modest demand growth; plan on rents tracking national, not racing it.
- At projected returns (-3.0% appreciation + 3.0% rent growth), your $119k cash investment doubles in ~8 years — after that, you're playing with house money.
Negotiation context
- It's been on market 15 days — a 2% lower offer ($419k) is reasonable based on typical stale-listing flexibility.
Risks & watch-outs
- Watch-outs: flood insurance adds $66/mo.
- Climate carrying-cost: severe flood risk; major wildfire risk; extreme-heat days projected 9→19/yr by 2055 (HVAC capex compounding) — expect insurance premiums to compound above CPI over the hold.
Questions for the listing agent
- What's the actual annual flood-insurance premium (NFIP or private), and is the property in a SFHA with mandatory coverage?
- Is there a deadline driving the sale (1031 exchange, divorce, estate, relocation)? That informs how much negotiation room exists.
- What's the average days-on-market for RENTAL listings here right now (not sales)? A rising rental-DOM trend means longer vacancies and softer asking-rent achievability than the comps imply.
- What's the recent tenant-quality profile in this submarket — average credit score on applications, eviction rate, late-payment / NSF rate, and stable-employment percentage? A property-management company in the area should have these aggregated.
- How much new for-sale + rental construction is in the pipeline within 1–3 miles? Heavy new supply typically softens prices + rents 12–24 months out; constrained supply supports both.
Investment metrics
- 1% rule
- 1.33% ✓
- Cap rate
- 10.63%
- Cash-on-cash
- 15.51%
- DSCR
- 1.69
- GRM
- 6.3
CMA / ARV
- ARV (on-the-fly)
- $379,456
- Comps found
- 12
Show comp detail 12 sales within ~0.75 mi
| Address | Dist | Beds/Ba | Sqft | Sold | Price | $/sf | Match |
|---|---|---|---|---|---|---|---|
| 4 San Juan Ct | 0.01mi | 2/2.0 (-1) | 1,536 (-2%) | 11mo | $275,000 | $179 | 82 |
| 7 Del Campo Ct | 0.04mi | 2/2.0 (-1) | 1,680 (+7%) | 2mo | $520,000 | $310 | 80 |
| 56 Laguna Seca Ct | 0.13mi | 3/2.0 | 1,456 (-7%) | 3mo | $400,000 | $275 | 80 |
| 24 San Lucas Ct | 0.18mi | 2/2.5 (-1) | 1,578 (+1%) | 6mo | $420,000 | $266 | 78 |
| 4 La Canada Ct | 0.05mi | 2/2.0 (-1) | 1,440 (-8%) | 5mo | $349,000 | $242 | 74 |
| 14 San Lucas Ct | 0.16mi | 2/2.0 (-1) | 1,440 (-8%) | 2mo | $370,000 | $257 | 72 |
| 8 San Lucas Ct | 0.15mi | 2/2.0 (-1) | 1,440 (-8%) | 5mo | $289,000 | $201 | 70 |
| 2 San Ardo Ct | 0.14mi | 2/2.0 (-1) | 1,440 (-8%) | 6mo | $235,000 | $163 | 70 |
| 5 La Cuesta Ct | 0.08mi | 2/2.0 (-1) | 1,440 (-8%) | 10mo | $258,700 | $180 | 69 |
| 16 Los Robles Ct | 0.15mi | 2/2.0 (-1) | 1,440 (-8%) | 7mo | $381,000 | $265 | 69 |
| 12 Del Rio Ct | 0.12mi | 2/2.0 (-1) | 1,344 (-14%) | 3mo | $185,000 | $138 | 63 |
| 2 La Canada Ct | 0.06mi | 2/2.0 (-1) | 1,344 (-14%) | 8mo | $285,000 | $212 | 62 |
Match score weights: distance 35% · size 25% · config 20% · recency 20%. Top-matched comps best support the ARV.
Projected returns pro-forma
-3.0% appreciation · 3.0% rent growth · sell at horizon
- IRR
- 5.4%
- Equity multiple
- 1.21×
- Total profit
- $24,955
- Equity at exit
- $63,369
- IRR
- 14.8%
- Equity multiple
- 2.20×
- Total profit
- $142,893
- Equity at exit
- $36,746
Cash invested: $119,000 (down + closing). Projections, not guarantees.
Landlord ↔ Tenant lean methodology
- Overall (STATE)
- 18 Strongly Tenant-Friendly
- State California
- 18 Strongly Tenant-Friendly · D+13
- County
- — inherits STATE
- City
- — inherits STATE
ZIP-level market 94574
- Active inventory
- 127
- Price-to-rent
- 6.3×
Monthly cashflow live
- Estimated rent
- $5,664 medium interval (Pro) →
- Mortgage (P&I)
- −$2,229
- Tax est. 1.5%
- −$531 /mo · $6,375/yr
- Insurance
- −$177
- Flood insurance flood zone
- −$66 /mo · $798/yr
- HOA
- −$0
- Vacancy / Maint / Mgmt
- −$1,189
- Net cashflow
- $1,471
Break-even live
UW: 25.0% down · 7.5% · 30yr · 1.5% tax · 5.0% vac · 8.0% maint · 8.0% mgmt
Financing live
Cash to close
- Down payment
- $106,250
- Closing costs
- $12,750
- Reserves months
- —
- Total cash needed
- —
Loan-product check · same deal, 3 products live
Conventional
25% down · 7.5% · 30yr
- Down + closing
- —
- Monthly P&I
- —
- Monthly cashflow
- —
- DSCR
- —
- Eligible?
- —
Personal DTI + credit; lowest rate.
DSCR
20% down · 8.5% · 30yr
- Down + closing
- —
- Monthly P&I
- —
- Monthly cashflow
- —
- DSCR
- —
- Eligible?
- —
No personal income docs; deal must DSCR.
Hard money
10% down · 12.0% · 12mo
- Down + closing
- —
- Monthly P&I
- —
- Monthly cashflow
- —
- DSCR
- —
- Eligible?
- —
Short-term bridge; refi at stabilization.
Rent comps 5 comps
| Address | Beds | Baths | Sqft | Rent | $/sqft | DOM | Units | Dist |
|---|---|---|---|---|---|---|---|---|
| 829 Hunt Ave Unit C St Helena, CA | 2.0 | 1.0 | 1100 | $3,200 | $2.91 | 13d | 1 | 0.35mi |
| 844 Signorelli Cir Saint Helena, CA | 3.0 | 2.0 | 2020 | $5,495 | $2.72 | 21d | 1 | 0.41mi |
| 1082 Mariposa Ln Saint Helena, CA | 3.0 | 2.0 | 1312 | $4,350 | $3.32 | 13d | 1 | 0.43mi |
| 1655 Scott St Saint Helena, CA | 3.0 | 3.0 | 2074 | $6,500 | $3.13 | 21d | 1 | 1.10mi |
| 1811 Hillview Pl Saint Helena, CA | 2.0 | 2.5 | 1583 | $12,500 | $7.90 | 21d | 1 | 1.11mi |
Listing history 13 events
-
2026-06-19days on market $425,000 Active 15 DOM
-
2026-06-18days on market $425,000 Active 14 DOM
-
2026-06-17days on market $425,000 Active 13 DOM
-
2026-06-16days on market $425,000 Active 12 DOM
-
2026-06-15days on market $425,000 Active 11 DOM
-
2026-06-14days on market $425,000 Active 9 DOM
-
2026-06-13days on market $425,000 Active 8 DOM
-
2026-06-10days on market $425,000 Active 6 DOM
-
2026-06-09days on market $425,000 Active 5 DOM
-
2026-06-08days on market $425,000 Active 4 DOM
-
2026-06-07days on market $425,000 Active 3 DOM
-
2026-06-05remarks 699-char remark
-
2026-06-05$425,000 Active 1 DOM
ⓘ Source: listings_history table (triggers on properties + properties_extension) + one-shot
backfill from property_details.listing_events for pre-trigger history.
Climate risk First Street
- Flood 9/10 Extreme FEMA zone X · 99% chance over 30 yrs
- Wildfire 6/10 Major
- Heat 5/10 Major 9 d/yr ≥99°F today · 19 d/yr by 30 yrs out
- Wind 1/10 Low
- Air quality 10/10 Extreme 22 unhealthy d/yr today · 22 by 30 yrs out
Nearby sold comps map
Loading sold comps map…
Walkable amenities ~0.75 mi
Loading nearby amenities…
Taxation est. · year 1
- Rental income
- $67,970
- − Mortgage interest
- −$23,807
- − Property taxes
- −$6,375
- − Insurance
- −$2,922
- − Repairs & maintenance
- −$5,438
- − Management
- −$5,438
- − Depreciation
- −$12,364
- Taxable income
- $11,627
- Est. tax owed @ 24.0%
- −$2,790
- After-tax cash flow
- $14,863/yr
For passive investors: Depreciation is non-cash, so a rental often shows a tax loss while cash-flowing — sheltering income. Rental losses are passive: they offset passive income freely, and up to $25,000/yr can offset ordinary (W-2) income if you actively participate and your MAGI is under $100k (phasing out to $0 by $150k); unused losses carry forward. On sale, claimed depreciation is recaptured at up to 25%, and gains may owe capital-gains tax (a 1031 exchange can defer both). Figures are a year-1 estimate at your 24.0% rate — not tax advice; consult a CPA.
Schools (NCES district)
- District
- Saint Helena Unified
- NCES district ID
- 0637830
- Math proficiency
- 50% ▲ 5.00%
- Reading proficiency
- 67% ▲ 4.00%
- Median HH income
- $80,540
- Composite
- 54.39/100
- National rank
- #2913
- State rank
- #231 of 1400 in CA
Livability — St. Helena
No livability data for this city. (Only ~50 U.S. cities are tracked.)
Census & demographics
- Census place
- St. Helena, CA
- County
- Napa County · 120,669 people
- Metro
- Napa, CA
- Population (ZIP)
- 7,457
- Household income
- $139,474
- Rent vs Own
- Severe rent burden
- 383.0
Population outlook (Napa County) Hauer SSP2
- Today (2025)
- 153,987 people
- By 2030
- 159,490 · +3.6%
- By 2040
- 168,796 · +9.6%
- By 2050
- 176,213 · +14.4%
- By 2075
- 190,113 · +23.5%
- By 2100
- 190,528 · +23.7%
Race, ethnicity, and origin ACS 2023
- Neighborhood character
- Predominantly White (68%)
- Race & ethnicity
- White 68% Hispanic / Latino 27% Two or more races 10% Asian 1%
- Hispanic origin (detail)
- Mexican 22%
- Common ancestry
- Italian 6% Lithuanian 4% German 3%
- Foreign-born
- 22% · Canada, Dominican Republic
- Languages at home
- 73% English-only · Spanish 22% Other Indo-European 1% French/Haitian/Cajun 1%
Political lean MEDSL · Napa
- 2024 margin
- Solid D (+34.9) · D 65.9% · R 31.1% · Other 3.0%
- 2008→2024 swing
- +2.4pp toward D · 2008: 32.5pp · 2024: 34.9pp
- All cycles
- 2024: D+34.9 2020: D+40.4 2016: D+35.2 2012: D+25.7 2008: D+32.5
Not yet ingested
- Civics
- —
Market trends
- HPI YoY
- ▼ -711.97%
- Current HPI
- 203.5761
- Rent YoY
- —
- Metro
- Napa, CA
- State GDP YoY
- ▲ 3.21%
- F500 in state
- 116
Industry mix (Fortune 500 HQ in CA)
| Industry | F500 HQs | Revenue |
|---|---|---|
| Technology | 27 | $1,492B |
|
||
| Financial Services | 3 | $174B |
|
||
| Retail | 3 | $44B |
|
||
| Insurance | 3 | $26B |
|
||
| Media / Entertainment | 2 | $115B |
|
||
| Pharmaceuticals / Biotech | 2 | $62B |
|
||
Price history
1 event — show timeline
- 2026-06-04 Listed $425,000 BAREIS
Property tax history
+2.3%/yrLatest (2025): $767 · +34.9% YoY. Source: county tax records.
Cash-flow waterfall
monthlySold comps — $/sqft
last 12 mo · ≤1 miLoading sold comps…