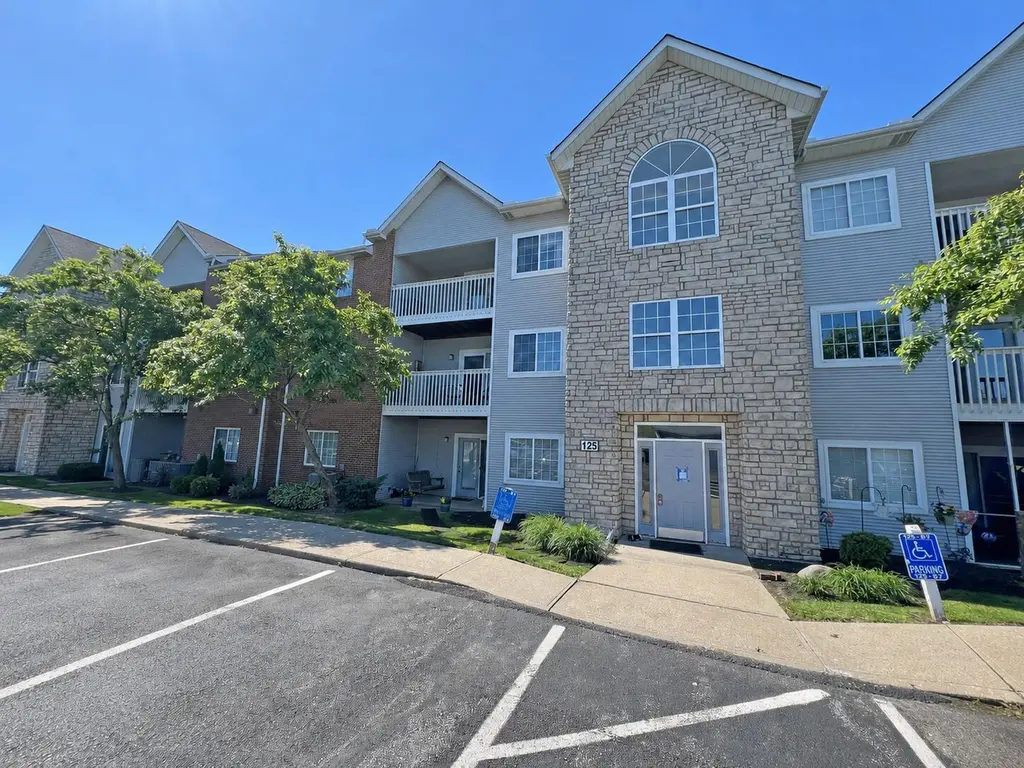
125 Barren Riv #9 · Erlanger, KY
Flood risk 1/10 · Minimal
- FEMA flood zone
- X (unshaded)
- Chance of flooding over 30 yrs
- 0.0%
- Est. flood insurance / yr
- $507 – $1,088
Fire risk 1/10 · Minimal
- Est. fire insurance / yr
- $839 – $1,559
Heat risk 4/10 · Minor
- Hot days now (above 101°F)
- 7 days/yr
- Hot days in 30 yrs
- 19 days/yr
Wind risk 2/10 · Minimal
- Chance of severe wind over 30 yrs
- 1.0%
Air-quality risk 2/10 · Minimal
- Unhealthy air days now
- 1 days/yr
- Unhealthy air days in 30 yrs
- 3 days/yr
Risk factors via First Street. Map © Google.
Why this score? — see what drove the D grade
The composite is a weighted blend of 9 inputs, each scored 0–100. Each bar is that input's sub-score; the figure is the points it added to the 100-point composite (weight × sub-score).
- Cash flow +12.1/30.0
- ARV discount +7.5/15.0
- 1% rule +5.3/10.0
- DSCR +3.6/10.0
- Rent growth +3.6/5.0
- Livability +3.6/5.0
- Condition / age +2.5/5.0
- Schools +2.3/10.0
- Appreciation +0.0/10.0
$140,000
🖨 Deal sheet (PDF) 📄 Offer letter ✓ Due diligence
Listing remarks MLS
Exquisite Condo! If you are wanting to avoid steps, you must consider this first. The elevator is across the hall from your entrance and your garage is directly across from the building entrance.
Key facts
- Community pool
- Private balcony
- Top-floor condo
Tags
Property features AI
Finance
- HOA & community: Monthly association fee; Association amenities include landscaping, year-round lake, elevators, pool, and clubhouse; Association fee covers association fees, grounds maintenance, management, sewer, snow removal, trash, and water
Exterior
- Parking: Assigned parking; Garage (1 space)
- Utilities: Public water; Public sewer; Sewer available; Water available
- Home design: Condominium; One level; Entry at level 1; Has a view
- Construction: Built in 1994; Brick and vinyl siding exterior; Shingle roof; Slab foundation
- Exterior features: Covered balcony; Balcony; Covered patio/porch
Interior
- Kitchen: Electric range; Dishwasher; Disposal; Microwave; Refrigerator
- Bedrooms: Primary bedroom with double closets; Second bedroom
- Flooring: Laminate counters listed (flooring material not specified)
- Bathrooms: 2 full bathrooms
- Heating & cooling: Central air conditioning; Forced air heating; Electric heating
- Interior features: Open floorplan; Entrance foyer; Chandelier; Cathedral ceilings; Ceiling fans; Elevator; High ceilings; Intercom; Laminate counters
- Laundry & utility: Laundry room on main level; Washer hookup; Electric dryer hookup; Washer and dryer included
Neighborhood map
What this means for you Summary
Snapshot
- This is a 2-bed/2.0-bath condo listed at $140k.
Deal economics
- At list price, monthly cash flow is $-30 ($-365/yr) — negative.
- To cash-flow at today's rent, offer at most $135k (3.8% below list).
- Meets the 1% rule at list price ($1k rent vs $140k).
- Recommended offer: $135k (3.8% below list) — sets the bar for cash-flow.
- Cap rate 6.0% vs local median 3.8% in Erlanger — top-decile yield for the area; either an underpriced asset or a hidden risk that comps aren't pricing in. Stress-test before assuming the spread holds.
Location & tenants
- Location reads 72/100 on livability (#126 in KY) — a middle-class / working-renter tenant base. Strengths: crime A+, cost of living A+, housing A+; Watch: amenities F, commute F, health & safety F.
- Erlanger-Elsmere Independent (suburban): math 21% / reading 32% proficiency, ranked #128 of 165 in KY (top 78%) — low school quality limits family demand, transient renter base, plan for 1-2y turnover.
- Zoned schools: Miles Elementary School (math 27% / reading 22%, grade F, #489 of 676 statewide, top 76%, 230 students, 50% FRL); Tichenor Middle School (math 19% / reading 38%, grade F, #161 of 217 statewide, top 75%, 539 students, 54% FRL); Lloyd High School (math 22% / reading 32%, grade F, #158 of 254 statewide, top 68%, 697 students, 57% FRL) — zoned schools at 53% FRL track the district average.
- Market conditions: Rents rising fast (+4.2%/yr); 124 active listings in the ZIP; 22 comparable units currently listed for rent nearby; rentals at typical pace (median 16d on market — plan ~3-4 weeks tenant-placement turnaround); 699 units permitted in Kenton County in 2024 (287 in 5+ unit buildings).
Forward outlook
- Local home prices are declining (-3.0%/yr); year-one equity from $968 of loan paydown is wiped out by about $4k of value loss. Plan a longer hold.
- Kenton County population projected at +5% by 2050 — modest demand growth; plan on rents tracking national, not racing it.
Negotiation context
- Only 5 days on market — expect competitive offers; lowballing is unlikely to land.
- 3 sale attempts since 18y ago with the ask held roughly flat each time — persistent listings suggest the price (not the market) is what's stuck; bring a comps-based counter.
- Current owner paid $89k; list at $140k implies a 57% gain — meaningful room to come down on a strong offer.
Risks & watch-outs
- Watch-outs: HOA is 20% of rent.
Questions for the listing agent
- What do current leases actually rent for vs. the listed asking? Can we see a recent rent roll and the last 12 months of T-12 income?
- What does the HOA fee cover, when was the last increase, and are there any pending special assessments or reserve-fund shortfalls?
- Any open or pending special assessments — roof, HVAC, plumbing, elevator, façade? What's the per-unit balance and payoff schedule, and is the seller paying it off at close or rolling it to the buyer?
- Is there a deadline driving the sale (1031 exchange, divorce, estate, relocation)? That informs how much negotiation room exists.
- Schools are F-rated, which usually means shorter tenancies and higher turnover. Who's the typical renter profile here, and what's been the actual vacancy rate?
- The area grade is low — what's the realistic commute time and amenity access for the typical tenant pool here? Any planned neighborhood developments (good or bad) we should know about?
- What's the average days-on-market for RENTAL listings here right now (not sales)? A rising rental-DOM trend means longer vacancies and softer asking-rent achievability than the comps imply.
- What's the recent tenant-quality profile in this submarket — average credit score on applications, eviction rate, late-payment / NSF rate, and stable-employment percentage? A property-management company in the area should have these aggregated.
- How much new apartment / multifamily construction is in the pipeline within 1–3 miles? Heavy new supply (>2% of stock underway) typically softens rents 12–24 months out; light construction supports rent growth.
Investment metrics
- 1% rule
- 1.03% ✓
- Cap rate
- 6.03%
- Cash-on-cash
- -0.93%
- DSCR
- 0.96
- GRM
- 8.1
CMA / ARV
No comps found within radius.
Projected returns pro-forma
-3.0% appreciation · 4.22% rent growth · sell at horizon
- IRR
- -16.1%
- Equity multiple
- 0.42×
- Total profit
- $-22,682
- Equity at exit
- $20,874
- IRR
- -5.2%
- Equity multiple
- 0.64×
- Total profit
- $-14,105
- Equity at exit
- $12,105
Cash invested: $39,200 (down + closing). Projections, not guarantees.
Landlord ↔ Tenant lean methodology
- Overall (STATE)
- 83 Strongly Landlord-Friendly
- State Kentucky
- 83 Strongly Landlord-Friendly · R+16
- County
- — inherits STATE
- City
- — inherits STATE
ZIP-level market 41018
- Rents YoY
- 4.2%
- Active inventory
- 124
- Price-to-rent
- 8.1×
Monthly cashflow live
- Estimated rent
- $1,443 high interval (Pro) →
- Mortgage (P&I)
- −$734
- Tax from tax record
- −$87 /mo · $1,045/yr
- Insurance
- −$58
- HOA
- −$291
- Vacancy / Maint / Mgmt
- −$303
- Net cashflow
- $-30
Break-even live
Sensitivity live
| Price | -10% $49 | -5% $9 | +0% $-30 | +5% $-70 | +10% $-110 |
|---|---|---|---|---|---|
| Rent | -10% $-144 | -5% $-87 | +0% $-30 | +5% $27 | +10% $84 |
| Rate | -1.0pp $40 | -0.5pp $5 | base $-30 | +0.5pp $-67 | +1.0pp $-104 |
UW: 25.0% down · 7.5% · 30yr · 1.5% tax · 5.0% vac · 8.0% maint · 8.0% mgmt
Financing live
Cash to close
- Down payment
- $35,000
- Closing costs
- $4,200
- Reserves months
- —
- Total cash needed
- —
Loan-product check · same deal, 3 products live
Conventional
25% down · 7.5% · 30yr
- Down + closing
- —
- Monthly P&I
- —
- Monthly cashflow
- —
- DSCR
- —
- Eligible?
- —
Personal DTI + credit; lowest rate.
DSCR
20% down · 8.5% · 30yr
- Down + closing
- —
- Monthly P&I
- —
- Monthly cashflow
- —
- DSCR
- —
- Eligible?
- —
No personal income docs; deal must DSCR.
Hard money
10% down · 12.0% · 12mo
- Down + closing
- —
- Monthly P&I
- —
- Monthly cashflow
- —
- DSCR
- —
- Eligible?
- —
Short-term bridge; refi at stabilization.
Rent comps 22 comps
| Address | Beds | Baths | Sqft | Rent | $/sqft | DOM | Units | Dist |
|---|---|---|---|---|---|---|---|---|
| 159 Green River Dr Erlanger, KY | 2.0 | 2.0 | 1278 | $1,595 | $1.25 | 3d | 1 | 0.11mi |
| 7222 Isaac Ln Florence, KY | 3.0 | 2.0 | 1400 | $1,795 | $1.28 | 18d | 1 | 0.40mi |
| 3904 Lori Dr Erlanger, KY | 1.0–2.0 | 1.0–1.5 | 722 | $1,335 | $1.85 | 3d | 12 | 0.68mi |
| 6805 Sebree Dr Florence, KY | 1.0–3.0 | 1.0–1.5 | 901 | $1,404 | $1.56 | 3d | 14 | 0.71mi |
| 9 Eagle Dr Elsmere, KY | 3.0 | 2.0 | 960 | $1,328 | $1.38 | 25d | 1 | 0.85mi |
| 868 Virginiabradford Ct Elsmere, KY | 3.0 | 2.5 | 974 | $3,500 | $3.59 | 3d | 1 | 0.88mi |
| 43 Banklick St Florence, KY | 2.0 | 2.0 | 1265 | $1,355 | $1.07 | 4d | 3 | 0.88mi |
| 109 Dove Dr Elsmere, KY | 3.0 | 2.0 | 960 | $1,328 | $1.38 | 3d | 1 | 0.90mi |
| 129 Dove Dr Elsmere, KY | 2.0 | 1.0 | 784 | $1,070 | $1.36 | 20d | 1 | 0.97mi |
| 64 Eagle Dr Elsmere, KY | 3.0 | 2.0 | 960 | $1,328 | $1.38 | 9d | 1 | 0.98mi |
| 6827 Shenandoah Dr Florence, KY | 1.0 | 1.0 | 750 | $988 | $1.32 | 3d | 5 | 1.00mi |
| 104 Dove Dr Elsmere, KY | 3.0 | 2.0 | 924 | $1,295 | $1.40 | 16d | 1 | 1.01mi |
| 3422 Cintonya Dr Erlanger, KY | 1.0–2.0 | 1.0 | 625 | $1,359 | $2.17 | 3d | 8 | 1.03mi |
| 4787 Houston Rd Florence, KY | 1.0–3.0 | 1.0–2.0 | 1025 | $1,908 | $1.86 | 3d | 25 | 1.14mi |
| 580 Erlanger Rd Unit 580-5 Erlanger, KY | 2.0 | 1.5 | 883 | $1,475 | $1.67 | 45d | 1 | 1.27mi |
| 3235 N Talbot Ave Unit 3235-2 Erlanger, KY | 3.0 | 1.5 | 1032 | $1,675 | $1.62 | 18d | 1 | 1.27mi |
| 3231 N Talbot Ave Unit 3231-5 Erlanger, KY | 2.0 | 1.5 | 883 | $1,475 | $1.67 | 25d | 1 | 1.31mi |
| 3234 N Talbot Ave Unit 3234-5 Erlanger, KY | 2.0 | 1.5 | 883 | $1,475 | $1.67 | 16d | 1 | 1.32mi |
| 535 Greenfield Ln Erlanger, KY | 2.0 | 1.0 | 756 | $1,300 | $1.72 | 3d | 5 | 1.35mi |
| 3223 N Talbot Ave Unit 3223-7 Erlanger, KY | 2.0 | 1.5 | 883 | $1,475 | $1.67 | 23d | 1 | 1.38mi |
| 3610 Concord Dr Erlanger, KY | 3.0 | 1.5 | 1064 | $1,700 | $1.60 | 45d | 1 | 1.38mi |
| 3219 N Talbot Ave Unit 3219-4 Erlanger, KY | 2.0 | 1.5 | 883 | $1,475 | $1.67 | 45d | 1 | 1.42mi |
HOA detail condo
- Monthly dues
- $291 · $3,492/yr
- Assessments
- None detected in remarks — confirm with the listing agent.
Listing history 12 events
-
2026-06-17status $140,000 Pending 5 DOM
-
2026-06-16days on market $140,000 Active 5 DOM
-
2026-06-15days on market $140,000 Active 4 DOM
-
2026-06-13status $140,000 Active 2 DOM
-
2026-05-15status Pending
-
2026-05-13$140,000 Active
-
2009-12-04soldstatus $89,000
-
2009-11-30soldstatus $89,000 195-char remark
Show marketing remark (195 chars)
Exquisite Condo! If you are wanting to avoid steps, you must consider this first. The elevator is across the hall from your entrance and your garage is directly across from the building entrance.
-
2009-09-14$95,000 195-char remark
Show marketing remark (195 chars)
Exquisite Condo! If you are wanting to avoid steps, you must consider this first. The elevator is across the hall from your entrance and your garage is directly across from the building entrance.
-
2009-07-31historical
-
2008-11-17$104,900
-
1995-12-08soldstatus $74,500
ⓘ Source: listings_history table (triggers on properties + properties_extension) + one-shot
backfill from property_details.listing_events for pre-trigger history.
Tax reassessment forecast KY · Resets to sale price
- Current annual tax
- $1,045 · $87/mo
- Projected year-2 tax
- $1,204 · $100/mo
- Expected delta
- +$159/yr (+$13/mo · 15.3%)
ⓘ Screening estimate from a state-policy table — verify with the county assessor before closing.
Climate risk First Street
- Flood 1/10 Low FEMA zone X (unshaded) · 0% chance over 30 yrs
- Wildfire 1/10 Low
- Heat 4/10 Moderate 7 d/yr ≥101°F today · 19 d/yr by 30 yrs out
- Wind 2/10 Low 100% chance of damaging wind over 30 yrs
- Air quality 2/10 Low 1 unhealthy d/yr today · 3 by 30 yrs out
Nearby sold comps map
Loading sold comps map…
Walkable amenities ~0.75 mi
Loading nearby amenities…
Taxation est. · year 1
- Rental income
- $17,319
- − Mortgage interest
- −$7,842
- − Property taxes
- −$1,045
- − Insurance
- −$700
- − Repairs & maintenance
- −$1,386
- − Management
- −$1,386
- − HOA
- −$3,492
- − Depreciation
- −$4,073
- Taxable loss
- −$2,604
- Est. tax savings @ 24.0%
- +$625
- After-tax cash flow
- $260/yr
For passive investors: Depreciation is non-cash, so a rental often shows a tax loss while cash-flowing — sheltering income. Rental losses are passive: they offset passive income freely, and up to $25,000/yr can offset ordinary (W-2) income if you actively participate and your MAGI is under $100k (phasing out to $0 by $150k); unused losses carry forward. On sale, claimed depreciation is recaptured at up to 25%, and gains may owe capital-gains tax (a 1031 exchange can defer both). Figures are a year-1 estimate at your 24.0% rate — not tax advice; consult a CPA.
Schools (NCES district)
- District
- Erlanger-Elsmere Independent
- NCES district ID
- 2101740
- Math proficiency
- 21% ▼ -10.00%
- Reading proficiency
- 32% ▼ -11.00%
- Median HH income
- $47,377
- Composite
- 23.01/100
- National rank
- #7975
- State rank
- #128 of 165 in KY
Livability — Erlanger
- Score
- 72/100
- State rank
- #126
- US rank
- #5933
Category grades
Schools grade is shown separately in the Schools card above.
Census & demographics
- Census place
- Erlanger, KY
- County
- Kenton County · 142,881 people
- City population
- 28,940
- Metro
- Cincinnati, OH-KY-IN
- Population (ZIP)
- 28,940
- Household income
- $68,605
- Rent vs Own
- Severe rent burden
- 678.0
Population outlook (Kenton County) Hauer SSP2
- Today (2025)
- 174,205 people
- By 2030
- 177,897 · +2.1%
- By 2040
- 182,671 · +4.9%
- By 2050
- 183,543 · +5.4%
- By 2075
- 178,977 · +2.7%
- By 2100
- 159,920 · -8.2%
Race, ethnicity, and origin ACS 2023
- Neighborhood character
- Predominantly White (83%)
- Race & ethnicity
- White 83% Two or more races 7% Hispanic / Latino 5% Black 5% Asian 1%
- Hispanic origin (detail)
- Mexican 3%
- Common ancestry
- Slovak 3% Italian 2% Lithuanian 1%
- Foreign-born
- 4% · Canada, Vietnam
- Languages at home
- 94% English-only · Spanish 4%
Political lean MEDSL · Kenton
- 2024 margin
- Strong R (+21.7) · D 38.2% · R 59.9% · Other 1.9%
- 2008→2024 swing
- -0.9pp no change · 2008: -20.9pp · 2024: -21.7pp
- All cycles
- 2024: R+21.7 2020: R+19.3 2016: R+26.1 2012: R+24.3 2008: R+20.9
Not yet ingested
- Civics
- —
Market trends
- HPI YoY
- ▼ -211.57%
- Current HPI
- 215.9599
- Rent YoY
- ▲ 4.22%
- Metro
- Cincinnati, OH-KY-IN
- State GDP YoY
- ▲ 1.81%
- F500 in state
- 4
Industry mix (Fortune 500 HQ in KY)
| Industry | F500 HQs | Revenue |
|---|---|---|
| Healthcare | 1 | $118B |
|
||
| Food / Beverage | 1 | $7B |
|
||
Price history
+87.9% since first listed8 events — show timeline
- 2026-05-15 Pending — NKMLS
- 2026-05-13 Listed $140,000 NKMLS
- 2009-12-04 Sold (Public Records) $89,000 Public Records
- 2009-11-30 Sold (MLS) $89,000 NKMLS
- 2009-09-14 Listed $95,000 NKMLS
- 2009-07-31 Listing Removed — NKMLS
- 2008-11-17 Listed $104,900 NKMLS
- 1995-12-08 Sold (Public Records) $74,500 Public Records
Property tax history
-0.1%/yrLatest (2025): $1,045 · -4.4% YoY. Source: county tax records.
Cash-flow waterfall
monthlySold comps — $/sqft
last 12 mo · ≤1 miLoading sold comps…