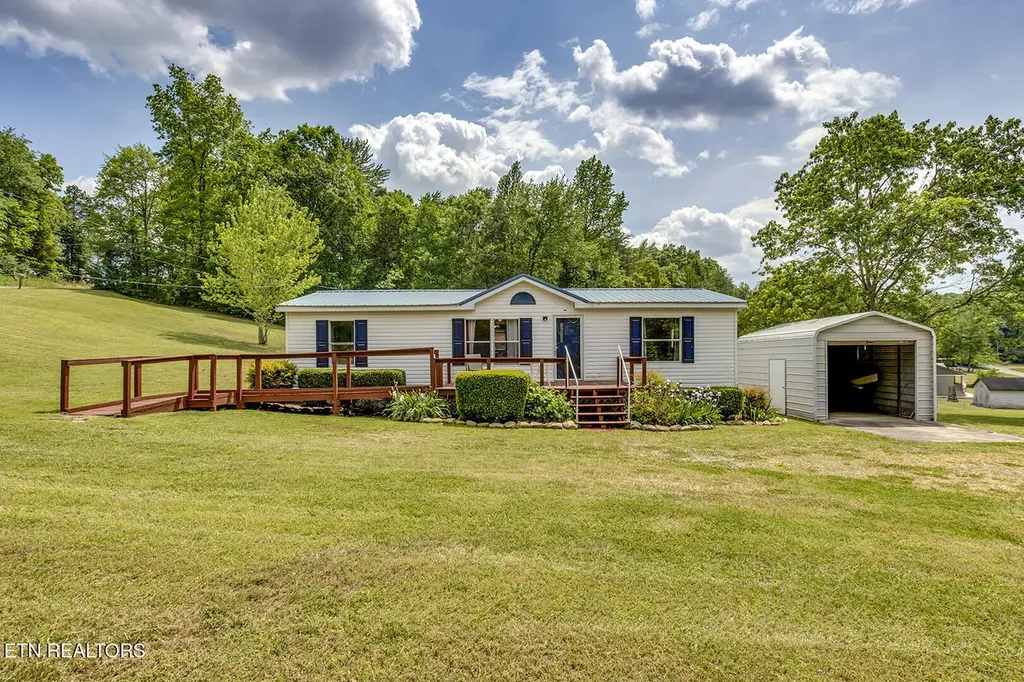
1725 Euchee Rd · Spring City, TN
Flood risk 1/10 · Minimal
- FEMA flood zone
- X (unshaded)
- Chance of flooding over 30 yrs
- 0.0%
- Est. flood insurance / yr
- $507 – $1,088
Fire risk 6/10 · Moderate
- Est. fire insurance / yr
- $949 – $1,763
Heat risk 5/10 · Moderate
- Hot days now (above 105°F)
- 7 days/yr
- Hot days in 30 yrs
- 20 days/yr
Wind risk 2/10 · Minimal
- Chance of severe wind over 30 yrs
- 3.0%
Air-quality risk 3/10 · Minor
- Unhealthy air days now
- 2 days/yr
- Unhealthy air days in 30 yrs
- 3 days/yr
Risk factors via First Street. Map © Google.
Why this score? — see what drove the D grade
The composite is a weighted blend of 9 inputs, each scored 0–100. Each bar is that input's sub-score; the figure is the points it added to the 100-point composite (weight × sub-score).
- Cash flow +10.7/30.0
- Appreciation +10.0/10.0
- ARV discount +7.5/15.0
- Livability +3.5/5.0
- 1% rule +3.2/10.0
- DSCR +3.1/10.0
- Rent growth +2.5/5.0
- Condition / age +2.5/5.0
- Schools +1.6/10.0
$229,000
🖨 Deal sheet 📄 Offer letter ✓ Due diligence
Listing remarks
Discover the charm of this inviting 3-bedroom, 2-bathroom home in Ten Mile--a scenic area well-known for its exceptional water recreation and relaxed lifestyle. Whether you're searching for a starter home or a smart investment opportunity, this property offers the perfect blend of comfort and location. Situated just minutes from Euchee Marina, you'll enjoy easy access to Watts Bar Lake, a hotspot for boating, fishing, and year-round outdoor activities. Nearby, a public recreation area maintained by the Tennessee Valley Authority features a boat ramp, swimming area, playground, walking track, and picnic spots--all available at no cost. Inside, the home offers a spacious master suite complete
Key facts
- Swimming area
- Walking track
- Picnic spots
Tags
Property features AI
Exterior
- Parking: Off-street parking; Detached parking structure
- Utilities: Septic tank
- Home design: Detached property; 960 building area (per tax records)
- Construction: Aluminum siding; Metal siding; Frame construction
- Exterior features: Corner lot; Level lot; Country setting views
Interior
- Kitchen: Dishwasher; Refrigerator; Eat-in kitchen
- Flooring: Vinyl flooring
- Bathrooms: 2 full bathrooms
- Heating & cooling: Central heating (heat pump, electric); Central cooling
- Interior features: Walk-in closet(s); Cathedral ceiling(s); Eat-in kitchen; 7 total rooms
Neighborhood map
What this means for you Summary
Snapshot
- This is a 3-bed/2.0-bath manufactured listed at $229k.
Deal economics
- At list price, monthly cash flow is $-108 ($-1k/yr) — negative.
- To cash-flow at today's rent, offer at most $213k (6.8% below list).
- To meet the 1% rule (rent ≥ 1% of price), the offer needs to be $187k (18.5% below list).
- Recommended offer: $187k (18.5% below list) — sets the bar for 1% rule.
- Cap rate 5.7% vs local median 1.8% in Spring City — top-decile yield for the area; either an underpriced asset or a hidden risk that comps aren't pricing in. Stress-test before assuming the spread holds.
Location & tenants
- Location reads 70/100 on livability (#50 in TN) — a middle-class / working-renter tenant base. Strengths: crime A+, cost of living A+, housing A+; Watch: health & safety C-, amenities F, commute F.
- Meigs County (rural): math 16% / reading 22% proficiency, ranked #122 of 139 in TN (top 88%) — low school quality limits family demand, transient renter base, plan for 1-2y turnover.
- Zoned schools: Meigs North Elementary (math 17% / reading 22%, grade F, #654 of 952 statewide, top 72%, 434 students, 0% FRL); Meigs Middle School (math 19% / reading 21%, grade F, #198 of 333 statewide, top 61%, 390 students, 0% FRL); Meigs County High School (math 12% / reading 22%, grade F, #225 of 332 statewide, top 69%, 538 students, 0% FRL) — zoned schools average 0% FRL vs 57% district-wide (57 pts lower); this property's tenant base skews higher-income than the district average.
- Market conditions: 105 active listings in the ZIP; 94 units permitted in Meigs County in 2024 (0 in 5+ unit buildings).
Forward outlook
- In year one you build about $24k of equity ($2k loan paydown + $23k appreciation (10.0% local appreciation)).
- Meigs County population projected to shrink 8% by 2050 — rents likely to lag national; underwrite the cash flow, not the appreciation.
- By year 2, paydown + projected appreciation supports a ~$39k cash-out refi (75% LTV) — recoverable capital for the next deal without selling this one.
Negotiation context
- It's been on market 50 days — a 3% lower offer ($222k) is reasonable based on typical stale-listing flexibility.
- Current owner paid $37k; list at $229k implies a 519% gain — meaningful room to come down on a strong offer.
Risks & watch-outs
- Climate carrying-cost: major wildfire risk; extreme-heat days projected 7→20/yr by 2055 (HVAC capex compounding) — expect insurance premiums to compound above CPI over the hold.
Questions for the listing agent
- What do current leases actually rent for vs. the listed asking? Can we see a recent rent roll and the last 12 months of T-12 income?
- It's been on market 50 days. Have you received any prior offers? Is the seller open to a 18% concession, seller financing, or rate buy-down credit?
- Is there a deadline driving the sale (1031 exchange, divorce, estate, relocation)? That informs how much negotiation room exists.
- Schools are F-rated, which usually means shorter tenancies and higher turnover. Who's the typical renter profile here, and what's been the actual vacancy rate?
- The area grade is low — what's the realistic commute time and amenity access for the typical tenant pool here? Any planned neighborhood developments (good or bad) we should know about?
- What's the average days-on-market for RENTAL listings here right now (not sales)? A rising rental-DOM trend means longer vacancies and softer asking-rent achievability than the comps imply.
- What's the recent tenant-quality profile in this submarket — average credit score on applications, eviction rate, late-payment / NSF rate, and stable-employment percentage? A property-management company in the area should have these aggregated.
- How much new for-sale + rental construction is in the pipeline within 1–3 miles? Heavy new supply typically softens prices + rents 12–24 months out; constrained supply supports both.
Investment metrics
- 1% rule
- 0.82% ✗
- Cap rate
- 5.73%
- Cash-on-cash
- -2.02%
- DSCR
- 0.91
- GRM
- 10.2
CMA / ARV
No comps found within radius.
Projected returns pro-forma
10.0% appreciation · 3.0% rent growth · sell at horizon
- IRR
- 22.8%
- Equity multiple
- 2.84×
- Total profit
- $117,867
- Equity at exit
- $206,301
- IRR
- 20.4%
- Equity multiple
- 6.50×
- Total profit
- $352,566
- Equity at exit
- $444,897
Cash invested: $64,120 (down + closing). Projections, not guarantees.
Landlord ↔ Tenant lean methodology
- Overall (STATE)
- 87 Strongly Landlord-Friendly
- State Tennessee
- 87 Strongly Landlord-Friendly · R+13
- County
- — inherits STATE
- City
- — inherits STATE
ZIP-level market 37880
- Home prices YoY
- 14.8%
- Active inventory
- 105
- Price-to-rent
- 10.2×
Monthly cashflow live
- Estimated rent
- $1,866 medium interval (Pro) →
- Mortgage (P&I)
- −$1,201
- Tax est. 1.5%
- −$286 /mo · $3,435/yr
- Insurance
- −$95
- HOA
- −$0
- Vacancy / Maint / Mgmt
- −$392
- Net cashflow
- $-108
Break-even live
UW: 25.0% down · 7.5% · 30yr · 1.5% tax · 5.0% vac · 8.0% maint · 8.0% mgmt
Financing live
Cash to close
- Down payment
- $57,250
- Closing costs
- $6,870
- Reserves months
- —
- Total cash needed
- —
Loan-product check · same deal, 3 products live
Conventional
25% down · 7.5% · 30yr
- Down + closing
- —
- Monthly P&I
- —
- Monthly cashflow
- —
- DSCR
- —
- Eligible?
- —
Personal DTI + credit; lowest rate.
DSCR
20% down · 8.5% · 30yr
- Down + closing
- —
- Monthly P&I
- —
- Monthly cashflow
- —
- DSCR
- —
- Eligible?
- —
No personal income docs; deal must DSCR.
Hard money
10% down · 12.0% · 12mo
- Down + closing
- —
- Monthly P&I
- —
- Monthly cashflow
- —
- DSCR
- —
- Eligible?
- —
Short-term bridge; refi at stabilization.
Listing history 19 events
-
2026-06-19days on market $229,000 Active 50 DOM
-
2026-06-18days on market $229,000 Active 49 DOM
-
2026-06-17days on market $229,000 Active 48 DOM
-
2026-06-16days on market $229,000 Active 47 DOM
-
2026-06-15days on market $229,000 Active 46 DOM
-
2026-06-14days on market $229,000 Active 44 DOM
-
2026-06-12days on market $229,000 Active 43 DOM
-
2026-06-09days on market $229,000 Active 40 DOM
-
2026-06-08days on market $229,000 Active 39 DOM
-
2026-06-07days on market $229,000 Active 38 DOM
-
2026-06-07days on market $229,000 Active 37 DOM
-
2026-06-03days on market $229,000 Active 34 DOM
-
2026-06-02days on market $229,000 Active 33 DOM
-
2026-06-01days on market $229,000 Active 32 DOM
-
2026-05-31days on market $229,000 Active 31 DOM
-
2026-05-30days on market $229,000 Active 30 DOM
-
2026-04-30$229,000 Active 1362-char remark
-
2004-09-30soldstatus $37,000
-
2003-07-30soldstatus $22,000
ⓘ Source: listings_history table (triggers on properties + properties_extension) + one-shot
backfill from property_details.listing_events for pre-trigger history.
Climate risk First Street
- Flood 1/10 Low FEMA zone X (unshaded) · 0% chance over 30 yrs
- Wildfire 6/10 Major
- Heat 5/10 Major 7 d/yr ≥105°F today · 20 d/yr by 30 yrs out
- Wind 2/10 Low 3% chance of damaging wind over 30 yrs
- Air quality 3/10 Moderate 2 unhealthy d/yr today · 3 by 30 yrs out
Nearby sold comps map
Loading sold comps map…
Walkable amenities ~0.75 mi
Loading nearby amenities…
Taxation est. · year 1
- Rental income
- $22,398
- − Mortgage interest
- −$12,828
- − Property taxes
- −$3,435
- − Insurance
- −$1,145
- − Repairs & maintenance
- −$1,792
- − Management
- −$1,792
- − Depreciation
- −$6,662
- Taxable loss
- −$5,255
- Est. tax savings @ 24.0%
- +$1,261
- After-tax cash flow
- $-35/yr
For passive investors: Depreciation is non-cash, so a rental often shows a tax loss while cash-flowing — sheltering income. Rental losses are passive: they offset passive income freely, and up to $25,000/yr can offset ordinary (W-2) income if you actively participate and your MAGI is under $100k (phasing out to $0 by $150k); unused losses carry forward. On sale, claimed depreciation is recaptured at up to 25%, and gains may owe capital-gains tax (a 1031 exchange can defer both). Figures are a year-1 estimate at your 24.0% rate — not tax advice; consult a CPA.
Schools (NCES district)
- District
- Meigs County
- NCES district ID
- 4702910
- Math proficiency
- 16% ▼ -18.00%
- Reading proficiency
- 22% ▼ -10.00%
- Median HH income
- $36,129
- Composite
- 15.74/100
- National rank
- #9278
- State rank
- #122 of 139 in TN
Livability — Spring City
- Score
- 70/100
- State rank
- #50
- US rank
- #7492
Category grades
Schools grade is shown separately in the Schools card above.
Census & demographics
- Population (ZIP)
- 3,934
Population outlook (Meigs County) Hauer SSP2
- Today (2025)
- 11,953 people
- By 2030
- 11,878 · -0.6%
- By 2040
- 11,514 · -3.7%
- By 2050
- 10,946 · -8.4%
- By 2075
- 9,639 · -19.4%
- By 2100
- 8,171 · -31.6%
Race, ethnicity, and origin ACS 2023
- Neighborhood character
- Predominantly White (86%)
- Race & ethnicity
- White 86% Two or more races 11% Hispanic / Latino 6% Asian 2%
- Hispanic origin (detail)
- Mexican 5%
- Common ancestry
- Serbian 6% Romanian 3% Lithuanian 2%
- Foreign-born
- 3% · Canada
- Languages at home
- 99% English-only · Spanish 1%
Political lean MEDSL · Meigs
- 2024 margin
- Solid R (+67.5) · D 15.9% · R 83.4%
- 2008→2024 swing
- -33.9pp toward R · 2008: -33.6pp · 2024: -67.5pp
- All cycles
- 2024: R+67.5 2020: R+62.5 2016: R+57.5 2012: R+39.5 2008: R+33.6
Not yet ingested
- Civics
- —
Market trends
- HPI YoY
- ▲ 43.20%
- Current HPI
- 335.0341
- Rent YoY
- —
- Metro
- —
- State GDP YoY
- ▲ 2.78%
- F500 in state
- 22
Industry mix (Fortune 500 HQ in TN)
| Industry | F500 HQs | Revenue |
|---|---|---|
| Healthcare | 3 | $91B |
|
||
| Retail | 3 | $72B |
|
||
| Transportation / Logistics | 1 | $88B |
|
||
| Paper / Packaging | 1 | $19B |
|
||
| Insurance | 1 | $13B |
|
||
| Energy | 1 | $12B |
|
||
Price history
+940.9% since first listed3 events — show timeline
- 2026-04-30 Listed $229,000 Knoxville MLS
- 2004-09-30 Sold (Public Records) $37,000 Public Records
- 2003-07-30 Sold (Public Records) $22,000 Public Records
Property tax history
-0.9%/yrLatest (2025): $119 · +0.0% YoY. Source: county tax records.
Cash-flow waterfall
monthlySold comps — $/sqft
last 12 mo · ≤1 miLoading sold comps…