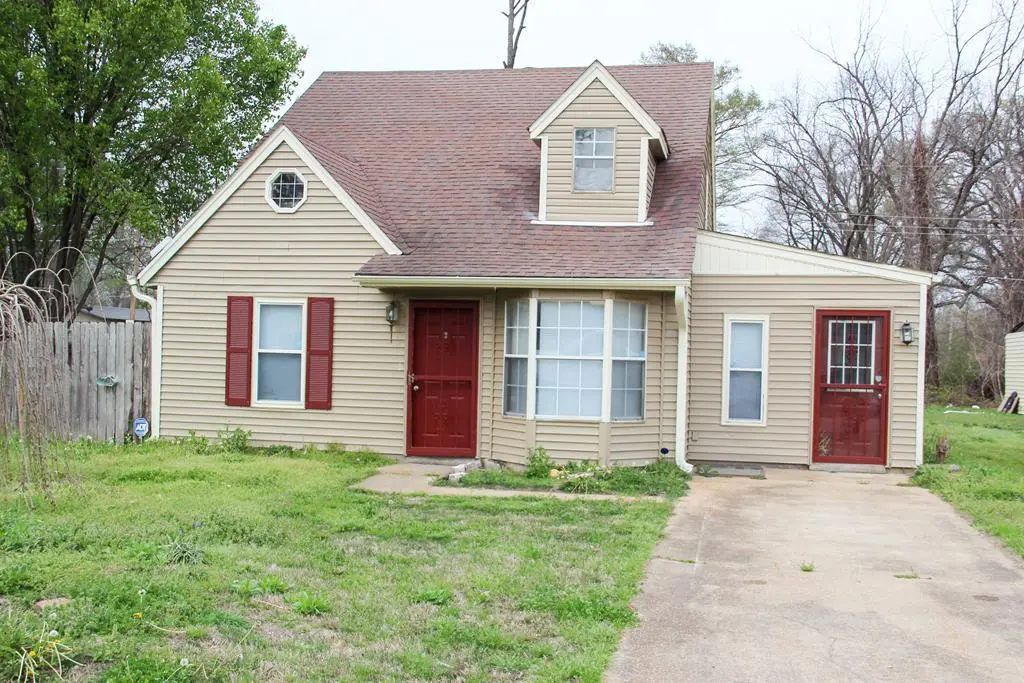
84 Willow Dr · Marion, AR
Flood risk 1/10 · Minimal
- FEMA flood zone
- X (shaded)
- Chance of flooding over 30 yrs
- 0.0%
- Est. flood insurance / yr
- $507 – $1,088
Fire risk 1/10 · Minimal
- Est. fire insurance / yr
- $1,499 – $2,785
Heat risk 6/10 · Moderate
- Hot days now (above 109°F)
- 7 days/yr
- Hot days in 30 yrs
- 21 days/yr
Wind risk 4/10 · Minor
- Chance of severe wind over 30 yrs
- 16.0%
Air-quality risk 2/10 · Minimal
- Unhealthy air days now
- 2 days/yr
- Unhealthy air days in 30 yrs
- 2 days/yr
Risk factors via First Street. Map © Google.
Why this score? — see what drove the D+ grade
The composite is a weighted blend of 9 inputs, each scored 0–100. Each bar is that input's sub-score; the figure is the points it added to the 100-point composite (weight × sub-score).
- Cash flow +15.6/30.0
- ARV discount +15.0/15.0
- DSCR +4.8/10.0
- Livability +3.2/5.0
- 1% rule +3.1/10.0
- Rent growth +2.5/5.0
- Condition / age +2.5/5.0
- Schools +2.1/10.0
- Appreciation +0.0/10.0
$150,000
🖨 Deal sheet (PDF) 📄 Offer letter ✓ Due diligence
Listing remarks
Move-in ready corner-lot home in a super convenient location in Marion, AR! This 3-bedroom home with a versatile loft offers flexible space perfect for a playroom or second living area. Enjoy extra yard space, added privacy, and a bright, layout that feels welcoming from the moment you walk in. The home features plenty of natural light and functional living areas designed for everyday comfort. Just minutes from shopping, dining, schools, and quick highway access. Bonus: the home still features its original turn-style doorbell, adding a touch of unique character you won't find everywhere. Don't miss this great combination of location, space, and convenience!
Key facts
- Built 1984
- Listed 10 days
Neighborhood map
What this means for you Summary
Snapshot
- This is a 3-bed/2.0-bath single-family listed at $150k.
Deal economics
- At list price, monthly cash flow is $64 ($763/yr) — positive.
- The deal already cash-flows at list — no discount required.
- To meet the 1% rule (rent ≥ 1% of price), the offer needs to be $122k (18.5% below list).
- Recommended offer: $122k (18.5% below list) — sets the bar for 1% rule.
- Cap rate 6.8% vs local median 3.8% in Marion — top-decile yield for the area; either an underpriced asset or a hidden risk that comps aren't pricing in. Stress-test before assuming the spread holds.
Location & tenants
- Location reads 65/100 on livability (#147 in AR) — a middle-class / working-renter tenant base. Strengths: cost of living A+, housing A+, employment A-; Watch: crime F, amenities F, commute F.
- Marion School District (suburban): math 21% / reading 26% proficiency, ranked #185 of 238 in AR (top 78%) — low school quality limits family demand, transient renter base, plan for 1-2y turnover.
- Zoned schools: Herbert Carter Global Community Magnet School (math 33% / reading 33%, grade F, #274 of 454 statewide, top 61%, 636 students, 58% FRL); Marion Junior High School (math 19% / reading 29%, grade F, #170 of 201 statewide, top 86%, 970 students, 75% FRL); Marion High School (math 10% / reading 27%, grade F, #251 of 292 statewide, top 86%, 850 students, 77% FRL) — zoned schools average 70% FRL vs 52% district-wide (18 pts higher); higher-poverty schools than district average — tighter screening recommended.
- Market conditions: 110 active listings in the ZIP; 4 comparable units currently listed for rent nearby; rentals at typical pace (median 26d on market — plan ~3-4 weeks tenant-placement turnaround); 69 units permitted in Crittenden County in 2024 (0 in 5+ unit buildings).
Forward outlook
- Local home prices are declining (-3.0%/yr); year-one equity from $1k of loan paydown is wiped out by about $4k of value loss. Plan a longer hold.
- Crittenden County population projected at -26% by 2050 — secular population decline; favor cash flow + early exit over multi-decade hold.
Negotiation context
- Only 10 days on market — expect competitive offers; lowballing is unlikely to land.
- Current owner paid $69k; list at $150k implies a 117% gain — meaningful room to come down on a strong offer.
Risks & watch-outs
- Climate carrying-cost: extreme-heat days projected 7→21/yr by 2055 (HVAC capex compounding) — expect insurance premiums to compound above CPI over the hold.
Questions for the listing agent
- Is there a deadline driving the sale (1031 exchange, divorce, estate, relocation)? That informs how much negotiation room exists.
- Schools are D-rated, which usually means shorter tenancies and higher turnover. Who's the typical renter profile here, and what's been the actual vacancy rate?
- Crime grade is F in this area — have there been break-ins, vandalism, or insurance claims at this property in the last 3 years? What carrier currently insures it and at what premium?
- The area grade is low — what's the realistic commute time and amenity access for the typical tenant pool here? Any planned neighborhood developments (good or bad) we should know about?
- What's the average days-on-market for RENTAL listings here right now (not sales)? A rising rental-DOM trend means longer vacancies and softer asking-rent achievability than the comps imply.
- What's the recent tenant-quality profile in this submarket — average credit score on applications, eviction rate, late-payment / NSF rate, and stable-employment percentage? A property-management company in the area should have these aggregated.
- How much new for-sale + rental construction is in the pipeline within 1–3 miles? Heavy new supply typically softens prices + rents 12–24 months out; constrained supply supports both.
Investment metrics
- 1% rule
- 0.81% ✗
- Cap rate
- 6.80%
- Cash-on-cash
- 1.82%
- DSCR
- 1.08
- GRM
- 10.2
CMA / ARV
- ARV (on-the-fly)
- $197,860
- Comps found
- 11
Show comp detail 11 sales within ~0.75 mi
| Address | Dist | Beds/Ba | Sqft | Sold | Price | $/sf | Match |
|---|---|---|---|---|---|---|---|
| 112 Lori Ln | 0.19mi | 3/2.0 | 1,414 (-7%) | 2mo | $65,000 | $46 | 77 |
| 279 Shiloh Dr | 0.63mi | 3/2.0 | 1,567 (+3%) | 13mo | $160,000 | $102 | 55 |
| 393 L P Mann Dr | 0.72mi | 3/2.0 | 1,518 (-0%) | 15mo | $213,000 | $140 | 53 |
| 218 Oak St | 0.55mi | 4/1.5 (+1) | 1,413 (-7%) | 6mo | $194,500 | $138 | 50 |
| 365 Belle Meade Cv | 0.63mi | 3/2.0 | 1,406 (-8%) | 10mo | $135,000 | $96 | 50 |
| 83 Masbend Cv | 0.73mi | 3/2.0 | 1,594 (+5%) | 11mo | $208,000 | $130 | 48 |
| 292 Shiloh Dr | 0.67mi | 3/2.5 | 1,668 (+10%) | 4mo | $117,000 | $70 | 48 |
| 130 Barton Cv | 0.74mi | 4/2.0 (+1) | 1,456 (-4%) | 7mo | $203,000 | $139 | 48 |
| 205 Shiloh Dr | 0.58mi | 3/2.0 | 1,644 (+8%) | 15mo | $238,380 | $145 | 48 |
| 383 Park St | 0.72mi | 3/2.0 | 1,487 (-2%) | 20mo | $211,000 | $142 | 46 |
| 348 Redwood Cv | 0.72mi | 4/1.0 (+1) | 1,400 (-8%) | 11mo | $174,900 | $125 | 34 |
Match score weights: distance 35% · size 25% · config 20% · recency 20%. Top-matched comps best support the ARV.
Projected returns pro-forma
-3.0% appreciation · 3.0% rent growth · sell at horizon
- IRR
- -13.5%
- Equity multiple
- 0.52×
- Total profit
- $-20,321
- Equity at exit
- $22,365
- IRR
- -4.6%
- Equity multiple
- 0.70×
- Total profit
- $-12,741
- Equity at exit
- $12,969
Cash invested: $42,000 (down + closing). Projections, not guarantees.
Landlord ↔ Tenant lean methodology
- Overall (STATE)
- 92 Strongly Landlord-Friendly
- State Arkansas
- 92 Strongly Landlord-Friendly · R+14
- County
- — inherits STATE
- City
- — inherits STATE
ZIP-level market 72364
- Home prices YoY
- -13.3%
- Active inventory
- 110
- Price-to-rent
- 10.2×
Monthly cashflow live
- Estimated rent
- $1,222 medium interval (Pro) →
- Mortgage (P&I)
- −$787
- Tax from tax record
- −$53 /mo · $635/yr
- Insurance
- −$62
- HOA
- −$0
- Vacancy / Maint / Mgmt
- −$257
- Net cashflow
- $64
Break-even live
Sensitivity live
| Price | -10% $149 | -5% $106 | +0% $64 | +5% $21 | +10% $-21 |
|---|---|---|---|---|---|
| Rent | -10% $-33 | -5% $15 | +0% $64 | +5% $112 | +10% $160 |
| Rate | -1.0pp $139 | -0.5pp $102 | base $64 | +0.5pp $25 | +1.0pp $-15 |
UW: 25.0% down · 7.5% · 30yr · 1.5% tax · 5.0% vac · 8.0% maint · 8.0% mgmt
Financing live
Cash to close
- Down payment
- $37,500
- Closing costs
- $4,500
- Reserves months
- —
- Total cash needed
- —
Loan-product check · same deal, 3 products live
Conventional
25% down · 7.5% · 30yr
- Down + closing
- —
- Monthly P&I
- —
- Monthly cashflow
- —
- DSCR
- —
- Eligible?
- —
Personal DTI + credit; lowest rate.
DSCR
20% down · 8.5% · 30yr
- Down + closing
- —
- Monthly P&I
- —
- Monthly cashflow
- —
- DSCR
- —
- Eligible?
- —
No personal income docs; deal must DSCR.
Hard money
10% down · 12.0% · 12mo
- Down + closing
- —
- Monthly P&I
- —
- Monthly cashflow
- —
- DSCR
- —
- Eligible?
- —
Short-term bridge; refi at stabilization.
Rent comps 4 comps
| Address | Beds | Baths | Sqft | Rent | $/sqft | DOM | Units | Dist |
|---|---|---|---|---|---|---|---|---|
| 96 Willow St Marion, AR | 3.0 | 1.0 | 1248 | $1,050 | $0.84 | 45d | 1 | 0.06mi |
| 213 Randolph St Marion, AR | 3.0 | 2.0 | 1365 | $1,500 | $1.10 | 25d | 1 | 1.02mi |
| 243 Whispering Wind Cir Marion, AR | 3.0 | 2.0 | 1493 | $1,800 | $1.21 | 18d | 1 | 1.19mi |
| 1120 L H Polk St Marion, AR | 1.0–3.0 | 1.0–2.0 | 985 | $1,405 | $1.43 | 3d | 9 | 1.21mi |
Listing history 3 events
-
2026-04-20status Pending
-
2026-04-11$150,000 Active
-
1999-07-29soldstatus $69,000
ⓘ Source: listings_history table (triggers on properties + properties_extension) + one-shot
backfill from property_details.listing_events for pre-trigger history.
Tax reassessment forecast AR · Resets to sale price
- Current annual tax
- $635 · $53/mo
- Projected year-2 tax
- $960 · $80/mo
- Expected delta
- +$325/yr (+$27/mo · 51.3%)
ⓘ Screening estimate from a state-policy table — verify with the county assessor before closing.
Climate risk First Street
- Flood 1/10 Low FEMA zone X (shaded) · 0% chance over 30 yrs
- Wildfire 1/10 Low
- Heat 6/10 Major 7 d/yr ≥109°F today · 21 d/yr by 30 yrs out
- Wind 4/10 Moderate 16% chance of damaging wind over 30 yrs
- Air quality 2/10 Low 2 unhealthy d/yr today · 2 by 30 yrs out
Nearby sold comps map
Loading sold comps map…
Walkable amenities ~0.75 mi
Loading nearby amenities…
Taxation est. · year 1
- Rental income
- $14,667
- − Mortgage interest
- −$8,402
- − Property taxes
- −$635
- − Insurance
- −$750
- − Repairs & maintenance
- −$1,173
- − Management
- −$1,173
- − Depreciation
- −$4,364
- Taxable loss
- −$1,830
- Est. tax savings @ 24.0%
- +$439
- After-tax cash flow
- $1,202/yr
For passive investors: Depreciation is non-cash, so a rental often shows a tax loss while cash-flowing — sheltering income. Rental losses are passive: they offset passive income freely, and up to $25,000/yr can offset ordinary (W-2) income if you actively participate and your MAGI is under $100k (phasing out to $0 by $150k); unused losses carry forward. On sale, claimed depreciation is recaptured at up to 25%, and gains may owe capital-gains tax (a 1031 exchange can defer both). Figures are a year-1 estimate at your 24.0% rate — not tax advice; consult a CPA.
Schools (NCES district)
- District
- Marion School District
- NCES district ID
- 0509390
- Math proficiency
- 21% ▼ -8.00%
- Reading proficiency
- 26% ▼ -5.00%
- Median HH income
- $50,758
- Composite
- 20.88/100
- National rank
- #8492
- State rank
- #185 of 238 in AR
Livability — Marion
- Score
- 65/100
- State rank
- #147
- US rank
- #12733
Category grades
Schools grade is shown separately in the Schools card above.
Census & demographics
- Census place
- Marion, AR
- County
- Crittenden County · 16,034 people
- City population
- 16,034
- Metro
- Memphis, TN-MS-AR
- Population (ZIP)
- 16,034
- Household income
- $74,462
- Rent vs Own
- Severe rent burden
- 319.0
Population outlook (Crittenden County) Hauer SSP2
- Today (2025)
- 45,254 people
- By 2030
- 42,953 · -5.1%
- By 2040
- 38,235 · -15.5%
- By 2050
- 33,670 · -25.6%
- By 2075
- 24,315 · -46.3%
- By 2100
- 17,173 · -62.1%
Race, ethnicity, and origin ACS 2023
- Neighborhood character
- Diverse neighborhood (Simpson 0.61)
- Race & ethnicity
- White 51% Black 35% Two or more races 10% Hispanic / Latino 5% Asian 1%
- Common ancestry
- Italian 2% Romanian 1% Lithuanian 1%
- Foreign-born
- 3% · Canada, Dominican Republic
- Languages at home
- 96% English-only · Spanish 3% Korean 1%
Political lean MEDSL · Crittenden
- 2024 margin
- Toss-up / Even · D 50.1% · R 47.9% · Other 2.0%
- 2008→2024 swing
- -12.4pp toward R · 2008: 14.7pp · 2024: 2.3pp
- All cycles
- 2024: D+2.3 2020: D+7.2 2016: D+9.0 2012: D+18.7 2008: D+14.7
Not yet ingested
- Civics
- —
Market trends
- HPI YoY
- ▼ -31.64%
- Current HPI
- 205.4807
- Rent YoY
- —
- Metro
- Memphis, TN-MS-AR
- State GDP YoY
- ▲ 3.80%
- F500 in state
- 10
Industry mix (Fortune 500 HQ in AR)
| Industry | F500 HQs | Revenue |
|---|---|---|
| Retail | 1 | $681B |
|
||
| Food / Agriculture | 1 | $53B |
|
||
| Retail / Energy | 1 | $22B |
|
||
| Transportation / Logistics | 1 | $12B |
|
||
| Energy | 1 | $4B |
|
||
Price history
+117.4% since first listed3 events — show timeline
- 2026-04-20 Pending — EARA
- 2026-04-11 Listed $150,000 EARA
- 1999-07-29 Sold (Public Records) $69,000 Public Records
Property tax history
+4.9%/yrLatest (2025): $635 · +9.8% YoY. Source: county tax records.
Cash-flow waterfall
monthlySold comps — $/sqft
last 12 mo · ≤1 miLoading sold comps…