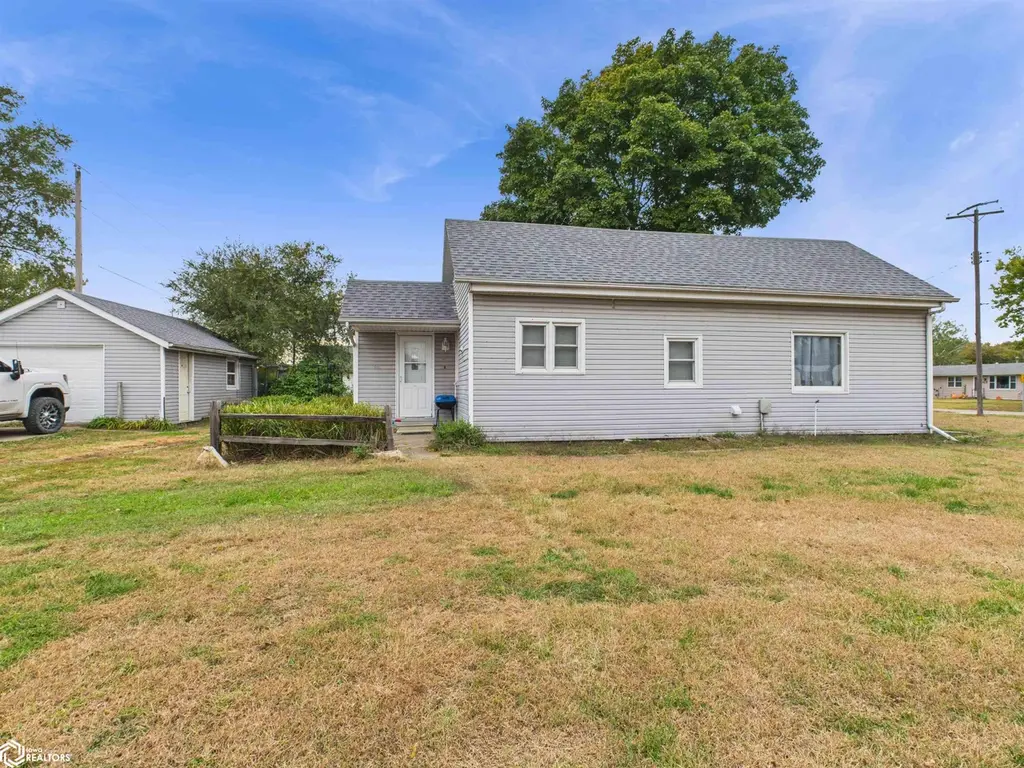
181 Aviston St · Lomax, IL
Flood risk 1/10 · Minimal
- FEMA flood zone
- X (unshaded)
- Chance of flooding over 30 yrs
- 0.0%
- Est. flood insurance / yr
- $473 – $860
Fire risk 1/10 · Minimal
- Est. fire insurance / yr
- $804 – $1,492
Heat risk 3/10 · Minor
- Hot days now (above 105°F)
- 7 days/yr
- Hot days in 30 yrs
- 16 days/yr
Wind risk 2/10 · Minimal
- Chance of severe wind over 30 yrs
- —
Air-quality risk 2/10 · Minimal
- Unhealthy air days now
- 0 days/yr
- Unhealthy air days in 30 yrs
- 1 days/yr
Risk factors via First Street. Map © Google.
Why this score? — see what drove the C+ grade
The composite is a weighted blend of 9 inputs, each scored 0–100. Each bar is that input's sub-score; the figure is the points it added to the 100-point composite (weight × sub-score).
- Cash flow +29.8/30.0
- DSCR +10.0/10.0
- 1% rule +7.5/10.0
- Appreciation +5.0/10.0
- Livability +3.0/5.0
- Rent growth +2.5/5.0
- Schools +2.5/10.0
- Condition / age +2.5/5.0
- ARV discount +0.0/15.0
$69,900
🖨 Deal sheet 📄 Offer letter ✓ Due diligence
Listing remarks MLS
This single-level 2-bedroom, 1-bath ranch home sits on a large corner lot in a peaceful small-town setting. The layout includes a spacious living room, eat-in kitchen, and full bathroom with plenty of storage. Some updates have been made, including a new roof. Great opportunity for a starter home or looking for affordable living with room to grow. Schedule a showing and see what this property has to offer
Key facts
- Eat-in kitchen
- Functional layout
- Corner lot
Tags
Neighborhood map
What this means for you Summary
Snapshot
- This is a 2-bed/1.0-bath single-family listed at $70k.
Deal economics
- At list price, monthly cash flow is $257 ($3k/yr) — positive.
- The deal already cash-flows at list — no discount required.
- Meets the 1% rule at list price ($877 rent vs $70k).
- Recommended offer: $68k (3.0% below list) — sets the bar for market timing.
Location & tenants
- Location reads 59/100 on livability (#1,040 in IL) — a working-class tenant base; expect higher turnover. Strengths: cost of living A+, housing A+; Watch: health & safety C-, employment D, schools F.
- Illini West H S District 307 (town): math 25% / reading 25% proficiency, ranked #611 of 919 in IL (top 66%) — low school quality limits family demand, transient renter base, plan for 1-2y turnover.
- Market conditions: 3 active listings in the ZIP; 5 units permitted in Henderson County in 2024 (0 in 5+ unit buildings).
Forward outlook
- In year one you build about $3k of equity ($483 loan paydown + $2k appreciation (3.0% local appreciation)).
- Henderson County population projected at -31% by 2050 — secular population decline; favor cash flow + early exit over multi-decade hold.
- At projected returns (3.0% appreciation + 3.0% rent growth), your $20k cash investment doubles in ~4 years — after that, you're playing with house money.
Negotiation context
- It's been on market 33 days — a 3% lower offer ($68k) is reasonable based on typical stale-listing flexibility.
- 2 sale attempts with the ask held roughly flat each time — persistent listings suggest the price (not the market) is what's stuck; bring a comps-based counter.
- Current owner paid $57k; 23% above their basis — modest negotiation headroom, anchor on the comps not their cost.
Risks & watch-outs
- Watch-outs: built in 1900 — expect roof / HVAC / electrical / plumbing capex.
Questions for the listing agent
- It's been on market 33 days. Have you received any prior offers? Is the seller open to a 3% concession, seller financing, or rate buy-down credit?
- Built in 1900 — when were the roof, HVAC, electrical panel, plumbing, and water heater last replaced?
- Is there a deadline driving the sale (1031 exchange, divorce, estate, relocation)? That informs how much negotiation room exists.
- Schools are F-rated, which usually means shorter tenancies and higher turnover. Who's the typical renter profile here, and what's been the actual vacancy rate?
- Crime grade is D in this area — have there been break-ins, vandalism, or insurance claims at this property in the last 3 years? What carrier currently insures it and at what premium?
- What's the average days-on-market for RENTAL listings here right now (not sales)? A rising rental-DOM trend means longer vacancies and softer asking-rent achievability than the comps imply.
- What's the recent tenant-quality profile in this submarket — average credit score on applications, eviction rate, late-payment / NSF rate, and stable-employment percentage? A property-management company in the area should have these aggregated.
- How much new for-sale + rental construction is in the pipeline within 1–3 miles? Heavy new supply typically softens prices + rents 12–24 months out; constrained supply supports both.
Investment metrics
- 1% rule
- 1.25% ✓
- Cap rate
- 10.71%
- Cash-on-cash
- 15.79%
- DSCR
- 1.70
- GRM
- 6.6
CMA / ARV
- ARV (median comp)
- $52,547
- List price
- $69,900
- Delta
- 33.02%
- Verdict
- OVERPRICED
- Comps
- 4 within 1.0 mi
Show comp detail 1 sale within ~0.75 mi
| Address | Dist | Beds/Ba | Sqft | Sold | Price | $/sf | Match |
|---|---|---|---|---|---|---|---|
| 181 Aviston St | 0.00mi | 2/1.0 | 929 (0%) | 2mo | $57,000 | $61 | 98 |
Match score weights: distance 35% · size 25% · config 20% · recency 20%. Top-matched comps best support the ARV.
Projected returns pro-forma
3.0% appreciation · 3.0% rent growth · sell at horizon
- IRR
- 22.3%
- Equity multiple
- 2.27×
- Total profit
- $24,804
- Equity at exit
- $31,430
- IRR
- 23.3%
- Equity multiple
- 4.34×
- Total profit
- $65,305
- Equity at exit
- $48,437
Cash invested: $19,572 (down + closing). Projections, not guarantees.
Landlord ↔ Tenant lean methodology
- Overall (STATE)
- 43 Moderately Tenant-Leaning
- State Illinois
- 43 Moderately Tenant-Leaning · D+7
- County
- — inherits STATE
- City
- — inherits STATE
ZIP-level market 61454
- Active inventory
- 3
- Price-to-rent
- 6.6×
Monthly cashflow live
- Estimated rent
- $877 medium interval (Pro) →
- Mortgage (P&I)
- −$367
- Tax from tax record
- −$40 /mo · $476/yr
- Insurance
- −$29
- HOA
- −$0
- Vacancy / Maint / Mgmt
- −$184
- Net cashflow
- $257
Break-even live
UW: 25.0% down · 7.5% · 30yr · 1.5% tax · 5.0% vac · 8.0% maint · 8.0% mgmt
Financing live
Cash to close
- Down payment
- $17,475
- Closing costs
- $2,097
- Reserves months
- —
- Total cash needed
- —
Loan-product check · same deal, 3 products live
Conventional
25% down · 7.5% · 30yr
- Down + closing
- —
- Monthly P&I
- —
- Monthly cashflow
- —
- DSCR
- —
- Eligible?
- —
Personal DTI + credit; lowest rate.
DSCR
20% down · 8.5% · 30yr
- Down + closing
- —
- Monthly P&I
- —
- Monthly cashflow
- —
- DSCR
- —
- Eligible?
- —
No personal income docs; deal must DSCR.
Hard money
10% down · 12.0% · 12mo
- Down + closing
- —
- Monthly P&I
- —
- Monthly cashflow
- —
- DSCR
- —
- Eligible?
- —
Short-term bridge; refi at stabilization.
Listing history 5 events
-
2026-04-21soldstatus $57,000 Closed 408-char remark
Show marketing remark (591 chars)
Back on the market! Buyer was unable to relocate, so this charming home is available again and ready for its next owner. Charming single-level 2-bedroom, 1-bath ranch home situated on a spacious corner lot in a quiet small-town setting. This home offers a functional layout with a generously sized living room, an eat-in kitchen, and a full bath with ample storage. Whether you're searching for a starter home, downsizing, or looking for an affordable investment opportunity, this property offers plenty of potential and room to make it your own. Don’t miss your chance to take a look!
-
2026-04-21$69,900 Active 591-char remark
Show marketing remark (591 chars)
Back on the market! Buyer was unable to relocate, so this charming home is available again and ready for its next owner. Charming single-level 2-bedroom, 1-bath ranch home situated on a spacious corner lot in a quiet small-town setting. This home offers a functional layout with a generously sized living room, an eat-in kitchen, and a full bath with ample storage. Whether you're searching for a starter home, downsizing, or looking for an affordable investment opportunity, this property offers plenty of potential and room to make it your own. Don’t miss your chance to take a look!
-
2026-02-04historical Active Under Contract 408-char remark
Show marketing remark (408 chars)
This single-level 2-bedroom, 1-bath ranch home sits on a large corner lot in a peaceful small-town setting. The layout includes a spacious living room, eat-in kitchen, and full bathroom with plenty of storage. Some updates have been made, including a new roof. Great opportunity for a starter home or looking for affordable living with room to grow. Schedule a showing and see what this property has to offer
-
2025-11-01$70,000 Active 408-char remark
Show marketing remark (408 chars)
This single-level 2-bedroom, 1-bath ranch home sits on a large corner lot in a peaceful small-town setting. The layout includes a spacious living room, eat-in kitchen, and full bathroom with plenty of storage. Some updates have been made, including a new roof. Great opportunity for a starter home or looking for affordable living with room to grow. Schedule a showing and see what this property has to offer
-
2002-12-01soldstatus $16,000
ⓘ Source: listings_history table (triggers on properties + properties_extension) + one-shot
backfill from property_details.listing_events for pre-trigger history.
Tax reassessment forecast IL · Partial reset (capped growth)
- Current annual tax
- $476 · $40/mo
- Projected year-2 tax
- $1,031 · $86/mo
- Expected delta
- +$556/yr (+$46/mo · 116.8%)
ⓘ Screening estimate from a state-policy table — verify with the county assessor before closing.
Climate risk First Street
- Flood 1/10 Low FEMA zone X (unshaded) · 0% chance over 30 yrs
- Wildfire 1/10 Low
- Heat 3/10 Moderate 7 d/yr ≥105°F today · 16 d/yr by 30 yrs out
- Wind 2/10 Low
- Air quality 2/10 Low 0 unhealthy d/yr today · 1 by 30 yrs out
Nearby sold comps map
Loading sold comps map…
Walkable amenities ~0.75 mi
Loading nearby amenities…
Taxation est. · year 1
- Rental income
- $10,524
- − Mortgage interest
- −$3,915
- − Property taxes
- −$476
- − Insurance
- −$350
- − Repairs & maintenance
- −$842
- − Management
- −$842
- − Depreciation
- −$2,033
- Taxable income
- $2,066
- Est. tax owed @ 24.0%
- −$496
- After-tax cash flow
- $2,594/yr
For passive investors: Depreciation is non-cash, so a rental often shows a tax loss while cash-flowing — sheltering income. Rental losses are passive: they offset passive income freely, and up to $25,000/yr can offset ordinary (W-2) income if you actively participate and your MAGI is under $100k (phasing out to $0 by $150k); unused losses carry forward. On sale, claimed depreciation is recaptured at up to 25%, and gains may owe capital-gains tax (a 1031 exchange can defer both). Figures are a year-1 estimate at your 24.0% rate — not tax advice; consult a CPA.
Schools (NCES district)
- District
- Illini West H S District 307
- NCES district ID
- 1701384
- Math proficiency
- 25% ▲ 5.00%
- Reading proficiency
- 25% ▲ 5.00%
- Median HH income
- $47,745
- Composite
- 24.88/100
- National rank
- #12997
- State rank
- #611 of 919 in IL
Livability — Lomax
- Score
- 59/100
- State rank
- #1040
- US rank
- #19897
Category grades
Schools grade is shown separately in the Schools card above.
Census & demographics
- Census place
- Lomax, IL
- Population (ZIP)
- 453
Population outlook (Henderson County) Hauer SSP2
- Today (2025)
- 6,231 people
- By 2030
- 5,815 · -6.7%
- By 2040
- 5,016 · -19.5%
- By 2050
- 4,310 · -30.8%
- By 2075
- 3,166 · -49.2%
- By 2100
- 2,285 · -63.3%
Race, ethnicity, and origin ACS 2023
- Neighborhood character
- Predominantly White (89%)
- Race & ethnicity
- White 89% Hispanic / Latino 10%
- Hispanic origin (detail)
- Mexican 10%
- Common ancestry
- Slovak 4% Iranian 3% Lithuanian 3%
- Languages at home
- 96% English-only · German/W. Germanic 1%
Political lean MEDSL · Henderson
- 2024 margin
- Solid R (+38.8) · D 29.6% · R 68.4% · Other 1.9%
- 2008→2024 swing
- -56.5pp toward R · 2008: 17.7pp · 2024: -38.8pp
- All cycles
- 2024: R+38.8 2020: R+33.0 2016: R+28.8 2012: D+12.3 2008: D+17.7
Not yet ingested
- Civics
- —
Market trends
- HPI YoY
- —
- Current HPI
- —
- Rent YoY
- —
- Metro
- —
- State GDP YoY
- ▲ 1.59%
- F500 in state
- 60
Industry mix (Fortune 500 HQ in IL)
| Industry | F500 HQs | Revenue |
|---|---|---|
| Insurance | 4 | $201B |
|
||
| Consumer Goods | 4 | $87B |
|
||
| Industrial Machinery | 3 | $64B |
|
||
| Healthcare | 2 | $55B |
|
||
| Retail / Pharmacy | 1 | $148B |
|
||
| Agriculture / Food | 1 | $86B |
|
||
Price history
+336.9% since first listed5 events — show timeline
- 2026-04-21 Listed $69,900 IAR
- 2026-04-21 Sold (MLS) $57,000 IAR
- 2026-02-04 Contingent — IAR
- 2025-11-01 Listed $70,000 IAR
- 2002-12-01 Sold (Public Records) $16,000 Public Records
Property tax history
+1.6%/yrLatest (2024): $476 · +11.7% YoY. Source: county tax records.
Cash-flow waterfall
monthlySold comps — $/sqft
last 12 mo · ≤1 miLoading sold comps…