7229 Gallagher Cove Rd NW · Olympia, WA
Flood risk 1/10 · Minimal
- FEMA flood zone
- X (unshaded)
- Chance of flooding over 30 yrs
- 0.0%
- Est. flood insurance / yr
- $507 – $1,088
Fire risk 3/10 · Minor
- Est. fire insurance / yr
- $604 – $1,122
Heat risk 2/10 · Minimal
- Hot days now (above 89°F)
- 7 days/yr
- Hot days in 30 yrs
- 14 days/yr
Wind risk 1/10 · Minimal
- Chance of severe wind over 30 yrs
- —
Air-quality risk 6/10 · Moderate
- Unhealthy air days now
- 7 days/yr
- Unhealthy air days in 30 yrs
- 7 days/yr
Risk factors via First Street. Map © Google.
Why this score? — see what drove the D grade
The composite is a weighted blend of 9 inputs, each scored 0–100. Each bar is that input's sub-score; the figure is the points it added to the 100-point composite (weight × sub-score).
- ARV discount +15.0/15.0
- Appreciation +10.0/10.0
- Schools +5.8/10.0
- Livability +4.2/5.0
- Rent growth +3.3/5.0
- Condition / age +2.5/5.0
- Cash flow +2.4/30.0
- 1% rule +0.0/10.0
- DSCR +0.0/10.0
$589,900
🖨 Deal sheet (PDF) 📄 Offer letter ✓ Due diligence
Listing remarks
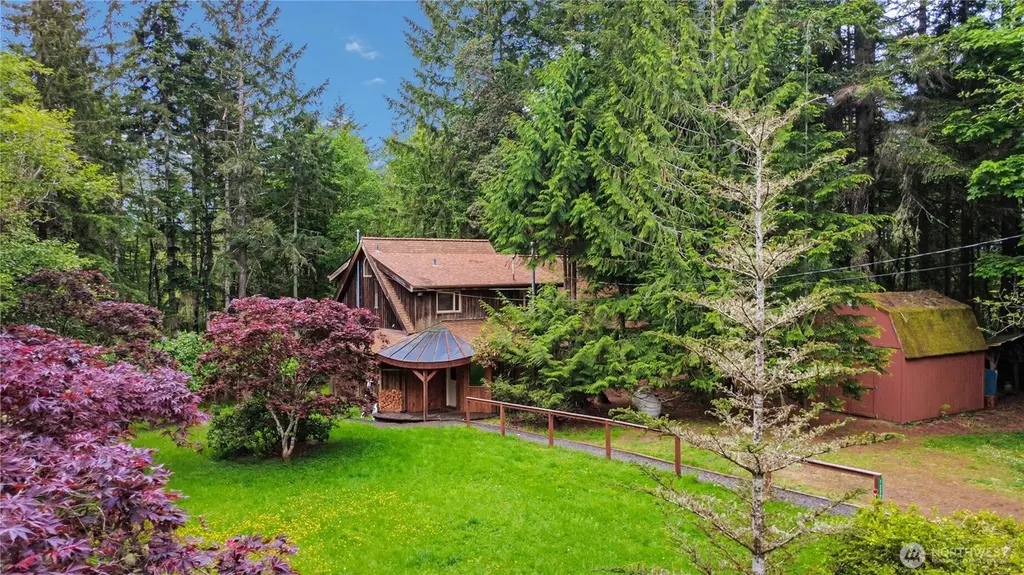
Escape to your own private woodland retreat at the end of a quiet road, just 10 minutes from Frye Cove Beach and 15 minutes to West Side Olympia! Set on 5 peaceful acres, this custom cedar-sided home offers soaring vaulted ceilings, panoramic windows, and abundant year-round natural light throughout. The expansive great room features a cozy wood-burning stove, while the updated kitchen includes new appliances, flooring, picture window, and vent hood, with room to add an island or breakfast nook. Timber details, exposed beams, mortise-and-tenon construction, and a handcrafted wood staircase showcase exceptional craftsmanship throughout. Enjoy fruit trees, private wooded trails, and relaxing
Key facts
- Bright loft
- Expansive great room
- Updated kitchen
Tags
Property features AI
Finance
- Other: Lot approximately 5 acres
- Financial info: Listing accepts Cash and Conventional financing
Exterior
- Parking: Driveway; Off-street parking
- Utilities: Individual well (water); Septic tank (sewer); Electric and propane energy sources; PSE power provider
- Home design: Single family residence; Two-story house; Built on lot; Main entry; Boston Harbor Waterfront community
- Construction: Wood construction; Composition roof; Poured concrete and slab foundation; Built on lot
- Exterior features: Wood exterior; Deck; Outbuildings; Propane on site; Fruit trees; Garden space; Wooded setting; Paved access; Secluded site; Partial slope topography; Has view
Interior
- Kitchen: Dishwasher; Stove/Range
- Bedrooms: 2 bedrooms (1 on main level, 1 on upper level)
- Flooring: Hardwood; Laminate; Vinyl
- Bathrooms: 1 full bath; 1 three-quarter bath (main level)
- Heating & cooling: Forced air heating; Free‑standing stove; No central cooling
- Interior features: Ceiling fan(s); Dining room; Fireplace (wood-burning); Vaulted ceiling(s); Water heater in closet
- Laundry & utility: Water heater (electric) in closet
Neighborhood map
What this means for you Summary
Snapshot
- This is a 2-bed/2.0-bath single-family listed at $590k.
Deal economics
- At list price, monthly cash flow is $-2k ($-25k/yr) — negative.
- To cash-flow at today's rent, offer at most $223k (62.2% below list).
- To meet the 1% rule (rent ≥ 1% of price), the offer needs to be $201k (66.0% below list).
- Recommended offer: $201k (66.0% below list) — sets the bar for 1% rule.
Location & tenants
- Location reads 83/100 on livability (#58 in WA, #1,036 nationally) — a professional / high-income tenant draw. Strengths: amenities A+, commute A+, health & safety A+; Watch: crime F, cost of living D-.
- Griffin School District (suburban): math 59% / reading 68% proficiency, ranked #28 of 291 in WA (top 10%) — acceptable for families but not a draw, mixed tenant base, ~2y average lease; only 14% free/reduced lunch — higher-income household profile.
- Zoned schools: Griffin School (577 students, 23% FRL).
- Market conditions: Rents rising (+3.2%/yr); 306 active listings in the ZIP; solid renter incomes; 1,222 units permitted in Thurston County in 2024 (508 in 5+ unit buildings).
Forward outlook
- In year one you build about $63k of equity ($4k loan paydown + $59k appreciation (10.0% local appreciation)).
- Thurston County population projected at +27% by 2050 — long-run rental-demand tailwind backs the buy-and-hold thesis.
- By year 2, paydown + projected appreciation supports a ~$101k cash-out refi (75% LTV) — recoverable capital for the next deal without selling this one.
Negotiation context
- Only 4 days on market — expect competitive offers; lowballing is unlikely to land.
- 2 sale attempts since 5y ago with the ask held roughly flat each time — persistent listings suggest the price (not the market) is what's stuck; bring a comps-based counter.
Questions for the listing agent
- What do current leases actually rent for vs. the listed asking? Can we see a recent rent roll and the last 12 months of T-12 income?
- Is there a deadline driving the sale (1031 exchange, divorce, estate, relocation)? That informs how much negotiation room exists.
- Schools are A-rated — typically a magnet for longer-tenancy family renters. What's the average tenant stay here, and is there a school-zone premium baked into asking?
- Crime grade is F in this area — have there been break-ins, vandalism, or insurance claims at this property in the last 3 years? What carrier currently insures it and at what premium?
- The area grade is low — what's the realistic commute time and amenity access for the typical tenant pool here? Any planned neighborhood developments (good or bad) we should know about?
- What's the average days-on-market for RENTAL listings here right now (not sales)? A rising rental-DOM trend means longer vacancies and softer asking-rent achievability than the comps imply.
- What's the recent tenant-quality profile in this submarket — average credit score on applications, eviction rate, late-payment / NSF rate, and stable-employment percentage? A property-management company in the area should have these aggregated.
- How much new for-sale + rental construction is in the pipeline within 1–3 miles? Heavy new supply typically softens prices + rents 12–24 months out; constrained supply supports both.
Investment metrics
- 1% rule
- 0.34% ✗
- Cap rate
- 2.07%
- Cash-on-cash
- -15.09%
- DSCR
- 0.33
- GRM
- 24.5
CMA / ARV
- ARV (median comp)
- $737,768
- List price
- $589,900
- Delta
- -20.04%
- Verdict
- UNDERPRICED
- Comps
- 14 within 1.0 mi
Show comp detail 4 sales within ~0.75 mi
| Address | Dist | Beds/Ba | Sqft | Sold | Price | $/sf | Match |
|---|---|---|---|---|---|---|---|
| 7219 Gallagher Cove Rd NW | 0.07mi | 3/2.0 (+1) | 1,704 (-8%) | 2mo | $620,000 | $364 | 76 |
| 7626 78th Loop NW | 0.52mi | 3/2.5 (+1) | 1,952 (+5%) | 2mo | $650,000 | $333 | 59 |
| 7332 Stibgen Rd NW | 0.75mi | 3/2.0 (+1) | 1,920 (+3%) | 17mo | $640,000 | $333 | 41 |
| 7230 Stibgen Rd NW | 0.68mi | 3/2.0 (+1) | 1,590 (-15%) | 22mo | $570,000 | $358 | 20 |
Match score weights: distance 35% · size 25% · config 20% · recency 20%. Top-matched comps best support the ARV.
Projected returns pro-forma
10.0% appreciation · 3.16% rent growth · sell at horizon
- IRR
- 13.8%
- Equity multiple
- 2.14×
- Total profit
- $189,105
- Equity at exit
- $531,429
- IRR
- 13.9%
- Equity multiple
- 5.00×
- Total profit
- $661,113
- Equity at exit
- $1,146,046
Cash invested: $165,172 (down + closing). Projections, not guarantees.
Landlord ↔ Tenant lean methodology
- Overall (STATE)
- 28 Tenant-Leaning
- State Washington
- 28 Tenant-Leaning · D+8
- County
- — inherits STATE
- City
- — inherits STATE
ZIP-level market 98502
- Home prices YoY
- 1.8%
- Rents YoY
- 3.2%
- Active inventory
- 306
- Price-to-rent
- 24.5×
Monthly cashflow live
- Estimated rent
- $2,006 medium interval (Pro) →
- Mortgage (P&I)
- −$3,093
- Tax from tax record
- −$322 /mo · $3,865/yr
- Insurance
- −$246
- HOA
- −$0
- Vacancy / Maint / Mgmt
- −$421
- Net cashflow
- $-2,077
Break-even live
Sensitivity live
| Price | -10% $-1,743 | -5% $-1,910 | +0% $-2,077 | +5% $-2,244 | +10% $-2,411 |
|---|---|---|---|---|---|
| Rent | -10% $-2,235 | -5% $-2,156 | +0% $-2,077 | +5% $-1,997 | +10% $-1,918 |
| Rate | -1.0pp $-1,780 | -0.5pp $-1,927 | base $-2,077 | +0.5pp $-2,230 | +1.0pp $-2,385 |
UW: 25.0% down · 7.5% · 30yr · 1.5% tax · 5.0% vac · 8.0% maint · 8.0% mgmt
Financing live
Cash to close
- Down payment
- $147,475
- Closing costs
- $17,697
- Reserves months
- —
- Total cash needed
- —
Loan-product check · same deal, 3 products live
Conventional
25% down · 7.5% · 30yr
- Down + closing
- —
- Monthly P&I
- —
- Monthly cashflow
- —
- DSCR
- —
- Eligible?
- —
Personal DTI + credit; lowest rate.
DSCR
20% down · 8.5% · 30yr
- Down + closing
- —
- Monthly P&I
- —
- Monthly cashflow
- —
- DSCR
- —
- Eligible?
- —
No personal income docs; deal must DSCR.
Hard money
10% down · 12.0% · 12mo
- Down + closing
- —
- Monthly P&I
- —
- Monthly cashflow
- —
- DSCR
- —
- Eligible?
- —
Short-term bridge; refi at stabilization.
Listing history 5 events
-
2026-05-15$589,900 Active
-
2022-01-18soldstatus $521,000 Closed
-
2021-12-15status Pending
-
2021-12-09$450,000 Active
-
1998-02-10soldstatus $135,000
ⓘ Source: listings_history table (triggers on properties + properties_extension) + one-shot
backfill from property_details.listing_events for pre-trigger history.
Tax reassessment forecast WA · Resets to sale price
- Current annual tax
- $3,865 · $322/mo
- Projected year-2 tax
- $5,781 · $482/mo
- Expected delta
- +$1,916/yr (+$160/mo · 49.6%)
ⓘ Screening estimate from a state-policy table — verify with the county assessor before closing.
Climate risk First Street
- Flood 1/10 Low FEMA zone X (unshaded) · 0% chance over 30 yrs
- Wildfire 3/10 Moderate
- Heat 2/10 Low 7 d/yr ≥89°F today · 14 d/yr by 30 yrs out
- Wind 1/10 Low
- Air quality 6/10 Major 7 unhealthy d/yr today · 7 by 30 yrs out
Nearby sold comps map
Loading sold comps map…
Walkable amenities ~0.75 mi
Loading nearby amenities…
Taxation est. · year 1
- Rental income
- $24,071
- − Mortgage interest
- −$33,044
- − Property taxes
- −$3,865
- − Insurance
- −$2,950
- − Repairs & maintenance
- −$1,926
- − Management
- −$1,926
- − Depreciation
- −$17,161
- Taxable loss
- −$36,800
- Est. tax savings @ 24.0%
- +$8,832
- After-tax cash flow
- $-16,089/yr
For passive investors: Depreciation is non-cash, so a rental often shows a tax loss while cash-flowing — sheltering income. Rental losses are passive: they offset passive income freely, and up to $25,000/yr can offset ordinary (W-2) income if you actively participate and your MAGI is under $100k (phasing out to $0 by $150k); unused losses carry forward. On sale, claimed depreciation is recaptured at up to 25%, and gains may owe capital-gains tax (a 1031 exchange can defer both). Figures are a year-1 estimate at your 24.0% rate — not tax advice; consult a CPA.
Schools (NCES district)
- District
- Griffin School District
- NCES district ID
- 5303330
- Math proficiency
- 59% ▼ -2.00%
- Reading proficiency
- 68% ▼ -4.00%
- Median HH income
- $80,706
- Composite
- 58.36/100
- National rank
- #2079
- State rank
- #28 of 291 in WA
Livability — Olympia
- Score
- 83/100
- State rank
- #58
- US rank
- #1036
Category grades
Schools grade is shown separately in the Schools card above.
Census & demographics
- County
- Thurston County · 269,345 people
- City population
- 98,428
- Metro
- Olympia-Lacey-Tumwater, WA
- Population (ZIP)
- 35,398
- Household income
- $92,207
- Rent vs Own
- Severe rent burden
- 1811.0
Population outlook (Thurston County) Hauer SSP2
- Today (2025)
- 308,239 people
- By 2030
- 326,483 · +5.9%
- By 2040
- 359,890 · +16.8%
- By 2050
- 391,800 · +27.1%
- By 2075
- 468,024 · +51.8%
- By 2100
- 519,890 · +68.7%
Race, ethnicity, and origin ACS 2023
- Neighborhood character
- Predominantly White (71%)
- Race & ethnicity
- White 71% Two or more races 13% Hispanic / Latino 11% Asian 6% Black 3% Native American 1%
- Hispanic origin (detail)
- Mexican 3% Puerto Rican 4%
- Common ancestry
- Italian 5% Portuguese 4% Iranian 3%
- Foreign-born
- 8% · Vietnam, Canada, China
- Languages at home
- 90% English-only · Spanish 3% Vietnamese 2% Other Asian/Pacific 1%
Political lean MEDSL · Thurston
- 2024 margin
- Strong D (+20.4) · D 58.5% · R 38.1% · Other 3.5%
- 2008→2024 swing
- -1.3pp toward R · 2008: 21.7pp · 2024: 20.4pp
- All cycles
- 2024: D+20.4 2020: D+18.6 2016: D+15.4 2012: D+19.0 2008: D+21.7
Not yet ingested
- Civics
- —
Market trends
- HPI YoY
- ▲ 18.49%
- Current HPI
- 1056.49
- Rent YoY
- ▲ 3.16%
- Metro
- Olympia-Lacey-Tumwater, WA
- State GDP YoY
- ▲ 4.65%
- F500 in state
- 22
Industry mix (Fortune 500 HQ in WA)
| Industry | F500 HQs | Revenue |
|---|---|---|
| Retail | 2 | $269B |
|
||
| Technology / Retail | 1 | $638B |
|
||
| Technology | 1 | $245B |
|
||
| Telecommunications | 1 | $38B |
|
||
| Food / Beverage | 1 | $36B |
|
||
| Automotive / Trucks | 1 | $34B |
|
||
Price history
+337.0% since first listed6 events — show timeline
- 2026-05-19 Pending — NWMLS as Distributed by MLS Grid
- 2026-05-15 Listed $589,900 NWMLS as Distributed by MLS Grid
- 2022-01-18 Sold (MLS) $521,000 NWMLS as Distributed by MLS Grid
- 2021-12-15 Pending — NWMLS as Distributed by MLS Grid
- 2021-12-09 Listed $450,000 NWMLS as Distributed by MLS Grid
- 1998-02-10 Sold (Public Records) $135,000 Public Records
Property tax history
+1.5%/yrLatest (2026): $3,865 · +8.6% YoY. Source: county tax records.
Cash-flow waterfall
monthlySold comps — $/sqft
last 12 mo · ≤1 miLoading sold comps…