42375 Lochmoor St · Clinton, MI
Flood risk 6/10 · Moderate
- FEMA flood zone
- X (unshaded)
- Chance of flooding over 30 yrs
- 0.67%
- Est. flood insurance / yr
- $507 – $1,088
Fire risk 1/10 · Minimal
- Est. fire insurance / yr
- $784 – $1,456
Heat risk 3/10 · Minor
- Hot days now (above 96°F)
- 7 days/yr
- Hot days in 30 yrs
- 15 days/yr
Wind risk 1/10 · Minimal
- Chance of severe wind over 30 yrs
- —
Air-quality risk 4/10 · Minor
- Unhealthy air days now
- 4 days/yr
- Unhealthy air days in 30 yrs
- 6 days/yr
Risk factors via First Street. Map © Google.
Why this score? — see what drove the F grade
The composite is a weighted blend of 9 inputs, each scored 0–100. Each bar is that input's sub-score; the figure is the points it added to the 100-point composite (weight × sub-score).
- Cash flow +7.9/30.0
- ARV discount +7.5/15.0
- 1% rule +4.5/10.0
- Schools +4.0/10.0
- Livability +3.5/5.0
- Condition / age +2.5/5.0
- Rent growth +2.3/5.0
- DSCR +1.9/10.0
- Appreciation +0.0/10.0
$159,900
🖨 Deal sheet (PDF) 📄 Offer letter ✓ Due diligence
Listing remarks
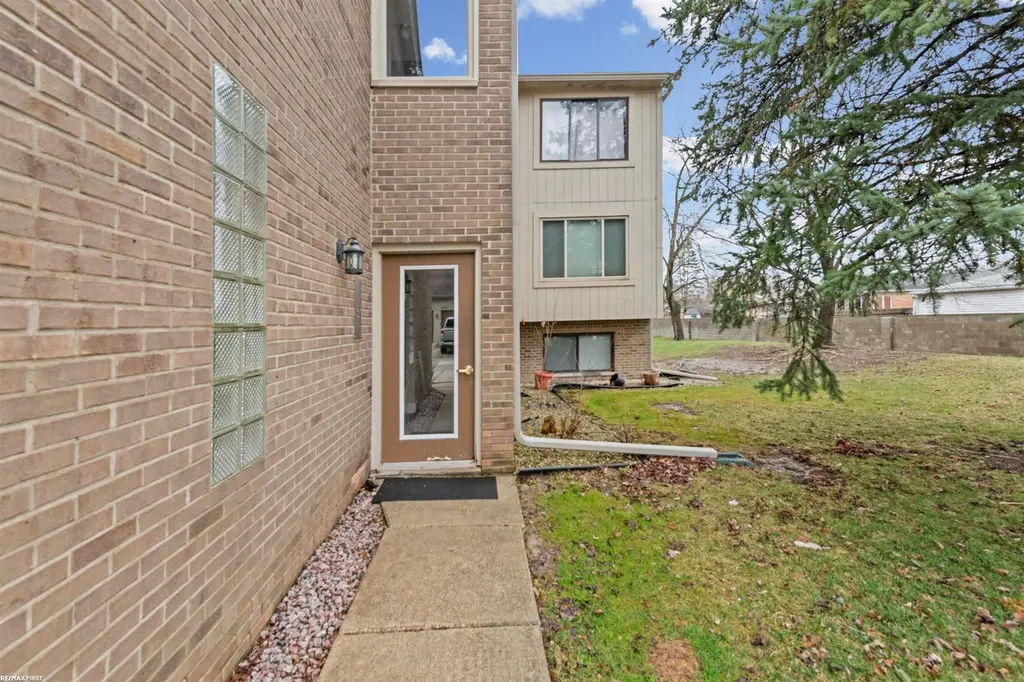
Check out this beautiful 2-bedroom condo featuring neutral d©cor and fresh paint throughout. Relax on your private deck-perfect for enjoying the sun by day and the stars by night. This home also offers a spacious laundry room and a separate 15x12 storage area on the floor below, providing plenty of room for all your needs. Major updates include a new roof (2024) and new HVAC system (2025) for added peace of mind. And that is not all! Hot water tank (2026) and all new appliances (2025) Make this your first and only stop-you won't be disappointed!
Key facts
- Private deck
- New roof
- New hvac system
Tags
Property features AI
Finance
- Other: Subdivision: SCHULTZ ESTATES; Cross street: Garfield / 19 Mile
- HOA & community: Homeowners association with monthly fee; Monthly association fee of $272; HOA covers grounds and structure maintenance
Exterior
- Parking: Attached garage (1 car)
- Utilities: Public water; Public sewer; Sewer available
- Home design: Residential condominium; One-level; Entry level above grade
- Construction: Brick and wood siding construction; Slab foundation; Built as a condominium (year built not provided)
- Exterior features: Paved road access; Pets allowed (contact for details)
Interior
- Kitchen: Dishwasher; Microwave; Oven; Range; Refrigerator
- Bathrooms: 1 full bathroom
- Heating & cooling: Central air conditioning; Forced air heating; Natural gas heating
- Interior features: Balcony; Gas water heater; 6 total rooms
- Laundry & utility: Washer; Dryer
Neighborhood map
What this means for you Summary
Snapshot
- This is a 2-bed/1.0-bath condo listed at $160k.
Deal economics
- At list price, monthly cash flow is $-173 ($-2k/yr) — negative.
- To cash-flow at today's rent, offer at most $135k (15.6% below list).
- To meet the 1% rule (rent ≥ 1% of price), the offer needs to be $152k (4.7% below list).
- Recommended offer: $135k (15.6% below list) — sets the bar for cash-flow.
- Cap rate 5.0% vs local median 3.7% in Clinton — top-decile yield for the area; either an underpriced asset or a hidden risk that comps aren't pricing in. Stress-test before assuming the spread holds.
Location & tenants
- Location reads 70/100 on livability (#315 in MI) — a middle-class / working-renter tenant base. Strengths: cost of living A+, housing A+, health & safety A+; Watch: amenities F, commute F.
- Chippewa Valley Schools (suburban): math 39% / reading 50% proficiency, ranked #133 of 540 in MI (top 25%) — families likely to look elsewhere, expect single-tenant / working-renter base with shorter leases.
- Market conditions: Rents soft (-0.9%/yr); 268 active listings in the ZIP; 12 comparable units currently listed for rent nearby; rentals leasing fast (median 6d on market — plan ~1-2 weeks tenant-placement turnaround); 42% of comp listings sitting > 30 days — soft ceiling on asking rent; solid renter incomes; 1,321 units permitted in Macomb County in 2024 (86 in 5+ unit buildings).
Forward outlook
- Local home prices are declining (-3.0%/yr); year-one equity from $1k of loan paydown is wiped out by about $5k of value loss. Plan a longer hold.
- Macomb County population projected at +9% by 2050 — modest demand growth; plan on rents tracking national, not racing it.
Negotiation context
- It's been on market 40 days — a 3% lower offer ($155k) is reasonable based on typical stale-listing flexibility.
- 11 sale attempts since 32y ago; this cycle's ask has dropped $10k (6%) from the opening price — seller is motivated, your offer sets the floor, not the list.
- Current owner paid $79k; list at $160k implies a 102% gain — meaningful room to come down on a strong offer.
Risks & watch-outs
- Climate carrying-cost: major flood risk — expect insurance premiums to compound above CPI over the hold.
Questions for the listing agent
- What do current leases actually rent for vs. the listed asking? Can we see a recent rent roll and the last 12 months of T-12 income?
- It's been on market 40 days. Have you received any prior offers? Is the seller open to a 16% concession, seller financing, or rate buy-down credit?
- What does the HOA fee cover, when was the last increase, and are there any pending special assessments or reserve-fund shortfalls?
- Any open or pending special assessments — roof, HVAC, plumbing, elevator, façade? What's the per-unit balance and payoff schedule, and is the seller paying it off at close or rolling it to the buyer?
- Is there a deadline driving the sale (1031 exchange, divorce, estate, relocation)? That informs how much negotiation room exists.
- Schools are B-rated — typically a magnet for longer-tenancy family renters. What's the average tenant stay here, and is there a school-zone premium baked into asking?
- The area grade is low — what's the realistic commute time and amenity access for the typical tenant pool here? Any planned neighborhood developments (good or bad) we should know about?
- What's the average days-on-market for RENTAL listings here right now (not sales)? A rising rental-DOM trend means longer vacancies and softer asking-rent achievability than the comps imply.
- What's the recent tenant-quality profile in this submarket — average credit score on applications, eviction rate, late-payment / NSF rate, and stable-employment percentage? A property-management company in the area should have these aggregated.
- How much new apartment / multifamily construction is in the pipeline within 1–3 miles? Heavy new supply (>2% of stock underway) typically softens rents 12–24 months out; light construction supports rent growth.
Investment metrics
- 1% rule
- 0.95% ✗
- Cap rate
- 5.00%
- Cash-on-cash
- -4.63%
- DSCR
- 0.79
- GRM
- 8.7
CMA / ARV
No comps found within radius.
Projected returns pro-forma
-3.0% appreciation · 0.0% rent growth · sell at horizon
- IRR
- -28.4%
- Equity multiple
- 0.08×
- Total profit
- $-41,184
- Equity at exit
- $23,842
- IRR
- -52.1%
- Equity multiple
- -0.49×
- Total profit
- $-66,515
- Equity at exit
- $13,825
Cash invested: $44,772 (down + closing). Projections, not guarantees.
Landlord ↔ Tenant lean methodology
- Overall (STATE)
- 62 Landlord-Friendly
- State Michigan
- 62 Landlord-Friendly · EVEN
- County
- — inherits STATE
- City
- — inherits STATE
ZIP-level market 48038
- Rents YoY
- -0.9%
- Active inventory
- 268
- Price-to-rent
- 8.7×
Monthly cashflow live
- Estimated rent
- $1,525 high interval (Pro) →
- Mortgage (P&I)
- −$839
- Tax est. 1.5%
- −$200 /mo · $2,398/yr
- Insurance
- −$67
- HOA
- −$272
- Vacancy / Maint / Mgmt
- −$320
- Net cashflow
- $-173
Break-even live
Sensitivity live
| Price | -10% $-62 | -5% $-117 | +0% $-173 | +5% $-228 | +10% $-283 |
|---|---|---|---|---|---|
| Rent | -10% $-293 | -5% $-233 | +0% $-173 | +5% $-112 | +10% $-52 |
| Rate | -1.0pp $-92 | -0.5pp $-132 | base $-173 | +0.5pp $-214 | +1.0pp $-256 |
UW: 25.0% down · 7.5% · 30yr · 1.5% tax · 5.0% vac · 8.0% maint · 8.0% mgmt
Financing live
Cash to close
- Down payment
- $39,975
- Closing costs
- $4,797
- Reserves months
- —
- Total cash needed
- —
Loan-product check · same deal, 3 products live
Conventional
25% down · 7.5% · 30yr
- Down + closing
- —
- Monthly P&I
- —
- Monthly cashflow
- —
- DSCR
- —
- Eligible?
- —
Personal DTI + credit; lowest rate.
DSCR
20% down · 8.5% · 30yr
- Down + closing
- —
- Monthly P&I
- —
- Monthly cashflow
- —
- DSCR
- —
- Eligible?
- —
No personal income docs; deal must DSCR.
Hard money
10% down · 12.0% · 12mo
- Down + closing
- —
- Monthly P&I
- —
- Monthly cashflow
- —
- DSCR
- —
- Eligible?
- —
Short-term bridge; refi at stabilization.
Rent comps 12 comps
| Address | Beds | Baths | Sqft | Rent | $/sqft | DOM | Units | Dist |
|---|---|---|---|---|---|---|---|---|
| 42206 Toddmark Ln #47 Clinton Twp, MI | 2.0 | 1.5 | 1288 | $1,750 | $1.36 | 45d | 1 | 0.15mi |
| 42383 Garfield Rd Clinton Twp, MI | 2.0 | 2.0 | 1100 | $1,200 | $1.09 | 45d | 1 | 0.43mi |
| 18255 Manorwood S Clinton Twp, MI | 2.0 | 1.0–2.0 | 1225 | $1,793 | $1.46 | 0d | 15 | 0.67mi |
| 42566 Clinton Pl Dr Clinton Twp, MI | 1.0–2.0 | 1.0–2.0 | 922 | $1,680 | $1.82 | 3d | 1 | 0.84mi |
| 18920 Walden St Clinton Twp, MI | 1.0 | 1.0 | 700 | $928 | $1.32 | 45d | 1 | 0.85mi |
| 17721 Montage Clinton Twp, MI | 2.0–3.0 | 2.0–3.0 | 1563 | $1,985 | $1.27 | 0d | 6 | 1.02mi |
| 17673 Kingsbrooke Cir Clinton Twp, MI | 1.0–2.0 | 1.0–1.5 | 900 | $1,223 | $1.36 | 45d | 6 | 1.04mi |
| 42480 Green Valley Dr Clinton Twp, MI | 1.0–2.0 | 1.0 | 771 | $1,293 | $1.68 | 1d | 32 | 1.17mi |
| 17001 Eleanor Dr S Clinton Twp, MI | 1.0–2.0 | 1.0 | 790 | $1,200 | $1.52 | 45d | 1 | 1.22mi |
| 15770 Lakeside Village Dr Clinton Twp, MI | 1.0–2.0 | 1.0–2.0 | 980 | $1,690 | $1.72 | 0d | 55 | 1.24mi |
| 15010 Ashgrove Dr Sterling Heights, MI | 1.0–2.0 | 1.0–2.0 | 720 | $1,250 | $1.74 | 3d | 12 | 1.34mi |
| 15895 Cambridge Dr Clinton Twp, MI | 2.0 | 1.5 | 946 | $1,750 | $1.85 | 5d | 1 | 1.43mi |
HOA detail condo
- Monthly dues
- $272 · $3,264/yr
- Likely covers
- water
- Assessments
- None detected in remarks — confirm with the listing agent.
Listing history 36 events
-
2026-06-08days on market $159,900 Active 40 DOM
-
2026-06-07days on market $159,900 Active 39 DOM
-
2026-06-04days on market $159,900 Active 36 DOM
-
2026-06-03days on market $159,900 Active 35 DOM
-
2026-06-02remarks 552-char remark
-
2026-06-02pricedays on market $159,900 Active 34 DOM
-
2026-06-01days on market $162,900 Active 33 DOM
-
2026-05-31days on market $162,900 Active 32 DOM
-
2026-05-05price $162,900 503-char remark
-
2026-05-04price $162,900 483-char remark
-
2026-04-29$169,900 Active 483-char remark
-
2026-04-29$169,900 Active 503-char remark
-
2026-04-29historical
-
2026-04-29historical
-
2026-04-07$169,900 Active
-
2026-04-07$169,900 Active
-
2017-11-28soldstatus $79,000 Closed
-
2017-11-28soldstatus $79,000
-
2017-10-23status Pending
-
2017-09-29status Back on Market
-
2017-09-15status Pending
-
2017-09-13price $79,900
-
2017-08-17price $87,900
-
2017-07-19price $94,900
-
2017-06-17$104,900 Active
-
2017-06-16$79,900
-
2004-08-02soldstatus $116,000
-
2004-07-24soldstatus $116,000
-
2004-07-11historical
-
2004-03-31$118,000
-
2004-03-31$118,000
-
1996-10-31soldstatus $77,500
-
1996-09-25historical
-
1996-08-24$77,900
-
1994-11-25soldstatus $64,000
-
1994-07-02$62,900
ⓘ Source: listings_history table (triggers on properties + properties_extension) + one-shot
backfill from property_details.listing_events for pre-trigger history.
Climate risk First Street
- Flood 6/10 Major FEMA zone X (unshaded) · 67% chance over 30 yrs
- Wildfire 1/10 Low
- Heat 3/10 Moderate 7 d/yr ≥96°F today · 15 d/yr by 30 yrs out
- Wind 1/10 Low
- Air quality 4/10 Moderate 4 unhealthy d/yr today · 6 by 30 yrs out
Nearby sold comps map
Loading sold comps map…
Walkable amenities ~0.75 mi
Loading nearby amenities…
Taxation est. · year 1
- Rental income
- $18,294
- − Mortgage interest
- −$8,957
- − Property taxes
- −$2,398
- − Insurance
- −$800
- − Repairs & maintenance
- −$1,464
- − Management
- −$1,464
- − HOA
- −$3,264
- − Depreciation
- −$4,652
- Taxable loss
- −$4,703
- Est. tax savings @ 24.0%
- +$1,129
- After-tax cash flow
- $-943/yr
For passive investors: Depreciation is non-cash, so a rental often shows a tax loss while cash-flowing — sheltering income. Rental losses are passive: they offset passive income freely, and up to $25,000/yr can offset ordinary (W-2) income if you actively participate and your MAGI is under $100k (phasing out to $0 by $150k); unused losses carry forward. On sale, claimed depreciation is recaptured at up to 25%, and gains may owe capital-gains tax (a 1031 exchange can defer both). Figures are a year-1 estimate at your 24.0% rate — not tax advice; consult a CPA.
Schools (NCES district)
- District
- Chippewa Valley Schools
- NCES district ID
- 2609570
- Math proficiency
- 39% ▼ -10.00%
- Reading proficiency
- 50% ▼ -4.00%
- Median HH income
- $64,964
- Composite
- 39.61/100
- National rank
- #3922
- State rank
- #133 of 540 in MI
Livability — Clinton
- Score
- 70/100
- State rank
- #315
- US rank
- #7703
Category grades
Schools grade is shown separately in the Schools card above.
Census & demographics
- County
- Macomb County · 638,552 people
- Metro
- Detroit-Warren-Dearborn, MI
- Population (ZIP)
- 44,422
- Household income
- $78,567
- Rent vs Own
- Severe rent burden
- 1788.0
Population outlook (Macomb County) Hauer SSP2
- Today (2025)
- 925,296 people
- By 2030
- 948,226 · +2.5%
- By 2040
- 983,961 · +6.3%
- By 2050
- 1,010,200 · +9.2%
- By 2075
- 1,076,222 · +16.3%
- By 2100
- 1,077,065 · +16.4%
Race, ethnicity, and origin ACS 2023
- Neighborhood character
- Predominantly White (77%)
- Race & ethnicity
- White 77% Black 11% Two or more races 7% Asian 3% Hispanic / Latino 2%
- Common ancestry
- Romanian 16% Lithuanian 3% Iranian 2%
- Foreign-born
- 11% · Canada, Vietnam
- Languages at home
- 86% English-only · Other Indo-European 5% Russian/Polish/Slavic 2% Arabic 2%
Political lean MEDSL · Macomb
- 2024 margin
- R (+13.7) · D 42.2% · R 55.9% · Other 1.9%
- 2008→2024 swing
- -22.3pp toward R · 2008: 8.6pp · 2024: -13.7pp
- All cycles
- 2024: R+13.7 2020: R+8.1 2016: R+11.6 2012: D+4.0 2008: D+8.6
Not yet ingested
- Civics
- —
Market trends
- HPI YoY
- ▼ -212.31%
- Current HPI
- 261.3877
- Rent YoY
- ▼ -0.92%
- Metro
- Detroit-Warren-Dearborn, MI
- State GDP YoY
- ▲ 1.37%
- F500 in state
- 28
Industry mix (Fortune 500 HQ in MI)
| Industry | F500 HQs | Revenue |
|---|---|---|
| Automotive Parts | 3 | $48B |
|
||
| Automotive | 2 | $372B |
|
||
| Chemicals | 1 | $45B |
|
||
| Automotive Retail | 1 | $29B |
|
||
| Healthcare / Medical Devices | 1 | $23B |
|
||
| Automotive Technology | 1 | $20B |
|
||
Price history
+154.2% since first listed31 events — show timeline
- 2026-06-08 Listing Removed — MiRealSource-MiMLS
- 2026-06-02 Price Changed $159,900 MiRealSource-MiMLS
- 2026-06-02 Price Changed $159,900 REALCOMP
- 2026-05-05 Price Changed $162,900 MiRealSource-MiMLS
- 2026-05-04 Price Changed $162,900 REALCOMP
- 2026-04-29 Listed $169,900 REALCOMP
- 2026-04-29 Listing Removed — REALCOMP
- 2026-04-29 Listing Removed — MiRealSource-MiMLS
- 2026-04-29 Listed $169,900 MiRealSource-MiMLS
- 2026-04-07 Listed $169,900 REALCOMP
- 2026-04-07 Listed $169,900 MiRealSource-MiMLS
- 2017-11-28 Sold (MLS) $79,000 REALCOMP
- 2017-11-28 Sold (MLS) $79,000 MiRealSource-MiMLS
- 2017-10-23 Pending — MiRealSource-MiMLS
- 2017-09-29 Relisted — MiRealSource-MiMLS
- 2017-09-15 Pending — MiRealSource-MiMLS
- 2017-09-13 Price Changed $79,900 MiRealSource-MiMLS
- 2017-08-17 Price Changed $87,900 MiRealSource-MiMLS
- 2017-07-19 Price Changed $94,900 MiRealSource-MiMLS
- 2017-06-17 Listed $104,900 MiRealSource-MiMLS
- 2017-06-16 Listed $79,900 REALCOMP
- 2004-08-02 Sold (MLS) $116,000 REALCOMP
- 2004-07-24 Sold (MLS) $116,000 MiRealSource-MiMLS
- 2004-07-11 Listing Removed — MiRealSource-MiMLS
- 2004-03-31 Listed $118,000 MiRealSource-MiMLS
- 2004-03-31 Listed $118,000 REALCOMP
- 1996-10-31 Sold (MLS) $77,500 MiRealSource-MiMLS
- 1996-09-25 Listing Removed — MiRealSource-MiMLS
- 1996-08-24 Listed $77,900 MiRealSource-MiMLS
- 1994-11-25 Sold (MLS) $64,000 MiRealSource-MiMLS
- 1994-07-02 Listed $62,900 MiRealSource-MiMLS
Cash-flow waterfall
monthlySold comps — $/sqft
last 12 mo · ≤1 miLoading sold comps…