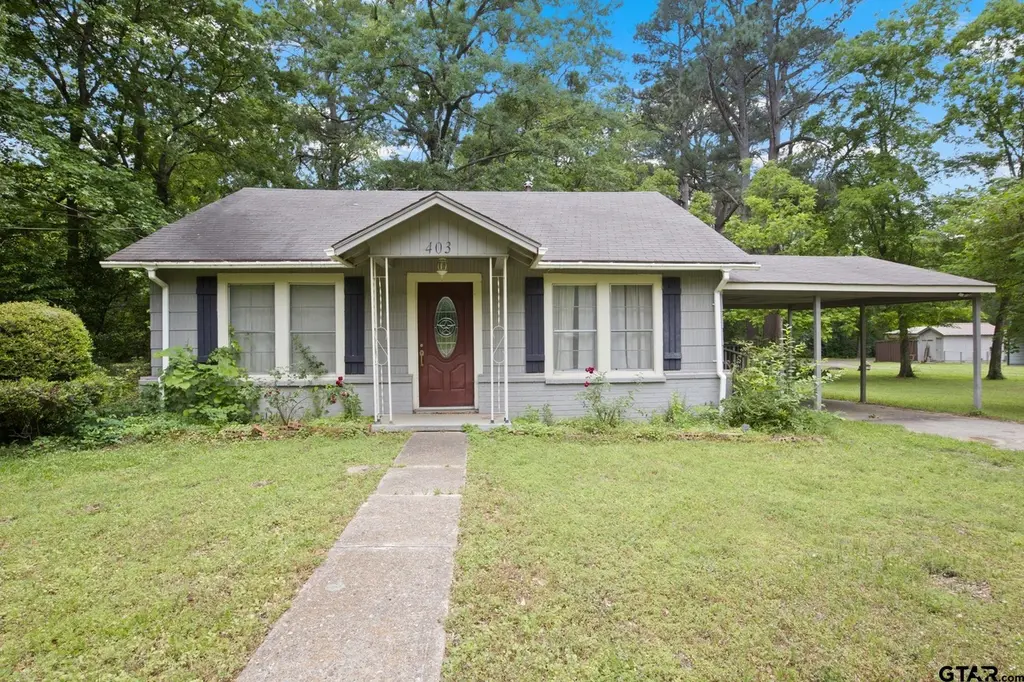
403 Pace Ave · Naples, TX
Flood risk 1/10 · Minimal
- FEMA flood zone
- X
- Chance of flooding over 30 yrs
- 0.0%
- Est. flood insurance / yr
- $507 – $1,088
Fire risk 5/10 · Moderate
- Est. fire insurance / yr
- $1,222 – $2,270
Heat risk 7/10 · Major
- Hot days now (above 111°F)
- 7 days/yr
- Hot days in 30 yrs
- 21 days/yr
Wind risk 6/10 · Moderate
- Chance of severe wind over 30 yrs
- 27.0%
Air-quality risk 2/10 · Minimal
- Unhealthy air days now
- 1 days/yr
- Unhealthy air days in 30 yrs
- 1 days/yr
Risk factors via First Street. Map © Google.
Why this score? — see what drove the C+ grade
The composite is a weighted blend of 9 inputs, each scored 0–100. Each bar is that input's sub-score; the figure is the points it added to the 100-point composite (weight × sub-score).
- Cash flow +22.1/30.0
- ARV discount +11.0/15.0
- DSCR +7.1/10.0
- Appreciation +6.9/10.0
- 1% rule +5.7/10.0
- Livability +3.1/5.0
- Schools +2.7/10.0
- Rent growth +2.5/5.0
- Condition / age +2.5/5.0
$79,500
🖨 Deal sheet 📄 Offer letter ✓ Due diligence
Listing remarks MLS
Charming and full of character, this adorable 2-bedroom, 1-bath home sits on a spacious 0.56-acre lot, offering the perfect blend of cozy living and outdoor space. With 870 square feet, this “dollhouse” is ideal for anyone looking for a peaceful place to call home. Inside, you’ll find a warm and functional layout, complete with a gas stove for cooking enthusiasts. Outside, the property truly shines with a covered carport, storage building, and an additional metal outbuilding—perfect for hobbies, equipment, or extra storage. Surrounded by mature trees and plenty of yard space, this property offers both privacy and room to grow. Whether you’re enjoying quiet mornings on the porch or making use of the extra outdoor space, this home delivers comfort, charm, and versatility.
Key facts
- Metal outbuilding
- Covered carport
- Storage building
Tags
Neighborhood map
What this means for you Summary
Snapshot
- This is a 2-bed/1.0-bath single-family listed at $80k.
Deal economics
- At list price, monthly cash flow is $128 ($2k/yr) — positive.
- The deal already cash-flows at list — no discount required.
- Meets the 1% rule at list price ($849 rent vs $80k).
- Recommended offer: $77k (3.0% below list) — sets the bar for market timing.
Location & tenants
- Location reads 61/100 on livability (#986 in TX) — a middle-class / working-renter tenant base. Strengths: cost of living A+, housing A+, crime A-; Watch: schools F, amenities F, commute F.
- Pewitt CISD (rural): math 26% / reading 40% proficiency, ranked #583 of 826 in TX (top 71%) — families likely to look elsewhere, expect single-tenant / working-renter base with shorter leases.
- Market conditions: 47 active listings in the ZIP; 3 units permitted in Morris County in 2024 (0 in 5+ unit buildings).
Forward outlook
- In year one you build about $4k of equity ($550 loan paydown + $3k appreciation (3.8% local appreciation)).
- Morris County population projected at -19% by 2050 — secular population decline; favor cash flow + early exit over multi-decade hold.
- At projected returns (3.8% appreciation + 3.0% rent growth), your $22k cash investment doubles in ~4 years — after that, you're playing with house money.
- By year 9, paydown + projected appreciation supports a ~$30k cash-out refi (75% LTV) — recoverable capital for the next deal without selling this one.
Negotiation context
- It's been on market 41 days — a 3% lower offer ($77k) is reasonable based on typical stale-listing flexibility.
- Current owner paid $31k; list at $80k implies a 156% gain — meaningful room to come down on a strong offer.
Risks & watch-outs
- Climate carrying-cost: major wind risk, 27% chance of damaging wind over 30y; moderate wildfire risk; extreme-heat days projected 7→21/yr by 2055 (HVAC capex compounding) — expect insurance premiums to compound above CPI over the hold.
Questions for the listing agent
- It's been on market 41 days. Have you received any prior offers? Is the seller open to a 3% concession, seller financing, or rate buy-down credit?
- Is there a deadline driving the sale (1031 exchange, divorce, estate, relocation)? That informs how much negotiation room exists.
- Schools are F-rated, which usually means shorter tenancies and higher turnover. Who's the typical renter profile here, and what's been the actual vacancy rate?
- What's the average days-on-market for RENTAL listings here right now (not sales)? A rising rental-DOM trend means longer vacancies and softer asking-rent achievability than the comps imply.
- What's the recent tenant-quality profile in this submarket — average credit score on applications, eviction rate, late-payment / NSF rate, and stable-employment percentage? A property-management company in the area should have these aggregated.
- How much new for-sale + rental construction is in the pipeline within 1–3 miles? Heavy new supply typically softens prices + rents 12–24 months out; constrained supply supports both.
Investment metrics
- 1% rule
- 1.07% ✓
- Cap rate
- 8.23%
- Cash-on-cash
- 6.92%
- DSCR
- 1.31
- GRM
- 7.8
CMA / ARV
- ARV (median comp)
- $86,115
- List price
- $79,500
- Delta
- -7.68%
- Verdict
- FAIR
- Comps
- 2 within 1.0 mi
Show comp detail 2 sales within ~0.75 mi
| Address | Dist | Beds/Ba | Sqft | Sold | Price | $/sf | Match |
|---|---|---|---|---|---|---|---|
| 304 W Main St | 0.26mi | 2/1.0 | 857 (-2%) | 7mo | $90,000 | $105 | 80 |
| 404 Pace St | 0.04mi | 2/1.0 | 816 (-6%) | 18mo | $87,000 | $107 | 73 |
Match score weights: distance 35% · size 25% · config 20% · recency 20%. Top-matched comps best support the ARV.
Projected returns pro-forma
3.75% appreciation · 3.0% rent growth · sell at horizon
- IRR
- 15.8%
- Equity multiple
- 1.94×
- Total profit
- $20,962
- Equity at exit
- $39,155
- IRR
- 17.0%
- Equity multiple
- 3.67×
- Total profit
- $59,353
- Equity at exit
- $63,139
Cash invested: $22,260 (down + closing). Projections, not guarantees.
Landlord ↔ Tenant lean methodology
- Overall (STATE)
- 87 Strongly Landlord-Friendly
- State Texas
- 87 Strongly Landlord-Friendly · R+5
- County
- — inherits STATE
- City
- — inherits STATE
ZIP-level market 75568
- Home prices YoY
- 2.5%
- Active inventory
- 47
- Price-to-rent
- 7.8×
Monthly cashflow live
- Estimated rent
- $849 medium interval (Pro) →
- Mortgage (P&I)
- −$417
- Tax from tax record
- −$92 /mo · $1,107/yr
- Insurance
- −$33
- HOA
- −$0
- Vacancy / Maint / Mgmt
- −$178
- Net cashflow
- $128
Break-even live
UW: 25.0% down · 7.5% · 30yr · 1.5% tax · 5.0% vac · 8.0% maint · 8.0% mgmt
Financing live
Cash to close
- Down payment
- $19,875
- Closing costs
- $2,385
- Reserves months
- —
- Total cash needed
- —
Loan-product check · same deal, 3 products live
Conventional
25% down · 7.5% · 30yr
- Down + closing
- —
- Monthly P&I
- —
- Monthly cashflow
- —
- DSCR
- —
- Eligible?
- —
Personal DTI + credit; lowest rate.
DSCR
20% down · 8.5% · 30yr
- Down + closing
- —
- Monthly P&I
- —
- Monthly cashflow
- —
- DSCR
- —
- Eligible?
- —
No personal income docs; deal must DSCR.
Hard money
10% down · 12.0% · 12mo
- Down + closing
- —
- Monthly P&I
- —
- Monthly cashflow
- —
- DSCR
- —
- Eligible?
- —
Short-term bridge; refi at stabilization.
Listing history 8 events
-
2026-06-02days on market $79,500 Active 41 DOM
-
2026-06-01days on market $79,500 Active 40 DOM
-
2026-05-31days on market $79,500 Active 39 DOM
-
2026-05-30days on market $79,500 Active 38 DOM
-
2026-04-22$79,500 Active 810-char remark
Show marketing remark (810 chars)
Charming and full of character, this adorable 2-bedroom, 1-bath home sits on a spacious 0.56-acre lot, offering the perfect blend of cozy living and outdoor space. With 870 square feet, this “dollhouse” is ideal for anyone looking for a peaceful place to call home. Inside, you’ll find a warm and functional layout, complete with a gas stove for cooking enthusiasts. Outside, the property truly shines with a covered carport, storage building, and an additional metal outbuilding—perfect for hobbies, equipment, or extra storage. Surrounded by mature trees and plenty of yard space, this property offers both privacy and room to grow. Whether you’re enjoying quiet mornings on the porch or making use of the extra outdoor space, this home delivers comfort, charm, and versatility.
-
2007-05-25soldstatus $31,000
-
1988-12-08soldstatus
-
1987-03-26soldstatus
ⓘ Source: listings_history table (triggers on properties + properties_extension) + one-shot
backfill from property_details.listing_events for pre-trigger history.
Tax reassessment forecast TX · Resets to sale price
- Current annual tax
- $1,107 · $92/mo
- Projected year-2 tax
- $1,455 · $121/mo
- Expected delta
- +$348/yr (+$29/mo · 31.5%)
ⓘ Screening estimate from a state-policy table — verify with the county assessor before closing.
Climate risk First Street
- Flood 1/10 Low FEMA zone X · 0% chance over 30 yrs
- Wildfire 5/10 Major
- Heat 7/10 Severe 7 d/yr ≥111°F today · 21 d/yr by 30 yrs out
- Wind 6/10 Major 27% chance of damaging wind over 30 yrs
- Air quality 2/10 Low 1 unhealthy d/yr today · 1 by 30 yrs out
Nearby sold comps map
Loading sold comps map…
Walkable amenities ~0.75 mi
Loading nearby amenities…
Taxation est. · year 1
- Rental income
- $10,186
- − Mortgage interest
- −$4,453
- − Property taxes
- −$1,107
- − Insurance
- −$398
- − Repairs & maintenance
- −$815
- − Management
- −$815
- − Depreciation
- −$2,313
- Taxable income
- $286
- Est. tax owed @ 24.0%
- −$69
- After-tax cash flow
- $1,471/yr
For passive investors: Depreciation is non-cash, so a rental often shows a tax loss while cash-flowing — sheltering income. Rental losses are passive: they offset passive income freely, and up to $25,000/yr can offset ordinary (W-2) income if you actively participate and your MAGI is under $100k (phasing out to $0 by $150k); unused losses carry forward. On sale, claimed depreciation is recaptured at up to 25%, and gains may owe capital-gains tax (a 1031 exchange can defer both). Figures are a year-1 estimate at your 24.0% rate — not tax advice; consult a CPA.
Schools (NCES district)
- District
- Pewitt CISD
- NCES district ID
- 4834800
- Math proficiency
- 26% ▼ -3.00%
- Reading proficiency
- 40% ▲ 2.00%
- Median HH income
- $35,909
- Composite
- 27.29/100
- National rank
- #7005
- State rank
- #583 of 826 in TX
Livability — Naples
- Score
- 61/100
- State rank
- #986
- US rank
- #17571
Category grades
Schools grade is shown separately in the Schools card above.
Census & demographics
- Census place
- Naples, TX
- Population (ZIP)
- 2,271
Population outlook (Morris County) Hauer SSP2
- Today (2025)
- 11,628 people
- By 2030
- 11,126 · -4.3%
- By 2040
- 10,181 · -12.4%
- By 2050
- 9,408 · -19.1%
- By 2075
- 8,268 · -28.9%
- By 2100
- 7,463 · -35.8%
Race, ethnicity, and origin ACS 2023
- Neighborhood character
- Predominantly White (74%)
- Race & ethnicity
- White 74% Black 14% Hispanic / Latino 5% Two or more races 4% Native American 3% Asian 1%
- Hispanic origin (detail)
- Mexican 4%
- Common ancestry
- Lithuanian 1% Romanian 1% Slovak 1%
- Foreign-born
- 8% · Canada
- Languages at home
- 92% English-only · Spanish 5% German/W. Germanic 1% Other Asian/Pacific 1%
Political lean MEDSL · Morris
- 2024 margin
- Solid R (+51.2) · D 24.1% · R 75.3%
- 2008→2024 swing
- -30.2pp toward R · 2008: -21.0pp · 2024: -51.2pp
- All cycles
- 2024: R+51.2 2020: R+39.4 2016: R+40.6 2012: R+26.7 2008: R+21.0
Not yet ingested
- Civics
- —
Market trends
- HPI YoY
- ▲ 3.75%
- Current HPI
- 151.7508
- Rent YoY
- —
- Metro
- —
- State GDP YoY
- ▲ 3.95%
- F500 in state
- 110
Industry mix (Fortune 500 HQ in TX)
| Industry | F500 HQs | Revenue |
|---|---|---|
| Energy | 16 | $1,198B |
|
||
| Technology | 5 | $198B |
|
||
| Engineering / Construction | 4 | $72B |
|
||
| Energy Services | 3 | $60B |
|
||
| Utilities | 3 | $41B |
|
||
| Healthcare | 2 | $330B |
|
||
Price history
+156.5% since first listed4 events — show timeline
- 2026-04-22 Listed $79,500 GTAR
- 2007-05-25 Sold (Public Records) $31,000 Public Records
- 1988-12-08 Sold (Public Records) — Public Records
- 1987-03-26 Sold (Public Records) — Public Records
Property tax history
+4.3%/yrLatest (2025): $1,107 · +7.2% YoY. Source: county tax records.
Cash-flow waterfall
monthlySold comps — $/sqft
last 12 mo · ≤1 miLoading sold comps…