3855 Route 215 Hwy #3 · Springfield, PA
Flood risk 1/10 · Minimal
- FEMA flood zone
- X (unshaded)
- Chance of flooding over 30 yrs
- 0.0%
- Est. flood insurance / yr
- $473 – $860
Fire risk 1/10 · Minimal
- Est. fire insurance / yr
- $511 – $949
Heat risk 2/10 · Minimal
- Hot days now (above 93°F)
- 7 days/yr
- Hot days in 30 yrs
- 18 days/yr
Wind risk 1/10 · Minimal
- Chance of severe wind over 30 yrs
- —
Air-quality risk 3/10 · Minor
- Unhealthy air days now
- 2 days/yr
- Unhealthy air days in 30 yrs
- 4 days/yr
Risk factors via First Street. Map © Google.
Why this score? — see what drove the D+ grade
The composite is a weighted blend of 9 inputs, each scored 0–100. Each bar is that input's sub-score; the figure is the points it added to the 100-point composite (weight × sub-score).
- Cash flow +15.0/30.0
- ARV discount +7.5/15.0
- Appreciation +5.1/10.0
- 1% rule +5.0/10.0
- DSCR +5.0/10.0
- Schools +3.6/10.0
- Rent growth +2.5/5.0
- Livability +2.5/5.0
- Condition / age +2.2/5.0
$24,900
🖨 Deal sheet 📄 Offer letter ✓ Due diligence
Listing remarks MLS
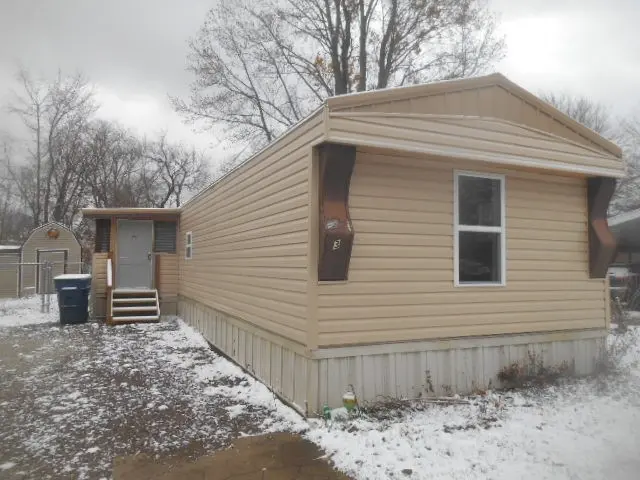
Nicely updated 2 bedroom, 2 bathroom home located in a quiet and well maintained mobile home park. Home offers new siding, windows, roof, updated kitchen and flooring. Also offers storage shed, enlcosed porch, and fenced in yard area.
Key facts
- New siding
- Storage shed
- Updated kitchen
Tags
Neighborhood map
What this means for you Summary
Snapshot
- This is a 2-bed/1.5-bath single-family listed at $25k. Condition is rated fair.
Deal economics
- At list price, monthly cash flow is $277 ($3k/yr) — positive.
- The deal already cash-flows at list — no discount required.
- Meets the 1% rule at list price ($1k rent vs $25k).
- Recommended offer: $22k (12.0% below list) — sets the bar for market timing.
Location & tenants
- Location reads: area grade D — affects rentability + tenant quality, not the cash-flow math above.
- Northwestern SD (town): math 35% / reading 48% proficiency, ranked #333 of 539 in PA (top 62%) — families likely to look elsewhere, expect single-tenant / working-renter base with shorter leases.
- Market conditions: 6 active listings in the ZIP; 364 units permitted in Erie County in 2024 (188 in 5+ unit buildings).
Forward outlook
- In year one you build about $232 of equity ($172 loan paydown + $60 appreciation (0.2% local appreciation)).
- Erie County population projected at -14% by 2050 — secular population decline; favor cash flow + early exit over multi-decade hold.
- At projected returns (0.2% appreciation + 3.0% rent growth), your $7k cash investment doubles in ~2 years — after that, you're playing with house money.
Negotiation context
- It's been on market 220 days — a 12% lower offer ($22k) is reasonable based on typical stale-listing flexibility.
Risks & watch-outs
- Watch-outs: HOA is 36% of rent.
Questions for the listing agent
- It's been on market 220 days. Have you received any prior offers? Is the seller open to a 12% concession, seller financing, or rate buy-down credit?
- Have any recent inspections been done? Can we get a copy of the seller's disclosures and any deferred-maintenance estimates?
- What does the HOA fee cover, when was the last increase, and are there any pending special assessments or reserve-fund shortfalls?
- Why hasn't it sold? Are there any deal-killer items the seller is aware of (foundation, flood, title, zoning, code violations)?
- Is there a deadline driving the sale (1031 exchange, divorce, estate, relocation)? That informs how much negotiation room exists.
- The area grade is low — what's the realistic commute time and amenity access for the typical tenant pool here? Any planned neighborhood developments (good or bad) we should know about?
- What's the average days-on-market for RENTAL listings here right now (not sales)? A rising rental-DOM trend means longer vacancies and softer asking-rent achievability than the comps imply.
- What's the recent tenant-quality profile in this submarket — average credit score on applications, eviction rate, late-payment / NSF rate, and stable-employment percentage? A property-management company in the area should have these aggregated.
- How much new for-sale + rental construction is in the pipeline within 1–3 miles? Heavy new supply typically softens prices + rents 12–24 months out; constrained supply supports both.
Investment metrics
- 1% rule
- 4.19% ✓
- Cap rate
- 19.62%
- Cash-on-cash
- 47.61%
- DSCR
- 3.12
- GRM
- 2.0
CMA / ARV
- ARV (median comp)
- $61,319
- List price
- $24,900
- Delta
- -59.39%
- Verdict
- UNDERPRICED
- Comps
- 5 within 1.0 mi
Show comp detail 1 sale within ~0.75 mi
| Address | Dist | Beds/Ba | Sqft | Sold | Price | $/sf | Match |
|---|---|---|---|---|---|---|---|
| 3855 Route 215 Hwy Unit A | 0.00mi | 2/2.0 | 952 (+2%) | 5mo | $40,000 | $42 | 92 |
Match score weights: distance 35% · size 25% · config 20% · recency 20%. Top-matched comps best support the ARV.
Projected returns pro-forma
0.24% appreciation · 3.0% rent growth · sell at horizon
- IRR
- 49.7%
- Equity multiple
- 3.50×
- Total profit
- $17,418
- Equity at exit
- $7,530
- IRR
- 52.3%
- Equity multiple
- 7.09×
- Total profit
- $42,441
- Equity at exit
- $9,295
Cash invested: $6,972 (down + closing). Projections, not guarantees.
Landlord ↔ Tenant lean methodology
- Overall (STATE)
- 62 Landlord-Friendly
- State Pennsylvania
- 62 Landlord-Friendly · EVEN
- County
- — inherits STATE
- City
- — inherits STATE
ZIP-level market 16411
- Home prices YoY
- 0.1%
- Active inventory
- 6
- Price-to-rent
- 2.0×
Monthly cashflow live
- Estimated rent
- $1,043 medium interval (Pro) →
- Mortgage (P&I)
- −$131
- Tax est. 1.5%
- −$31 /mo · $374/yr
- Insurance
- −$10
- HOA
- −$375
- Vacancy / Maint / Mgmt
- −$219
- Net cashflow
- $277
Break-even live
UW: 25.0% down · 7.5% · 30yr · 1.5% tax · 5.0% vac · 8.0% maint · 8.0% mgmt
Financing live
Cash to close
- Down payment
- $6,225
- Closing costs
- $747
- Reserves months
- —
- Total cash needed
- —
Loan-product check · same deal, 3 products live
Conventional
25% down · 7.5% · 30yr
- Down + closing
- —
- Monthly P&I
- —
- Monthly cashflow
- —
- DSCR
- —
- Eligible?
- —
Personal DTI + credit; lowest rate.
DSCR
20% down · 8.5% · 30yr
- Down + closing
- —
- Monthly P&I
- —
- Monthly cashflow
- —
- DSCR
- —
- Eligible?
- —
No personal income docs; deal must DSCR.
Hard money
10% down · 12.0% · 12mo
- Down + closing
- —
- Monthly P&I
- —
- Monthly cashflow
- —
- DSCR
- —
- Eligible?
- —
Short-term bridge; refi at stabilization.
HOA detail
- Monthly dues
- $375 · $4,500/yr
Listing history 15 events
-
2026-06-18days on market $24,900 Active 220 DOM
-
2026-06-17days on market $24,900 Active 219 DOM
-
2026-06-16days on market $24,900 Active 218 DOM
-
2026-06-15days on market $24,900 Active 217 DOM
-
2026-06-13days on market $24,900 Active 215 DOM
-
2026-06-12days on market $24,900 Active 214 DOM
-
2026-06-09days on market $24,900 Active 211 DOM
-
2026-06-08days on market $24,900 Active 210 DOM
-
2026-06-08days on market $24,900 Active 209 DOM
-
2026-06-07days on market $24,900 Active 208 DOM
-
2026-06-04days on market $24,900 Active 205 DOM
-
2026-06-02days on market $24,900 Active 204 DOM
-
2026-06-01days on market $24,900 Active 203 DOM
-
2026-05-31days on market $24,900 Active 202 DOM
-
2025-11-07$24,900 Active 234-char remark
Show marketing remark (234 chars)
Nicely updated 2 bedroom, 2 bathroom home located in a quiet and well maintained mobile home park. Home offers new siding, windows, roof, updated kitchen and flooring. Also offers storage shed, enlcosed porch, and fenced in yard area.
ⓘ Source: listings_history table (triggers on properties + properties_extension) + one-shot
backfill from property_details.listing_events for pre-trigger history.
Climate risk First Street
- Flood 1/10 Low FEMA zone X (unshaded) · 0% chance over 30 yrs
- Wildfire 1/10 Low
- Heat 2/10 Low 7 d/yr ≥93°F today · 18 d/yr by 30 yrs out
- Wind 1/10 Low
- Air quality 3/10 Moderate 2 unhealthy d/yr today · 4 by 30 yrs out
Nearby sold comps map
Loading sold comps map…
Walkable amenities ~0.75 mi
Loading nearby amenities…
Taxation est. · year 1
- Rental income
- $12,512
- − Mortgage interest
- −$1,395
- − Property taxes
- −$374
- − Insurance
- −$124
- − Repairs & maintenance
- −$1,001
- − Management
- −$1,001
- − HOA
- −$4,500
- − Depreciation
- −$724
- Taxable income
- $3,393
- Est. tax owed @ 24.0%
- −$814
- After-tax cash flow
- $2,505/yr
For passive investors: Depreciation is non-cash, so a rental often shows a tax loss while cash-flowing — sheltering income. Rental losses are passive: they offset passive income freely, and up to $25,000/yr can offset ordinary (W-2) income if you actively participate and your MAGI is under $100k (phasing out to $0 by $150k); unused losses carry forward. On sale, claimed depreciation is recaptured at up to 25%, and gains may owe capital-gains tax (a 1031 exchange can defer both). Figures are a year-1 estimate at your 24.0% rate — not tax advice; consult a CPA.
Condition & rehab AI · 6 photos
This mobile home requires extensive repairs to its exterior and systems, significantly impacting its value. Immediate repairs are needed to address major damage to siding, windows, and roof. Once repaired, it could be a good investment for a renovation project.
Repairs flagged
- Major siding — Significant damage
- Major windows — Significant damage
- Major roof — No visible damage, but siding condition suggests underlying issues
Value-add opportunities
- Both repair and replace siding — Improves both appearance and structural integrity
- Both repair and replace windows — Enhances curb appeal and energy efficiency
- Both repair and replace roof — Fixes underlying issues and improves structural integrity
Renovation cost estimate screening
| Repair item | Severity | Est. cost |
|---|---|---|
| siding · Significant damage | Major | $15,000–50,000 |
| windows · Significant damage | Major | $15,000–50,000 |
| roof · No visible damage, but siding condition suggests underlying issues | Major | $15,000–50,000 |
| Total estimated repair cost · 3 items | $45,000–150,000 |
Value-add ROI direction
- Both repair and replace siding — Improves both appearance and structural integrity ↑
- Both repair and replace windows — Enhances curb appeal and energy efficiency ↑
- Both repair and replace roof — Fixes underlying issues and improves structural integrity ↑
ⓘ Cost ranges are severity-bucket heuristics (US national rule-of-thumb). Get contractor quotes + a written scope before underwriting a rehab budget.
Schools (NCES district)
- District
- Northwestern SD
- NCES district ID
- 4217880
- Math proficiency
- 35% ▼ -24.00%
- Reading proficiency
- 48% ▼ -22.00%
- Median HH income
- $48,180
- Composite
- 35.51/100
- National rank
- #4912
- State rank
- #333 of 539 in PA
Livability — Springfield
No livability data for this city. (Only ~50 U.S. cities are tracked.)
Census & demographics
- County
- Erie · 6,299 people
- Metro
- Erie, PA
- Population (ZIP)
- 1,287
- Household income
- $67,000
- Rent vs Own
Population outlook (Erie County) Hauer SSP2
- Today (2025)
- 272,159 people
- By 2030
- 266,299 · -2.2%
- By 2040
- 250,987 · -7.8%
- By 2050
- 234,925 · -13.7%
- By 2075
- 199,164 · -26.8%
- By 2100
- 162,985 · -40.1%
Race, ethnicity, and origin ACS 2023
- Neighborhood character
- Predominantly White (97%)
- Race & ethnicity
- White 97% Two or more races 2%
- Common ancestry
- Slovak 5% Romanian 5% Italian 2%
- Foreign-born
- 3%
- Languages at home
- 99% English-only · German/W. Germanic 1%
Political lean MEDSL · Erie
- 2024 margin
- Toss-up / Even · D 49.0% · R 50.0%
- 2008→2024 swing
- -20.9pp toward R · 2008: 19.9pp · 2024: -1.0pp
- All cycles
- 2024: R+1.0 2020: D+1.0 2016: R+2.0 2012: D+16.9 2008: D+19.9
Not yet ingested
- Civics
- —
Market trends
- HPI YoY
- ▲ 0.24%
- Current HPI
- 235.3549
- Rent YoY
- —
- Metro
- —
- State GDP YoY
- ▲ 1.68%
- F500 in state
- 34
Industry mix (Fortune 500 HQ in PA)
| Industry | F500 HQs | Revenue |
|---|---|---|
| Healthcare | 2 | $309B |
|
||
| Insurance | 2 | $27B |
|
||
| Telecommunications / Media | 1 | $124B |
|
||
| Industrial Distribution | 1 | $22B |
|
||
| Financial Services | 1 | $20B |
|
||
| Chemicals / Materials | 1 | $18B |
|
||
Price history
1 event — show timeline
- 2025-11-07 Listed $24,900 GEBOR
Cash-flow waterfall
monthlySold comps — $/sqft
last 12 mo · ≤1 miLoading sold comps…