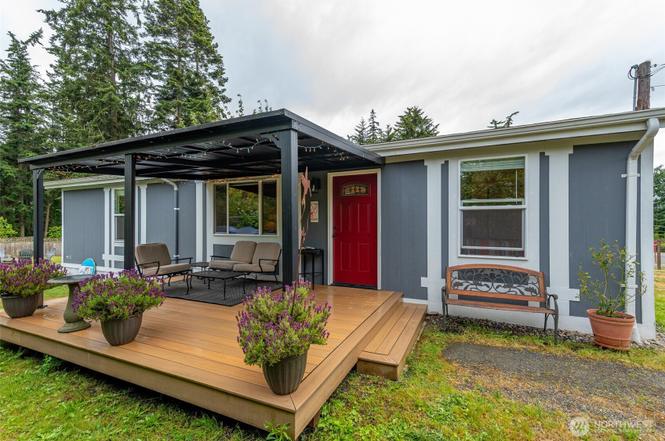
1030 Timber Ln · Freeland, WA
Flood risk 1/10 · Minimal
- FEMA flood zone
- X (unshaded)
- Chance of flooding over 30 yrs
- 0.0%
- Est. flood insurance / yr
- $507 – $1,088
Fire risk 3/10 · Minor
- Est. fire insurance / yr
- $604 – $1,122
Heat risk 3/10 · Minor
- Hot days now (above 83°F)
- 8 days/yr
- Hot days in 30 yrs
- 19 days/yr
Wind risk 1/10 · Minimal
- Chance of severe wind over 30 yrs
- —
Air-quality risk 6/10 · Moderate
- Unhealthy air days now
- 8 days/yr
- Unhealthy air days in 30 yrs
- 9 days/yr
Risk factors via First Street. Map © Google.
Why this score? — see what drove the D grade
The composite is a weighted blend of 9 inputs, each scored 0–100. Each bar is that input's sub-score; the figure is the points it added to the 100-point composite (weight × sub-score).
- Cash flow +13.3/30.0
- ARV discount +7.5/15.0
- Schools +5.0/10.0
- DSCR +4.0/10.0
- Livability +3.2/5.0
- 1% rule +2.7/10.0
- Rent growth +2.5/5.0
- Condition / age +2.5/5.0
- Appreciation +0.0/10.0
$425,000
🖨 Deal sheet (PDF) 📄 Offer letter ✓ Due diligence
Listing remarks
Embrace the ultimate Whidbey Island lifestyle in this beautifully updated Mutiny Bay home which offers private, deeded beach access to the "sugar sands" of Mutiny Bay just blocks from your front door. Built with 2 bedrooms and an office/den on a 2 bedroom septic system, a studs-out remodel was completed in 2017 for modern efficiency with coastal convenience. The bright, open-concept layout welcomes you with bamboo and tile flooring, creating a seamless flow perfect for everyday living or entertaining. The kitchen features quartz countertops and stainless steel appliances. Retreat to the spacious primary suite with a walk-in closet and a five-piece bath featuring a corner tub
Key facts
- Deeded beach access
- Wired for generator
- Walk-in closet
Tags
Property features AI
Finance
- Other: Lot size approximately 0.19 acre (lot dimensions 60 x 138 x 60 x 138); Lot number 34; Located in county jurisdiction; listed condition: Good
- Financial info: Financing accepted: Cash, Conventional, FHA, USDA, VA
- HOA & community: Community features include boat launch and CCRs
Exterior
- Parking: Driveway; 3 uncovered parking spaces
- Security: Partially fenced
- Utilities: Electric energy source; Community water (Cascadia Water); Septic tank sewer; Power provided by PSE
- Home design: Manufactured home on land (Double wide); Palm Harbor make; One story; Main entry; East-facing
- Construction: Cement plank (fiber cement) siding; Composition roof; Built on block and slab foundation; Manufactured (Double wide) style
- Exterior features: Deck; Partially fenced yard; Outbuildings; Cement planked exterior; Level to partially sloped topography; Dead-end paved street
Interior
- Kitchen: Dishwasher; Microwave; Refrigerator
- Bedrooms: 2 bedrooms (both on main level)
- Flooring: Bamboo or cork; Ceramic tile; Vinyl
- Bathrooms: 2 full bathrooms; 2 bathtubs; 2 showers
- Heating & cooling: Ductless heating; Has heating; Has cooling
- Interior features: Jetted tub; Vaulted ceilings; Walk-in closets; Water heater; Wired for generator; Partially fenced (security feature)
- Laundry & utility: Washer; Dryer; Electric water heater (located in bedroom closet)
Neighborhood map
What this means for you Summary
Snapshot
- This is a 2-bed/2.0-bath single-family listed at $425k.
Deal economics
- At list price, monthly cash flow is $-1 ($-17/yr) — negative.
- To cash-flow at today's rent, offer at most $425k (0.1% below list).
- To meet the 1% rule (rent ≥ 1% of price), the offer needs to be $329k (22.7% below list).
- Recommended offer: $329k (22.7% below list) — sets the bar for 1% rule.
- Cap rate 6.3% vs local median 1.9% in Freeland — top-decile yield for the area; either an underpriced asset or a hidden risk that comps aren't pricing in. Stress-test before assuming the spread holds.
Location & tenants
- Location reads 64/100 on livability (#367 in WA) — a middle-class / working-renter tenant base. Strengths: crime A+, employment A+, housing A; Watch: health & safety C-, amenities F, commute F.
- South Whidbey School District (rural): math 47% / reading 64% proficiency, ranked #87 of 291 in WA (top 30%) — acceptable for families but not a draw, mixed tenant base, ~2y average lease.
- Zoned schools: South Whidbey Elementary (571 students, 35% FRL); South Whidbey Middle (204 students, 41% FRL); South Whidbey High School (384 students, 30% FRL).
- Market conditions: 102 active listings in the ZIP; 1 comparable units currently listed for rent nearby; 402 units permitted in Island County in 2024 (54 in 5+ unit buildings).
Forward outlook
- Local home prices are declining (-3.0%/yr); year-one equity from $3k of loan paydown is wiped out by about $13k of value loss. Plan a longer hold.
- Island County population projected to shrink 6% by 2050 — rents likely to lag national; underwrite the cash flow, not the appreciation.
Negotiation context
- Only 10 days on market — expect competitive offers; lowballing is unlikely to land.
- 4 sale attempts since 10y ago with the ask held roughly flat each time — persistent listings suggest the price (not the market) is what's stuck; bring a comps-based counter.
Questions for the listing agent
- What do current leases actually rent for vs. the listed asking? Can we see a recent rent roll and the last 12 months of T-12 income?
- Is there a deadline driving the sale (1031 exchange, divorce, estate, relocation)? That informs how much negotiation room exists.
- Schools are F-rated, which usually means shorter tenancies and higher turnover. Who's the typical renter profile here, and what's been the actual vacancy rate?
- The area grade is low — what's the realistic commute time and amenity access for the typical tenant pool here? Any planned neighborhood developments (good or bad) we should know about?
- What's the average days-on-market for RENTAL listings here right now (not sales)? A rising rental-DOM trend means longer vacancies and softer asking-rent achievability than the comps imply.
- What's the recent tenant-quality profile in this submarket — average credit score on applications, eviction rate, late-payment / NSF rate, and stable-employment percentage? A property-management company in the area should have these aggregated.
- How much new for-sale + rental construction is in the pipeline within 1–3 miles? Heavy new supply typically softens prices + rents 12–24 months out; constrained supply supports both.
Investment metrics
- 1% rule
- 0.77% ✗
- Cap rate
- 6.29%
- Cash-on-cash
- -0.01%
- DSCR
- 1.00
- GRM
- 10.8
CMA / ARV
No comps found within radius.
Projected returns pro-forma
-3.0% appreciation · 3.0% rent growth · sell at horizon
- IRR
- -16.4%
- Equity multiple
- 0.42×
- Total profit
- $-69,115
- Equity at exit
- $63,369
- IRR
- -8.2%
- Equity multiple
- 0.49×
- Total profit
- $-60,944
- Equity at exit
- $36,746
Cash invested: $119,000 (down + closing). Projections, not guarantees.
Landlord ↔ Tenant lean methodology
- Overall (STATE)
- 28 Tenant-Leaning
- State Washington
- 28 Tenant-Leaning · D+8
- County
- — inherits STATE
- City
- — inherits STATE
ZIP-level market 98249
- Active inventory
- 102
- Price-to-rent
- 10.8×
Monthly cashflow live
- Estimated rent
- $3,286 medium interval (Pro) →
- Mortgage (P&I)
- −$2,229
- Tax from tax record
- −$191 /mo · $2,298/yr
- Insurance
- −$177
- HOA
- −$0
- Vacancy / Maint / Mgmt
- −$690
- Net cashflow
- $-1
Break-even live
Sensitivity live
| Price | -10% $239 | -5% $119 | +0% $-1 | +5% $-122 | +10% $-242 |
|---|---|---|---|---|---|
| Rent | -10% $-261 | -5% $-131 | +0% $-1 | +5% $128 | +10% $258 |
| Rate | -1.0pp $213 | -0.5pp $107 | base $-1 | +0.5pp $-112 | +1.0pp $-224 |
UW: 25.0% down · 7.5% · 30yr · 1.5% tax · 5.0% vac · 8.0% maint · 8.0% mgmt
Financing live
Cash to close
- Down payment
- $106,250
- Closing costs
- $12,750
- Reserves months
- —
- Total cash needed
- —
Loan-product check · same deal, 3 products live
Conventional
25% down · 7.5% · 30yr
- Down + closing
- —
- Monthly P&I
- —
- Monthly cashflow
- —
- DSCR
- —
- Eligible?
- —
Personal DTI + credit; lowest rate.
DSCR
20% down · 8.5% · 30yr
- Down + closing
- —
- Monthly P&I
- —
- Monthly cashflow
- —
- DSCR
- —
- Eligible?
- —
No personal income docs; deal must DSCR.
Hard money
10% down · 12.0% · 12mo
- Down + closing
- —
- Monthly P&I
- —
- Monthly cashflow
- —
- DSCR
- —
- Eligible?
- —
Short-term bridge; refi at stabilization.
Rent comps 1 comps
| Address | Beds | Baths | Sqft | Rent | $/sqft | DOM | Units | Dist |
|---|---|---|---|---|---|---|---|---|
| 474 Vista Rd Unit 1545828P Freeland, WA | 3.0 | 2.0 | 1345 | $3,286 | $2.44 | 15d | 1 | 1.48mi |
Listing history 9 events
-
2026-06-22days on market $425,000 Active 10 DOM
-
2026-06-19days on market $425,000 Active 8 DOM
-
2026-06-18days on market $425,000 Active 7 DOM
-
2026-06-17days on market $425,000 Active 6 DOM
-
2026-06-16days on market $425,000 Active 5 DOM
-
2026-06-15days on market $425,000 Active 4 DOM
-
2026-06-14days on market $425,000 Active 2 DOM
-
2026-06-13remarks 689-char remark
-
2026-06-13$425,000 Active 1 DOM
ⓘ Source: listings_history table (triggers on properties + properties_extension) + one-shot
backfill from property_details.listing_events for pre-trigger history.
Tax reassessment forecast WA · Resets to sale price
- Current annual tax
- $2,298 · $191/mo
- Projected year-2 tax
- $4,165 · $347/mo
- Expected delta
- +$1,867/yr (+$156/mo · 81.3%)
ⓘ Screening estimate from a state-policy table — verify with the county assessor before closing.
Climate risk First Street
- Flood 1/10 Low FEMA zone X (unshaded) · 0% chance over 30 yrs
- Wildfire 3/10 Moderate
- Heat 3/10 Moderate 8 d/yr ≥83°F today · 19 d/yr by 30 yrs out
- Wind 1/10 Low
- Air quality 6/10 Major 8 unhealthy d/yr today · 9 by 30 yrs out
Nearby sold comps map
Loading sold comps map…
Walkable amenities ~0.75 mi
Loading nearby amenities…
Taxation est. · year 1
- Rental income
- $39,432
- − Mortgage interest
- −$23,807
- − Property taxes
- −$2,298
- − Insurance
- −$2,125
- − Repairs & maintenance
- −$3,155
- − Management
- −$3,155
- − Depreciation
- −$12,364
- Taxable loss
- −$7,470
- Est. tax savings @ 24.0%
- +$1,793
- After-tax cash flow
- $1,776/yr
For passive investors: Depreciation is non-cash, so a rental often shows a tax loss while cash-flowing — sheltering income. Rental losses are passive: they offset passive income freely, and up to $25,000/yr can offset ordinary (W-2) income if you actively participate and your MAGI is under $100k (phasing out to $0 by $150k); unused losses carry forward. On sale, claimed depreciation is recaptured at up to 25%, and gains may owe capital-gains tax (a 1031 exchange can defer both). Figures are a year-1 estimate at your 24.0% rate — not tax advice; consult a CPA.
Schools (NCES district)
- District
- South Whidbey School District
- NCES district ID
- 5308190
- Math proficiency
- 47% ▲ 2.00%
- Reading proficiency
- 64% ▲ 4.00%
- Median HH income
- $62,601
- Composite
- 50.31/100
- National rank
- #4050
- State rank
- #87 of 291 in WA
Livability — Freeland
- Score
- 64/100
- State rank
- #367
- US rank
- #13986
Category grades
Schools grade is shown separately in the Schools card above.
Census & demographics
- Census place
- Freeland, WA
- City population
- 4,531
- Population (ZIP)
- 4,531
Population outlook (Island County) Hauer SSP2
- Today (2025)
- 82,019 people
- By 2030
- 81,329 · -0.8%
- By 2040
- 78,552 · -4.2%
- By 2050
- 77,042 · -6.1%
- By 2075
- 80,799 · -1.5%
- By 2100
- 84,451 · +3.0%
Race, ethnicity, and origin ACS 2023
- Neighborhood character
- Predominantly White (88%)
- Race & ethnicity
- White 88% Two or more races 8% Hispanic / Latino 5% Native American 2% Black 1%
- Common ancestry
- Slovak 7% Iranian 5% Portuguese 5%
- Foreign-born
- 5% · Canada
- Languages at home
- 94% English-only · Spanish 2% Other Indo-European 2% Arabic 1%
Political lean MEDSL · Island
- 2024 margin
- D (+16.6) · D 56.8% · R 40.3% · Other 2.9%
- 2008→2024 swing
- +10.3pp toward D · 2008: 6.2pp · 2024: 16.6pp
- All cycles
- 2024: D+16.6 2020: D+12.0 2016: D+5.9 2012: D+4.4 2008: D+6.2
Not yet ingested
- Civics
- —
Market trends
- HPI YoY
- ▼ -333.80%
- Current HPI
- 208.0961
- Rent YoY
- —
- Metro
- —
- State GDP YoY
- ▲ 4.65%
- F500 in state
- 22
Industry mix (Fortune 500 HQ in WA)
| Industry | F500 HQs | Revenue |
|---|---|---|
| Retail | 2 | $269B |
|
||
| Technology / Retail | 1 | $638B |
|
||
| Technology | 1 | $245B |
|
||
| Telecommunications | 1 | $38B |
|
||
| Food / Beverage | 1 | $36B |
|
||
| Automotive / Trucks | 1 | $34B |
|
||
Price history
+1319.0% since first listed14 events — show timeline
- 2026-06-11 Listed $425,000 NWMLS as Distributed by MLS Grid
- 2022-06-24 Sold (MLS) $375,000 NWMLS as Distributed by MLS Grid
- 2022-05-17 Pending — NWMLS as Distributed by MLS Grid
- 2022-05-12 Listed $365,000 NWMLS as Distributed by MLS Grid
- 2017-06-09 Sold (Public Records) $199,000 Public Records
- 2017-06-09 Sold (MLS) $199,000 NWMLS as Distributed by MLS Grid
- 2017-05-10 Pending — NWMLS as Distributed by MLS Grid
- 2017-04-27 Pending — NWMLS as Distributed by MLS Grid
- 2017-04-20 Listed $199,000 NWMLS as Distributed by MLS Grid
- 2016-03-25 Sold (MLS) $21,165 NWMLS as Distributed by MLS Grid
- 2016-03-08 Pending — NWMLS as Distributed by MLS Grid
- 2016-03-01 Pending — NWMLS as Distributed by MLS Grid
- 2016-02-13 Listed $24,900 NWMLS as Distributed by MLS Grid
- 1993-09-01 Sold (Public Records) $29,950 Public Records
Property tax history
+18.7%/yrLatest (2026): $2,298 · +16.7% YoY. Source: county tax records.
Cash-flow waterfall
monthlySold comps — $/sqft
last 12 mo · ≤1 miLoading sold comps…