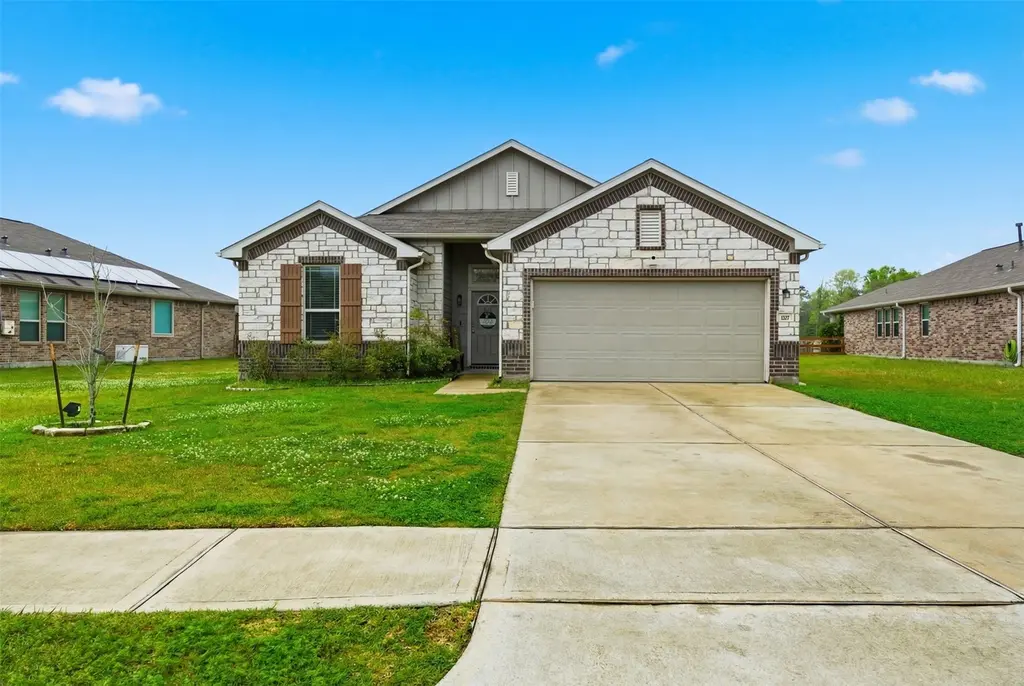
527 Kickapoo Dr · Anahuac, TX
Flood risk 6/10 · Moderate
- FEMA flood zone
- X (unshaded)
- Chance of flooding over 30 yrs
- 0.68%
- Est. flood insurance / yr
- $507 – $1,088
Fire risk 6/10 · Moderate
- Est. fire insurance / yr
- $1,222 – $2,270
Heat risk 9/10 · Severe
- Hot days now (above 111°F)
- 7 days/yr
- Hot days in 30 yrs
- 25 days/yr
Wind risk 9/10 · Severe
- Chance of severe wind over 30 yrs
- 99.0%
Air-quality risk 2/10 · Minimal
- Unhealthy air days now
- 1 days/yr
- Unhealthy air days in 30 yrs
- 1 days/yr
Risk factors via First Street. Map © Google.
Why this score? — see what drove the D grade
The composite is a weighted blend of 9 inputs, each scored 0–100. Each bar is that input's sub-score; the figure is the points it added to the 100-point composite (weight × sub-score).
- ARV discount +13.3/15.0
- Cash flow +10.2/30.0
- 1% rule +3.9/10.0
- Schools +3.5/10.0
- Livability +3.5/5.0
- DSCR +2.9/10.0
- Rent growth +2.5/5.0
- Condition / age +2.5/5.0
- Appreciation +0.0/10.0
$275,000
🖨 Deal sheet (PDF) 📄 Offer letter ✓ Due diligence
Listing remarks
Beautiful home located in the growing Cypress Point community in Anahuac. This property offers a spacious layout with modern finishes, open-concept living, and a family-friendly neighborhood. Conveniently located near local schools, parks, and easy access to major highways, making commuting simple. Great opportunity for buyers looking for comfort, space, and small-town charm.
Key facts
- Small-town charm
- Near parks
- Open-concept living
Tags
Property features AI
Finance
- Other: Property listed by Vive Realty LLC
- HOA & community: Prestige HOA with annual fee of $700
Exterior
- Parking: Attached 2-car garage
- Utilities: Public water; Public sewer
- Home design: Residential property; Built in 2021; Single-level entry on slab foundation
- Construction: Brick and cement siding construction; Composition roof; Slab foundation
- Exterior features: Subdivision lot; Lot approximately 0.28 acres
Interior
- Bedrooms: Primary bedroom on the first floor (approx. 12x12); Three additional bedrooms on the first floor (each approx. 10x10); All bedrooms located on the first floor
- Bathrooms: 2 full bathrooms
- Heating & cooling: Central heating (gas); Central electric air conditioning
- Interior features: Living room; Dining room; 6 total rooms
Neighborhood map
What this means for you Summary
Snapshot
- This is a 4-bed/2.0-bath single-family listed at $275k.
Deal economics
- At list price, monthly cash flow is $-154 ($-2k/yr) — negative.
- To cash-flow at today's rent, offer at most $248k (9.9% below list).
- To meet the 1% rule (rent ≥ 1% of price), the offer needs to be $244k (11.1% below list).
- Recommended offer: $244k (11.1% below list) — sets the bar for 1% rule.
- Cap rate 5.6% vs local median 3.9% in Anahuac — top-decile yield for the area; either an underpriced asset or a hidden risk that comps aren't pricing in. Stress-test before assuming the spread holds.
Location & tenants
- Location reads 70/100 on livability (#365 in TX) — a middle-class / working-renter tenant base. Strengths: cost of living A+, housing A+, crime A; Watch: employment C-, amenities F, commute F.
- Anahuac ISD (rural): math 41% / reading 41% proficiency, ranked #373 of 826 in TX (top 45%) — families likely to look elsewhere, expect single-tenant / working-renter base with shorter leases.
- Zoned schools: Anahuac El (math 31% / reading 25%, grade F, #2,740 of 4,322 statewide, top 64%, 713 students, 64% FRL); Anahuac Middle (math 52% / reading 46%, grade C-, #378 of 1,662 statewide, top 23%, 326 students, 61% FRL); Anahuac H S (math 37% / reading 62%, grade D, #509 of 1,632 statewide, top 34%, 454 students, 58% FRL).
- Market conditions: 145 active listings in the ZIP; 629 units permitted in Chambers County in 2024 (0 in 5+ unit buildings).
Forward outlook
- Local home prices are declining (-3.0%/yr); year-one equity from $2k of loan paydown is wiped out by about $8k of value loss. Plan a longer hold.
- Chambers County population projected at +46% by 2050 — long-run rental-demand tailwind backs the buy-and-hold thesis.
Negotiation context
- Only 4 days on market — expect competitive offers; lowballing is unlikely to land.
Risks & watch-outs
- Climate carrying-cost: major flood risk; severe wind risk, 99% chance of damaging wind over 30y; major wildfire risk; extreme-heat days projected 7→25/yr by 2055 (HVAC capex compounding) — expect insurance premiums to compound above CPI over the hold.
Questions for the listing agent
- What do current leases actually rent for vs. the listed asking? Can we see a recent rent roll and the last 12 months of T-12 income?
- What does the HOA fee cover, when was the last increase, and are there any pending special assessments or reserve-fund shortfalls?
- Is there a deadline driving the sale (1031 exchange, divorce, estate, relocation)? That informs how much negotiation room exists.
- The area grade is low — what's the realistic commute time and amenity access for the typical tenant pool here? Any planned neighborhood developments (good or bad) we should know about?
- What's the average days-on-market for RENTAL listings here right now (not sales)? A rising rental-DOM trend means longer vacancies and softer asking-rent achievability than the comps imply.
- What's the recent tenant-quality profile in this submarket — average credit score on applications, eviction rate, late-payment / NSF rate, and stable-employment percentage? A property-management company in the area should have these aggregated.
- How much new for-sale + rental construction is in the pipeline within 1–3 miles? Heavy new supply typically softens prices + rents 12–24 months out; constrained supply supports both.
Investment metrics
- 1% rule
- 0.89% ✗
- Cap rate
- 5.62%
- Cash-on-cash
- -2.40%
- DSCR
- 0.89
- GRM
- 9.4
CMA / ARV
- ARV (on-the-fly)
- $315,898
- Comps found
- 12
Show comp detail 12 sales within ~0.75 mi
| Address | Dist | Beds/Ba | Sqft | Sold | Price | $/sf | Match |
|---|---|---|---|---|---|---|---|
| 115 Alder Loop | 0.16mi | 4/2.0 | 1,890 (-1%) | 2mo | $275,000 | $146 | 90 |
| 605 Little Spring Ct | 0.21mi | 3/2.0 (-1) | 1,973 (+4%) | 6mo | $327,000 | $166 | 75 |
| 402 Rocky Ridge Dr | 0.23mi | 4/2.0 | 1,800 (-5%) | 8mo | $289,900 | $161 | 74 |
| 222 Kickapoo Dr | 0.35mi | 4/2.0 | 1,797 (-6%) | 2mo | $282,500 | $157 | 73 |
| 221 Big Spgs | 0.43mi | 4/2.0 | 1,796 (-6%) | 0mo | $289,000 | $161 | 70 |
| 126 Peachleaf Ct | 0.20mi | 3/2.0 (-1) | 2,013 (+6%) | 7mo | $345,000 | $171 | 70 |
| 302 Alder Loop | 0.08mi | 5/3.0 (+1) | 2,082 (+9%) | 2mo | $349,000 | $168 | 70 |
| 400 Little Spring Ct | 0.32mi | 3/2.0 (-1) | 1,992 (+5%) | 5mo | $335,000 | $168 | 68 |
| 111 Bunker Hill Ct | 0.51mi | 4/2.0 | 1,793 (-6%) | 2mo | $284,900 | $159 | 65 |
| 310 Little Spring Ct | 0.38mi | 3/2.0 (-1) | 1,992 (+5%) | 8mo | $335,000 | $168 | 63 |
| 318 Little Spring Ct | 0.36mi | 3/2.0 (-1) | 1,992 (+5%) | 11mo | $335,000 | $168 | 61 |
| 513 Little Spring Ct | 0.24mi | 3/2.0 (-1) | 2,158 (+13%) | 0mo | $345,000 | $160 | 61 |
Match score weights: distance 35% · size 25% · config 20% · recency 20%. Top-matched comps best support the ARV.
Projected returns pro-forma
-3.0% appreciation · 3.0% rent growth · sell at horizon
- IRR
- -20.2%
- Equity multiple
- 0.30×
- Total profit
- $-54,235
- Equity at exit
- $41,003
- IRR
- -13.1%
- Equity multiple
- 0.23×
- Total profit
- $-59,264
- Equity at exit
- $23,777
Cash invested: $77,000 (down + closing). Projections, not guarantees.
Landlord ↔ Tenant lean methodology
- Overall (STATE)
- 87 Strongly Landlord-Friendly
- State Texas
- 87 Strongly Landlord-Friendly · R+5
- County
- — inherits STATE
- City
- — inherits STATE
ZIP-level market 77514
- Home prices YoY
- -23.3%
- Active inventory
- 145
- Price-to-rent
- 9.4×
Monthly cashflow live
- Estimated rent
- $2,445 medium interval (Pro) →
- Mortgage (P&I)
- −$1,442
- Tax from tax record
- −$471 /mo · $5,652/yr
- Insurance
- −$115
- HOA
- −$58
- Vacancy / Maint / Mgmt
- −$513
- Net cashflow
- $-154
Break-even live
Sensitivity live
| Price | -10% $1 | -5% $-76 | +0% $-154 | +5% $-232 | +10% $-310 |
|---|---|---|---|---|---|
| Rent | -10% $-347 | -5% $-251 | +0% $-154 | +5% $-58 | +10% $39 |
| Rate | -1.0pp $-16 | -0.5pp $-84 | base $-154 | +0.5pp $-226 | +1.0pp $-298 |
UW: 25.0% down · 7.5% · 30yr · 1.5% tax · 5.0% vac · 8.0% maint · 8.0% mgmt
Financing live
Cash to close
- Down payment
- $68,750
- Closing costs
- $8,250
- Reserves months
- —
- Total cash needed
- —
Loan-product check · same deal, 3 products live
Conventional
25% down · 7.5% · 30yr
- Down + closing
- —
- Monthly P&I
- —
- Monthly cashflow
- —
- DSCR
- —
- Eligible?
- —
Personal DTI + credit; lowest rate.
DSCR
20% down · 8.5% · 30yr
- Down + closing
- —
- Monthly P&I
- —
- Monthly cashflow
- —
- DSCR
- —
- Eligible?
- —
No personal income docs; deal must DSCR.
Hard money
10% down · 12.0% · 12mo
- Down + closing
- —
- Monthly P&I
- —
- Monthly cashflow
- —
- DSCR
- —
- Eligible?
- —
Short-term bridge; refi at stabilization.
HOA detail
- Monthly dues
- $58 · $696/yr
Listing history 3 events
-
2026-06-21days on market $275,000 Active 4 DOM
-
2026-06-18remarks 378-char remark
-
2026-06-18$275,000 Active 1 DOM
ⓘ Source: listings_history table (triggers on properties + properties_extension) + one-shot
backfill from property_details.listing_events for pre-trigger history.
Tax reassessment forecast TX · Resets to sale price
- Current annual tax
- $5,652 · $471/mo
- Projected year-2 tax
- $5,652 · $471/mo
- Expected delta
- $0/yr ($0/mo · 0.0%)
ⓘ Screening estimate from a state-policy table — verify with the county assessor before closing.
Climate risk First Street
- Flood 6/10 Major FEMA zone X (unshaded) · 68% chance over 30 yrs
- Wildfire 6/10 Major
- Heat 9/10 Extreme 7 d/yr ≥111°F today · 25 d/yr by 30 yrs out
- Wind 9/10 Extreme 99% chance of damaging wind over 30 yrs
- Air quality 2/10 Low 1 unhealthy d/yr today · 1 by 30 yrs out
Nearby sold comps map
Loading sold comps map…
Walkable amenities ~0.75 mi
Loading nearby amenities…
Taxation est. · year 1
- Rental income
- $29,338
- − Mortgage interest
- −$15,404
- − Property taxes
- −$5,652
- − Insurance
- −$1,375
- − Repairs & maintenance
- −$2,347
- − Management
- −$2,347
- − HOA
- −$696
- − Depreciation
- −$8,000
- Taxable loss
- −$6,483
- Est. tax savings @ 24.0%
- +$1,556
- After-tax cash flow
- $-295/yr
For passive investors: Depreciation is non-cash, so a rental often shows a tax loss while cash-flowing — sheltering income. Rental losses are passive: they offset passive income freely, and up to $25,000/yr can offset ordinary (W-2) income if you actively participate and your MAGI is under $100k (phasing out to $0 by $150k); unused losses carry forward. On sale, claimed depreciation is recaptured at up to 25%, and gains may owe capital-gains tax (a 1031 exchange can defer both). Figures are a year-1 estimate at your 24.0% rate — not tax advice; consult a CPA.
Schools (NCES district)
- District
- Anahuac ISD
- NCES district ID
- 4808190
- Math proficiency
- 41% ▼ -22.00%
- Reading proficiency
- 41% ▼ -7.00%
- Median HH income
- $46,714
- Composite
- 35.02/100
- National rank
- #5043
- State rank
- #373 of 826 in TX
Livability — Anahuac
- Score
- 70/100
- State rank
- #365
- US rank
- #7791
Category grades
Schools grade is shown separately in the Schools card above.
Census & demographics
- Population (ZIP)
- 5,213
Population outlook (Chambers County) Hauer SSP2
- Today (2025)
- 46,946 people
- By 2030
- 51,094 · +8.8%
- By 2040
- 59,578 · +26.9%
- By 2050
- 68,318 · +45.5%
- By 2075
- 90,485 · +92.7%
- By 2100
- 104,885 · +123.4%
Race, ethnicity, and origin ACS 2023
- Neighborhood character
- Diverse neighborhood (Simpson 0.61)
- Race & ethnicity
- White 55% Hispanic / Latino 29% Two or more races 13% Black 10% Asian 3%
- Hispanic origin (detail)
- Mexican 28%
- Common ancestry
- Lithuanian 4% Slovak 2% Scandinavian 1%
- Foreign-born
- 12% · Canada, Vietnam
- Languages at home
- 73% English-only · Spanish 23% Vietnamese 3%
Political lean MEDSL · Chambers
- 2024 margin
- Solid R (+65.6) · D 16.8% · R 82.4%
- 2008→2024 swing
- -14.4pp toward R · 2008: -51.2pp · 2024: -65.6pp
- All cycles
- 2024: R+65.6 2020: R+61.7 2016: R+62.1 2012: R+61.1 2008: R+51.2
Not yet ingested
- Civics
- —
Market trends
- HPI YoY
- ▼ -61.88%
- Current HPI
- 203.8454
- Rent YoY
- —
- Metro
- —
- State GDP YoY
- ▲ 3.95%
- F500 in state
- 110
Industry mix (Fortune 500 HQ in TX)
| Industry | F500 HQs | Revenue |
|---|---|---|
| Energy | 16 | $1,198B |
|
||
| Technology | 5 | $198B |
|
||
| Engineering / Construction | 4 | $72B |
|
||
| Energy Services | 3 | $60B |
|
||
| Utilities | 3 | $41B |
|
||
| Healthcare | 2 | $330B |
|
||
Price history
1 event — show timeline
- 2026-06-17 Listed $275,000 HARMLS
Property tax history
-4.0%/yrLatest (2025): $5,652 · -14.9% YoY. Source: county tax records.
Cash-flow waterfall
monthlySold comps — $/sqft
last 12 mo · ≤1 miLoading sold comps…