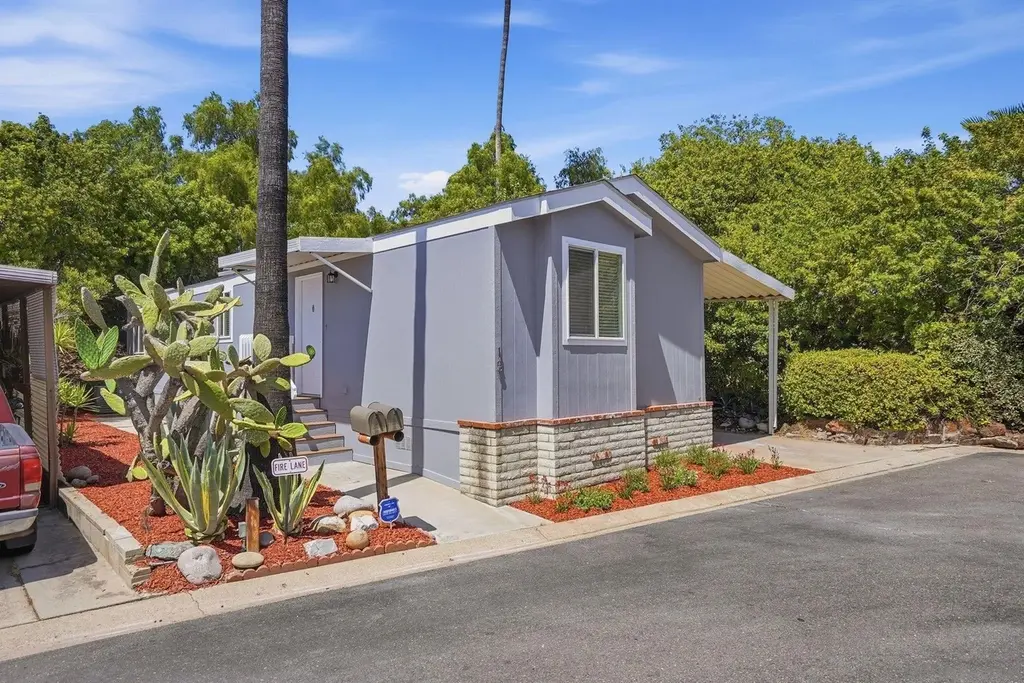
13594 Highway 8 Business Spc 15 · Lakeside, CA
Flood risk 1/10 · Minimal
- FEMA flood zone
- X (unshaded)
- Chance of flooding over 30 yrs
- 0.0%
- Est. flood insurance / yr
- $507 – $1,088
Fire risk 7/10 · Major
- Est. fire insurance / yr
- $659 – $1,223
Heat risk 6/10 · Moderate
- Hot days now (above 98°F)
- 6 days/yr
- Hot days in 30 yrs
- 16 days/yr
Wind risk 1/10 · Minimal
- Chance of severe wind over 30 yrs
- —
Air-quality risk 4/10 · Minor
- Unhealthy air days now
- 6 days/yr
- Unhealthy air days in 30 yrs
- 7 days/yr
Risk factors via First Street. Map © Google.
Why this score? — see what drove the B- grade
The composite is a weighted blend of 9 inputs, each scored 0–100. Each bar is that input's sub-score; the figure is the points it added to the 100-point composite (weight × sub-score).
- Cash flow +30.0/30.0
- 1% rule +10.0/10.0
- DSCR +10.0/10.0
- Schools +4.4/10.0
- Rent growth +3.4/5.0
- ARV discount +2.9/15.0
- Livability +2.8/5.0
- Condition / age +2.5/5.0
- Appreciation +0.0/10.0
$173,000
🖨 Deal sheet 📄 Offer letter ✓ Due diligence
Listing remarks
Beautifully remodeled 3 bedroom, 2 bathroom home tucked away on a quiet corner lot with a spacious yard, mature shade trees, and exceptional privacy. Located in a peaceful community set back on a hill away from the everyday chaos, this home offers a serene setting while still being conveniently close to everything you need. This move-in ready home features a bright open floorplan with generous living spaces and well-sized bedrooms. Recent upgrades include brand new luxury vinyl plank flooring throughout, fresh interior and exterior paint, stainless steel appliances, refinished cabinetry, updated fixtures, and much more. The thoughtfully designed layout creates a seamless flow perfect for bo
Key facts
- Spacious yard
- Quiet corner lot
- Peaceful community
Tags
Property features AI
Finance
- HOA & community: Located in Ridgecrest Community; Senior community; Subdivision: Lakeside (LK)
Exterior
- Parking: 2 parking spaces
- Utilities: Public water; Sewer connected
- Home design: Manufactured home; Single-story
- Construction: HardiPlank-type siding; Asphalt roof
- Exterior features: Partial fencing; Community pool
Interior
- Kitchen: Dishwasher; Gas cooktop and gas range; Oven; Microwave; Refrigerator; Freezer; Ice maker; Range; Exhaust fan; Disposal
- Bedrooms: Up to 3 possible bedrooms
- Bathrooms: 2 full bathrooms
- Heating & cooling: Central air conditioning; Forced air heating; Natural gas heating
- Interior features: Dishwasher; Disposal; Microwave; Refrigerator; Free-Standing Range; Gas Range; Gas Cooktop; Range; Oven; Exhaust Fan; Ice Maker; Freezer
- Laundry & utility: Washer; Dryer
Neighborhood map
What this means for you Summary
Snapshot
- This is a 3-bed/2.0-bath manufactured listed at $173k.
Deal economics
- At list price, monthly cash flow is $1k ($13k/yr) — positive.
- The deal already cash-flows at list — no discount required.
- Meets the 1% rule at list price ($3k rent vs $173k).
- Recommended offer: $170k (1.5% below list) — sets the bar for market timing.
- Cap rate 13.8% vs local median 2.6% in Lakeside — top-decile yield for the area; either an underpriced asset or a hidden risk that comps aren't pricing in. Stress-test before assuming the spread holds.
Location & tenants
- Location reads 55/100 on livability (#877 in CA) — a working-class tenant base; expect higher turnover. Strengths: employment A-, housing A-, health & safety B; Watch: commute D, crime D-, amenities F.
- Lakeside Union Elementary (suburban): math 41% / reading 52% proficiency, ranked #480 of 1,400 in CA (top 34%) — families likely to look elsewhere, expect single-tenant / working-renter base with shorter leases.
- Market conditions: Rents rising (+3.6%/yr); 148 active listings in the ZIP; 1 comparable units currently listed for rent nearby; solid renter incomes; 11,759 units permitted in San Diego County in 2024 (7,244 in 5+ unit buildings).
- This rent runs 30% of the median local income ($108k/yr) — at the standard rent-burdened threshold; future hikes will face affordability resistance.
Forward outlook
- Local home prices are declining (-3.0%/yr); year-one equity from $1k of loan paydown is wiped out by about $5k of value loss. Plan a longer hold.
- San Diego County population projected at +20% by 2050 — long-run rental-demand tailwind backs the buy-and-hold thesis.
- At projected returns (-3.0% appreciation + 3.6% rent growth), your $48k cash investment doubles in ~5 years — after that, you're playing with house money.
Negotiation context
- It's been on market 22 days — a 2% lower offer ($170k) is reasonable based on typical stale-listing flexibility.
Risks & watch-outs
- Climate carrying-cost: major wildfire risk; extreme-heat days projected 6→16/yr by 2055 (HVAC capex compounding) — expect insurance premiums to compound above CPI over the hold.
Questions for the listing agent
- Is there a deadline driving the sale (1031 exchange, divorce, estate, relocation)? That informs how much negotiation room exists.
- Crime grade is D in this area — have there been break-ins, vandalism, or insurance claims at this property in the last 3 years? What carrier currently insures it and at what premium?
- What's the average days-on-market for RENTAL listings here right now (not sales)? A rising rental-DOM trend means longer vacancies and softer asking-rent achievability than the comps imply.
- What's the recent tenant-quality profile in this submarket — average credit score on applications, eviction rate, late-payment / NSF rate, and stable-employment percentage? A property-management company in the area should have these aggregated.
- How much new for-sale + rental construction is in the pipeline within 1–3 miles? Heavy new supply typically softens prices + rents 12–24 months out; constrained supply supports both.
Investment metrics
- 1% rule
- 1.56% ✓
- Cap rate
- 13.84%
- Cash-on-cash
- 26.95%
- DSCR
- 2.20
- GRM
- 5.3
CMA / ARV
- ARV (on-the-fly)
- $156,983
- Comps found
- 9
Show comp detail 9 sales within ~0.75 mi
| Address | Dist | Beds/Ba | Sqft | Sold | Price | $/sf | Match |
|---|---|---|---|---|---|---|---|
| 13594 Highway 8 Business #48 | 0.00mi | 2/2.0 (-1) | 920 (+5%) | 6mo | $170,000 | $185 | 82 |
| 13490 Highway 8 Business Spc 24 | 0.14mi | 2/2.0 (-1) | 960 (+10%) | 1mo | $133,500 | $139 | 72 |
| 13594 Highway 8 Business #33 | 0.00mi | 2/2.0 (-1) | 987 (+12%) | 3mo | $177,000 | $179 | 72 |
| 13490 Highway 8 Business SPC 32 | 0.14mi | 3/2.0 | 850 (-3%) | 23mo | $189,000 | $222 | 69 |
| 13594 Highway 8 Business #42 | 0.02mi | 2/2.0 (-1) | 960 (+10%) | 12mo | $193,000 | $201 | 68 |
| 13490 Highway 8 Business Spc 14 | 0.14mi | 2/1.0 (-1) | 960 (+10%) | 6mo | $98,000 | $102 | 64 |
| 13490 Highway 8 Business #50 | 0.14mi | 2/1.0 (-1) | 800 (-9%) | 10mo | $180,000 | $225 | 61 |
| 13594 HWY 8 BUS #18 | 0.00mi | 2/2.0 (-1) | 960 (+10%) | 22mo | $129,000 | $134 | 61 |
| 9041 El Dorado Pkwy Spc 51 | 0.36mi | 2/2.0 (-1) | 800 (-9%) | 4mo | $130,000 | $163 | 60 |
Match score weights: distance 35% · size 25% · config 20% · recency 20%. Top-matched comps best support the ARV.
Projected returns pro-forma
-3.0% appreciation · 3.56% rent growth · sell at horizon
- IRR
- 21.4%
- Equity multiple
- 1.88×
- Total profit
- $42,739
- Equity at exit
- $25,795
- IRR
- 29.9%
- Equity multiple
- 3.74×
- Total profit
- $132,603
- Equity at exit
- $14,958
Cash invested: $48,440 (down + closing). Projections, not guarantees.
Landlord ↔ Tenant lean methodology
- Overall (STATE)
- 18 Strongly Tenant-Friendly
- State California
- 18 Strongly Tenant-Friendly · D+13
- County
- — inherits STATE
- City
- — inherits STATE
ZIP-level market 92040
- Rents YoY
- 3.6%
- Active inventory
- 148
- Price-to-rent
- 5.3×
Monthly cashflow live
- Estimated rent
- $2,707 medium interval (Pro) →
- Mortgage (P&I)
- −$907
- Tax from tax record
- −$71 /mo · $855/yr
- Insurance
- −$72
- HOA
- −$0
- Vacancy / Maint / Mgmt
- −$568
- Net cashflow
- $1,088
Break-even live
UW: 25.0% down · 7.5% · 30yr · 1.5% tax · 5.0% vac · 8.0% maint · 8.0% mgmt
Financing live
Cash to close
- Down payment
- $43,250
- Closing costs
- $5,190
- Reserves months
- —
- Total cash needed
- —
Loan-product check · same deal, 3 products live
Conventional
25% down · 7.5% · 30yr
- Down + closing
- —
- Monthly P&I
- —
- Monthly cashflow
- —
- DSCR
- —
- Eligible?
- —
Personal DTI + credit; lowest rate.
DSCR
20% down · 8.5% · 30yr
- Down + closing
- —
- Monthly P&I
- —
- Monthly cashflow
- —
- DSCR
- —
- Eligible?
- —
No personal income docs; deal must DSCR.
Hard money
10% down · 12.0% · 12mo
- Down + closing
- —
- Monthly P&I
- —
- Monthly cashflow
- —
- DSCR
- —
- Eligible?
- —
Short-term bridge; refi at stabilization.
Rent comps 1 comps
| Address | Beds | Baths | Sqft | Rent | $/sqft | DOM | Units | Dist |
|---|---|---|---|---|---|---|---|---|
| 8410 Los Coches Rd El Cajon, CA | 2.0 | 2.0 | 900 | $2,239 | $2.49 | 1d | 1 | 0.96mi |
Listing history 6 events
-
2026-06-04status $173,000 Pending 22 DOM
-
2026-06-03days on market $173,000 Active 22 DOM
-
2026-06-02days on market $173,000 Active 21 DOM
-
2026-06-01days on market $173,000 Active 20 DOM
-
2026-05-31days on market $173,000 Active 19 DOM
-
2026-05-12$173,000 Active
ⓘ Source: listings_history table (triggers on properties + properties_extension) + one-shot
backfill from property_details.listing_events for pre-trigger history.
Tax reassessment forecast CA · Resets to sale price
- Current annual tax
- $855 · $71/mo
- Projected year-2 tax
- $1,315 · $110/mo
- Expected delta
- +$460/yr (+$38/mo · 53.7%)
ⓘ Screening estimate from a state-policy table — verify with the county assessor before closing.
Climate risk First Street
- Flood 1/10 Low FEMA zone X (unshaded) · 0% chance over 30 yrs
- Wildfire 7/10 Severe
- Heat 6/10 Major 6 d/yr ≥98°F today · 16 d/yr by 30 yrs out
- Wind 1/10 Low
- Air quality 4/10 Moderate 6 unhealthy d/yr today · 7 by 30 yrs out
Nearby sold comps map
Loading sold comps map…
Walkable amenities ~0.75 mi
Loading nearby amenities…
Taxation est. · year 1
- Rental income
- $32,483
- − Mortgage interest
- −$9,691
- − Property taxes
- −$855
- − Insurance
- −$865
- − Repairs & maintenance
- −$2,599
- − Management
- −$2,599
- − Depreciation
- −$5,033
- Taxable income
- $10,842
- Est. tax owed @ 24.0%
- −$2,602
- After-tax cash flow
- $10,452/yr
For passive investors: Depreciation is non-cash, so a rental often shows a tax loss while cash-flowing — sheltering income. Rental losses are passive: they offset passive income freely, and up to $25,000/yr can offset ordinary (W-2) income if you actively participate and your MAGI is under $100k (phasing out to $0 by $150k); unused losses carry forward. On sale, claimed depreciation is recaptured at up to 25%, and gains may owe capital-gains tax (a 1031 exchange can defer both). Figures are a year-1 estimate at your 24.0% rate — not tax advice; consult a CPA.
Schools (NCES district)
- District
- Lakeside Union Elementary
- NCES district ID
- 0620790
- Math proficiency
- 41% ▬ 0.00%
- Reading proficiency
- 52% ▼ -1.00%
- Median HH income
- $65,574
- Composite
- 43.51/100
- National rank
- #6453
- State rank
- #480 of 1400 in CA
Livability — Lakeside
- Score
- 55/100
- State rank
- #877
- US rank
- #23702
Category grades
Schools grade is shown separately in the Schools card above.
Census & demographics
- Census place
- Lakeside, CA
- County
- San Diego County · 3,178,799 people
- City population
- 46,216
- Metro
- San Diego-Chula Vista-Carlsbad, CA
- Population (ZIP)
- 46,216
- Household income
- $107,937
- Rent vs Own
- Severe rent burden
- 1147.0
Population outlook (San Diego County) Hauer SSP2
- Today (2025)
- 3,678,185 people
- By 2030
- 3,856,546 · +4.8%
- By 2040
- 4,171,407 · +13.4%
- By 2050
- 4,421,607 · +20.2%
- By 2075
- 4,831,599 · +31.4%
- By 2100
- 4,832,502 · +31.4%
Race, ethnicity, and origin ACS 2023
- Neighborhood character
- Predominantly White (69%)
- Race & ethnicity
- White 69% Hispanic / Latino 22% Two or more races 11% Black 2% Asian 2% Native American 1%
- Hispanic origin (detail)
- Mexican 19%
- Common ancestry
- Lithuanian 3% Italian 3% Slovak 2%
- Foreign-born
- 8% · Canada
- Languages at home
- 86% English-only · Spanish 10% Arabic 1% Other Indo-European 1%
Political lean MEDSL · San Diego
- 2024 margin
- D (+16.8) · D 56.9% · R 40.1% · Other 2.9%
- 2008→2024 swing
- +6.6pp toward D · 2008: 10.2pp · 2024: 16.8pp
- All cycles
- 2024: D+16.8 2020: D+22.8 2016: D+17.8 2012: D+5.1 2008: D+10.2
Not yet ingested
- Civics
- —
Market trends
- HPI YoY
- ▼ -622.09%
- Current HPI
- 344.8263
- Rent YoY
- ▲ 3.56%
- Metro
- San Diego-Chula Vista-Carlsbad, CA
- State GDP YoY
- ▲ 3.21%
- F500 in state
- 116
Industry mix (Fortune 500 HQ in CA)
| Industry | F500 HQs | Revenue |
|---|---|---|
| Technology | 27 | $1,492B |
|
||
| Financial Services | 3 | $174B |
|
||
| Retail | 3 | $44B |
|
||
| Insurance | 3 | $26B |
|
||
| Media / Entertainment | 2 | $115B |
|
||
| Pharmaceuticals / Biotech | 2 | $62B |
|
||
Price history
1 event — show timeline
- 2026-05-12 Listed $173,000 SDMLS
Cash-flow waterfall
monthlySold comps — $/sqft
last 12 mo · ≤1 miLoading sold comps…