9366 Ranger Trl · Dobbins, CA
Flood risk 1/10 · Minimal
- FEMA flood zone
- X (unshaded)
- Chance of flooding over 30 yrs
- 0.0%
- Est. flood insurance / yr
- $507 – $1,088
Fire risk 10/10 · Severe
- Est. fire insurance / yr
- $659 – $1,223
Heat risk 5/10 · Moderate
- Hot days now (above 101°F)
- 7 days/yr
- Hot days in 30 yrs
- 15 days/yr
Wind risk 1/10 · Minimal
- Chance of severe wind over 30 yrs
- —
Air-quality risk 10/10 · Severe
- Unhealthy air days now
- 34 days/yr
- Unhealthy air days in 30 yrs
- 38 days/yr
Risk factors via First Street. Map © Google.
Why this score? — see what drove the C- grade
The composite is a weighted blend of 9 inputs, each scored 0–100. Each bar is that input's sub-score; the figure is the points it added to the 100-point composite (weight × sub-score).
- ARV discount +15.0/15.0
- Cash flow +12.9/30.0
- Appreciation +5.8/10.0
- DSCR +3.9/10.0
- 1% rule +3.8/10.0
- Rent growth +2.5/5.0
- Condition / age +2.5/5.0
- Livability +1.9/5.0
- Schools +1.8/10.0
$198,000
🖨 Deal sheet 📄 Offer letter ✓ Due diligence
Listing remarks MLS
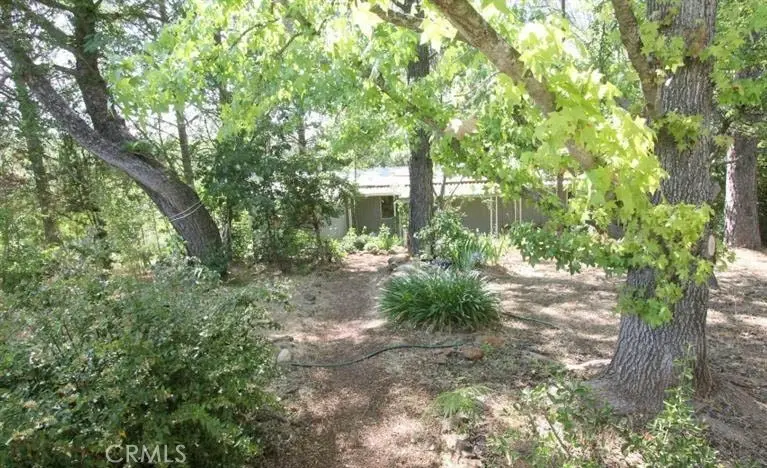
No guts, no glory! The aura of future valor shines triumphantly bright on 7.49 usable view acres with a pretty pond and abundant rehab and renovation possibilities. Or remove what's there and start fresh. Located on a paved road in a peaceful and private setting with impressive solar exposure, the picturesque property, currently rough around the edges but rich in potential, offers proximity to in-town conveniences while retaining its sheltered country charisma. A professional site plan showing a 4000 sqft main residence, 3-car garage, and 1200 sqft ADU is available A sturdy mobile home with a built on addition features a versatile floor plan, wood stove, French doors, built-ins, skylights and covered decks. The overall condition and appearance have deteriorated due to coarse treatment by past occupants but all utilities are in place, there's a two-year-old water heater, roof that was newer in 2015 and access to irrigation district water. Recent tenants report an excellent well producing great tasting H2O. There are two driveways and the acreage is on both sides of Ranger Trail-ideal for a separate unit. A detached garage provides space for vehicles and equipment and there's are functional outbuildings for storage. There’s also a hot tub and remnants of an outside shower. An older RV that could be refurbished can remain as will a working outdoor pizza oven. The fenced and gated land has plenty of room for animals and agriculture and enjoys the surroundings of a thriving agritourism area. Ranches, farms, vineyards and orchards are in the neighborhood. Shopping, services, schools and several lakes are literally down the street. Roll up your sleeves, prepare your elbow grease, then reward yourself with a virtual medal after exploration and transformation of this formerly handsome homestead where vision meets opportunity!
Key facts
- Covered decks
- Paved road
- Wood stove
Tags
Neighborhood map
What this means for you Summary
Snapshot
- This is a 3-bed/2.0-bath manufactured listed at $198k.
Deal economics
- At list price, monthly cash flow is $-15 ($-176/yr) — negative.
- To cash-flow at today's rent, offer at most $195k (1.3% below list).
- To meet the 1% rule (rent ≥ 1% of price), the offer needs to be $174k (12.1% below list).
- Recommended offer: $174k (12.1% below list) — sets the bar for 1% rule.
Location & tenants
- Location reads 38/100 on livability (#1,405 in CA) — a limited-amenity area; tenant pool skews transient or value-seeking. Strengths: crime A; Watch: amenities F, commute F, employment F.
- Marysville Joint Unified (suburban): math 14% / reading 28% proficiency, ranked #455 of 517 in CA (top 88%) — low school quality limits family demand, transient renter base, plan for 1-2y turnover; 68% free/reduced lunch — lower-income household profile, screen leases tightly.
- Market conditions: 26 active listings in the ZIP; 750 units permitted in Yuba County in 2024 (41 in 5+ unit buildings).
Forward outlook
- In year one you build about $5k of equity ($1k loan paydown + $3k appreciation (1.6% local appreciation)).
- Yuba County population projected to shrink 3% by 2050 — rents likely to lag national; underwrite the cash flow, not the appreciation.
- At projected returns (1.6% appreciation + 3.0% rent growth), your $55k cash investment doubles in ~9 years — after that, you're playing with house money.
- By year 8, paydown + projected appreciation supports a ~$35k cash-out refi (75% LTV) — recoverable capital for the next deal without selling this one.
Negotiation context
- It's been on market 131 days — a 12% lower offer ($174k) is reasonable based on typical stale-listing flexibility.
Risks & watch-outs
- Climate carrying-cost: severe wildfire risk; extreme-heat days projected 7→15/yr by 2055 (HVAC capex compounding) — expect insurance premiums to compound above CPI over the hold.
Questions for the listing agent
- What do current leases actually rent for vs. the listed asking? Can we see a recent rent roll and the last 12 months of T-12 income?
- It's been on market 131 days. Have you received any prior offers? Is the seller open to a 12% concession, seller financing, or rate buy-down credit?
- Built in 1976 — when were the roof, HVAC, electrical panel, plumbing, and water heater last replaced?
- Why hasn't it sold? Are there any deal-killer items the seller is aware of (foundation, flood, title, zoning, code violations)?
- Is there a deadline driving the sale (1031 exchange, divorce, estate, relocation)? That informs how much negotiation room exists.
- What's the average days-on-market for RENTAL listings here right now (not sales)? A rising rental-DOM trend means longer vacancies and softer asking-rent achievability than the comps imply.
- What's the recent tenant-quality profile in this submarket — average credit score on applications, eviction rate, late-payment / NSF rate, and stable-employment percentage? A property-management company in the area should have these aggregated.
- How much new for-sale + rental construction is in the pipeline within 1–3 miles? Heavy new supply typically softens prices + rents 12–24 months out; constrained supply supports both.
Investment metrics
- 1% rule
- 0.88% ✗
- Cap rate
- 6.20%
- Cash-on-cash
- -0.32%
- DSCR
- 0.99
- GRM
- 9.5
CMA / ARV
- ARV (median comp)
- $341,857
- List price
- $198,000
- Delta
- -42.08%
- Verdict
- UNDERPRICED
- Comps
- 2 within 2.0 mi
Projected returns pro-forma
1.63% appreciation · 3.0% rent growth · sell at horizon
- IRR
- 3.1%
- Equity multiple
- 1.16×
- Total profit
- $9,002
- Equity at exit
- $74,183
- IRR
- 7.1%
- Equity multiple
- 1.93×
- Total profit
- $51,808
- Equity at exit
- $103,896
Cash invested: $55,440 (down + closing). Projections, not guarantees.
Landlord ↔ Tenant lean methodology
- Overall (STATE)
- 18 Strongly Tenant-Friendly
- State California
- 18 Strongly Tenant-Friendly · D+13
- County
- — inherits STATE
- City
- — inherits STATE
ZIP-level market 95962
- Home prices YoY
- 1.0%
- Active inventory
- 26
- Price-to-rent
- 9.5×
Monthly cashflow live
- Estimated rent
- $1,740 medium interval (Pro) →
- Mortgage (P&I)
- −$1,038
- Tax from tax record
- −$268 /mo · $3,219/yr
- Insurance
- −$82
- HOA
- −$0
- Vacancy / Maint / Mgmt
- −$365
- Net cashflow
- $-15
Break-even live
UW: 25.0% down · 7.5% · 30yr · 1.5% tax · 5.0% vac · 8.0% maint · 8.0% mgmt
Financing live
Cash to close
- Down payment
- $49,500
- Closing costs
- $5,940
- Reserves months
- —
- Total cash needed
- —
Loan-product check · same deal, 3 products live
Conventional
25% down · 7.5% · 30yr
- Down + closing
- —
- Monthly P&I
- —
- Monthly cashflow
- —
- DSCR
- —
- Eligible?
- —
Personal DTI + credit; lowest rate.
DSCR
20% down · 8.5% · 30yr
- Down + closing
- —
- Monthly P&I
- —
- Monthly cashflow
- —
- DSCR
- —
- Eligible?
- —
No personal income docs; deal must DSCR.
Hard money
10% down · 12.0% · 12mo
- Down + closing
- —
- Monthly P&I
- —
- Monthly cashflow
- —
- DSCR
- —
- Eligible?
- —
Short-term bridge; refi at stabilization.
Listing history 18 events
-
2026-06-19days on market $198,000 Active 131 DOM
-
2026-06-18days on market $198,000 Active 130 DOM
-
2026-06-17days on market $198,000 Active 129 DOM
-
2026-06-16days on market $198,000 Active 128 DOM
-
2026-06-15days on market $198,000 Active 127 DOM
-
2026-06-14days on market $198,000 Active 125 DOM
-
2026-06-13days on market $198,000 Active 124 DOM
-
2026-06-10days on market $198,000 Active 122 DOM
-
2026-06-09days on market $198,000 Active 121 DOM
-
2026-06-08days on market $198,000 Active 120 DOM
-
2026-06-07days on market $198,000 Active 119 DOM
-
2026-06-05days on market $198,000 Active 116 DOM
-
2026-06-03days on market $198,000 Active 115 DOM
-
2026-06-02days on market $198,000 Active 114 DOM
-
2026-06-01days on market $198,000 Active 113 DOM
-
2026-05-31days on market $198,000 Active 112 DOM
-
2026-05-30days on market $198,000 Active 111 DOM
-
2026-02-08$198,000 Active 1854-char remark
Show marketing remark (1854 chars)
No guts, no glory! The aura of future valor shines triumphantly bright on 7.49 usable view acres with a pretty pond and abundant rehab and renovation possibilities. Or remove what's there and start fresh. Located on a paved road in a peaceful and private setting with impressive solar exposure, the picturesque property, currently rough around the edges but rich in potential, offers proximity to in-town conveniences while retaining its sheltered country charisma. A professional site plan showing a 4000 sqft main residence, 3-car garage, and 1200 sqft ADU is available A sturdy mobile home with a built on addition features a versatile floor plan, wood stove, French doors, built-ins, skylights and covered decks. The overall condition and appearance have deteriorated due to coarse treatment by past occupants but all utilities are in place, there's a two-year-old water heater, roof that was newer in 2015 and access to irrigation district water. Recent tenants report an excellent well producing great tasting H2O. There are two driveways and the acreage is on both sides of Ranger Trail-ideal for a separate unit. A detached garage provides space for vehicles and equipment and there's are functional outbuildings for storage. There’s also a hot tub and remnants of an outside shower. An older RV that could be refurbished can remain as will a working outdoor pizza oven. The fenced and gated land has plenty of room for animals and agriculture and enjoys the surroundings of a thriving agritourism area. Ranches, farms, vineyards and orchards are in the neighborhood. Shopping, services, schools and several lakes are literally down the street. Roll up your sleeves, prepare your elbow grease, then reward yourself with a virtual medal after exploration and transformation of this formerly handsome homestead where vision meets opportunity!
ⓘ Source: listings_history table (triggers on properties + properties_extension) + one-shot
backfill from property_details.listing_events for pre-trigger history.
Tax reassessment forecast CA · Resets to sale price
- Current annual tax
- $3,219 · $268/mo
- Projected year-2 tax
- $3,219 · $268/mo
- Expected delta
- $0/yr ($0/mo · 0.0%)
ⓘ Screening estimate from a state-policy table — verify with the county assessor before closing.
Climate risk First Street
- Flood 1/10 Low FEMA zone X (unshaded) · 0% chance over 30 yrs
- Wildfire 10/10 Extreme
- Heat 5/10 Major 7 d/yr ≥101°F today · 15 d/yr by 30 yrs out
- Wind 1/10 Low
- Air quality 10/10 Extreme 34 unhealthy d/yr today · 38 by 30 yrs out
Nearby sold comps map
Loading sold comps map…
Walkable amenities ~0.75 mi
Loading nearby amenities…
Taxation est. · year 1
- Rental income
- $20,877
- − Mortgage interest
- −$11,091
- − Property taxes
- −$3,219
- − Insurance
- −$990
- − Repairs & maintenance
- −$1,670
- − Management
- −$1,670
- − Depreciation
- −$5,760
- Taxable loss
- −$3,523
- Est. tax savings @ 24.0%
- +$846
- After-tax cash flow
- $670/yr
For passive investors: Depreciation is non-cash, so a rental often shows a tax loss while cash-flowing — sheltering income. Rental losses are passive: they offset passive income freely, and up to $25,000/yr can offset ordinary (W-2) income if you actively participate and your MAGI is under $100k (phasing out to $0 by $150k); unused losses carry forward. On sale, claimed depreciation is recaptured at up to 25%, and gains may owe capital-gains tax (a 1031 exchange can defer both). Figures are a year-1 estimate at your 24.0% rate — not tax advice; consult a CPA.
Schools (NCES district)
- District
- Marysville Joint Unified
- NCES district ID
- 0624090
- Math proficiency
- 14% ▼ -13.00%
- Reading proficiency
- 28% ▼ -10.00%
- Median HH income
- $44,598
- Composite
- 18.18/100
- National rank
- #8961
- State rank
- #455 of 517 in CA
Livability — Dobbins
- Score
- 38/100
- State rank
- #1405
- US rank
- #27481
Category grades
Schools grade is shown separately in the Schools card above.
Census & demographics
- City population
- 564
- Population (ZIP)
- 1,136
Population outlook (Yuba County) Hauer SSP2
- Today (2025)
- 75,432 people
- By 2030
- 75,358 · -0.1%
- By 2040
- 74,643 · -1.0%
- By 2050
- 72,937 · -3.3%
- By 2075
- 66,368 · -12.0%
- By 2100
- 54,524 · -27.7%
Race, ethnicity, and origin ACS 2023
- Neighborhood character
- Predominantly White (88%)
- Race & ethnicity
- White 88% Two or more races 7% Pacific Islander 4% Native American 1%
- Common ancestry
- Russian 11% German 8% Slovak 6%
- Foreign-born
- 28% · Canada, Dominican Republic
- Languages at home
- 86% English-only · Other Indo-European 7% Other Asian/Pacific 4% Russian/Polish/Slavic 2%
Political lean MEDSL · Yuba
- 2024 margin
- Strong R (+25.8) · D 35.7% · R 61.5% · Other 2.8%
- 2008→2024 swing
- -11.2pp toward R · 2008: -14.7pp · 2024: -25.8pp
- All cycles
- 2024: R+25.8 2020: R+21.6 2016: R+24.1 2012: R+19.5 2008: R+14.7
Not yet ingested
- Civics
- —
Market trends
- HPI YoY
- ▲ 1.63%
- Current HPI
- 170.4844
- Rent YoY
- —
- Metro
- —
- State GDP YoY
- ▲ 3.21%
- F500 in state
- 116
Industry mix (Fortune 500 HQ in CA)
| Industry | F500 HQs | Revenue |
|---|---|---|
| Technology | 27 | $1,492B |
|
||
| Financial Services | 3 | $174B |
|
||
| Retail | 3 | $44B |
|
||
| Insurance | 3 | $26B |
|
||
| Media / Entertainment | 2 | $115B |
|
||
| Pharmaceuticals / Biotech | 2 | $62B |
|
||
Price history
1 event — show timeline
- 2026-02-08 Listed $198,000 CRMLS
Property tax history
+12.7%/yrLatest (2025): $3,219 · +1.7% YoY. Source: county tax records.
Cash-flow waterfall
monthlySold comps — $/sqft
last 12 mo · ≤1 miLoading sold comps…