 🏗️ New Construction
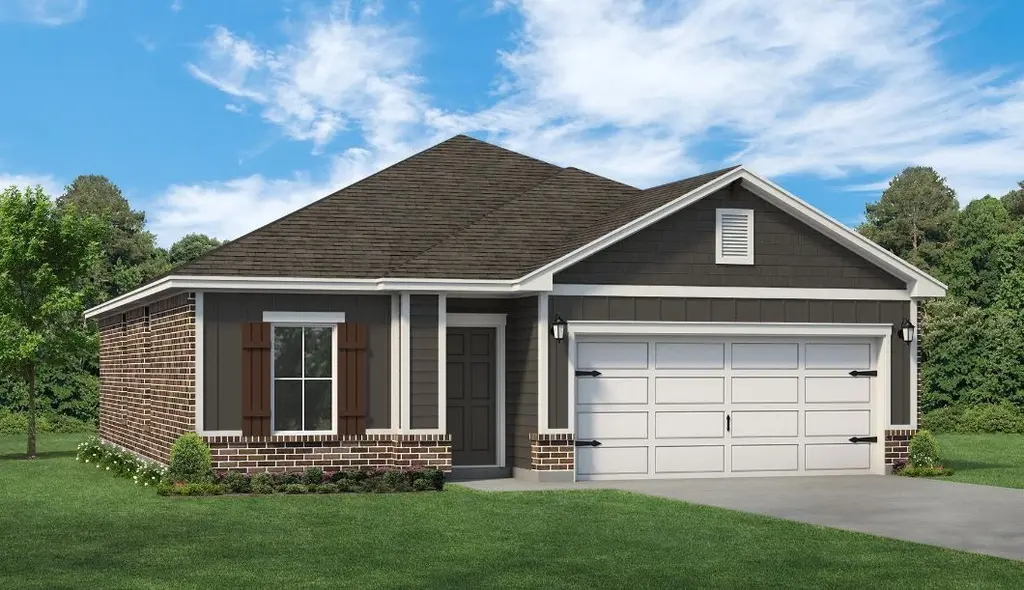
V14 Plan · Longview, TX
Flood risk No data
- FEMA flood zone
- —
- Chance of flooding over 30 yrs
- —
- Est. flood insurance / yr
- —
Fire risk No data
- Est. fire insurance / yr
- —
Heat risk No data
- Hot days now (above threshold)
- —
- Hot days in 30 yrs
- —
Wind risk No data
- Chance of severe wind over 30 yrs
- —
Air-quality risk No data
- Unhealthy air days now
- —
- Unhealthy air days in 30 yrs
- —
Risk factors via First Street. Map © Google.
Why this score? — see what drove the F grade
The composite is a weighted blend of 9 inputs, each scored 0–100. Each bar is that input's sub-score; the figure is the points it added to the 100-point composite (weight × sub-score).
- ARV discount +7.5/15.0
- Cash flow +7.2/30.0
- Condition / age +4.8/5.0
- Livability +3.7/5.0
- Rent growth +3.3/5.0
- Schools +3.1/10.0
- 1% rule +2.1/10.0
- DSCR +1.4/10.0
- Appreciation +0.0/10.0
$269,990
🖨 Deal sheet (PDF) 📄 Offer letter ✓ Due diligence
Listing remarks MLS
- FULLY LOADED™ Conaway Home - Solid poste-tension concrete foundation - 9ft raised ceilings throughout - Moisture controlling house wrap - HERS rated energy efficient home - Low-E, tilt-sash vinyl windows - R-38 insulated ceilings - Energy saving appliances - 14 SEER air conditioning unit - 1, 2 & 6 year builder warranty - Plus much more. ..
Key facts
- Builder warranty
- 2 parking spots
- Listed 324 days
Tags
Neighborhood map
What this means for you Summary
Snapshot
- This is a 4-bed/2.0-bath single-family listed at $270k. Condition is rated excellent.
Deal economics
- At list price, monthly cash flow is $-426 ($-5k/yr) — negative.
- To cash-flow at today's rent, offer at most $249k (7.6% below list).
- To meet the 1% rule (rent ≥ 1% of price), the offer needs to be $219k (18.7% below list).
- Recommended offer: $219k (18.7% below list) — sets the bar for 1% rule.
- Cap rate 4.6% vs local median 3.0% in Longview — top-decile yield for the area; either an underpriced asset or a hidden risk that comps aren't pricing in. Stress-test before assuming the spread holds.
Location & tenants
- Location reads 73/100 on livability (#213 in TX) — a middle-class / working-renter tenant base. Strengths: cost of living A+, housing A+, health & safety A+; Watch: employment C-, crime D+, amenities F.
- Hallsville ISD (town): math 30% / reading 40% proficiency, ranked #490 of 826 in TX (top 59%) — families likely to look elsewhere, expect single-tenant / working-renter base with shorter leases.
- Zoned schools: Hallsville H S (math 66% / reading 70%, grade B, #150 of 1,632 statewide, top 10%, 1,456 students, 40% FRL) — zoned schools at 40% FRL track the district average.
- Zoned-school proficiency averages 68% at this address vs 35% district-wide (+33 pts) — the actual schools serving this property are materially stronger than the Hallsville ISD average implies; a family-tenant draw the district grade alone would hide.
- Market conditions: Rents rising (+3.3%/yr); 155 active listings in the ZIP; 6 comparable units currently listed for rent nearby; rentals at typical pace (median 23d on market — plan ~3-4 weeks tenant-placement turnaround); 85 units permitted in Harrison County in 2024 (15 in 5+ unit buildings).
- This rent runs 40% of the median local income ($66k/yr) — at the standard rent-burdened threshold; future hikes will face affordability resistance.
Forward outlook
- Local home prices are declining (-3.0%/yr); year-one equity from $2k of loan paydown is wiped out by about $9k of value loss. Plan a longer hold.
Negotiation context
- It's been on market 324 days — a 12% lower offer ($238k) is reasonable based on typical stale-listing flexibility.
Questions for the listing agent
- What do current leases actually rent for vs. the listed asking? Can we see a recent rent roll and the last 12 months of T-12 income?
- It's been on market 324 days. Have you received any prior offers? Is the seller open to a 19% concession, seller financing, or rate buy-down credit?
- What does the HOA fee cover, when was the last increase, and are there any pending special assessments or reserve-fund shortfalls?
- Why hasn't it sold? Are there any deal-killer items the seller is aware of (foundation, flood, title, zoning, code violations)?
- Is there a deadline driving the sale (1031 exchange, divorce, estate, relocation)? That informs how much negotiation room exists.
- Schools are D-rated, which usually means shorter tenancies and higher turnover. Who's the typical renter profile here, and what's been the actual vacancy rate?
- Crime grade is D in this area — have there been break-ins, vandalism, or insurance claims at this property in the last 3 years? What carrier currently insures it and at what premium?
- The area grade is low — what's the realistic commute time and amenity access for the typical tenant pool here? Any planned neighborhood developments (good or bad) we should know about?
- What's the average days-on-market for RENTAL listings here right now (not sales)? A rising rental-DOM trend means longer vacancies and softer asking-rent achievability than the comps imply.
- What's the recent tenant-quality profile in this submarket — average credit score on applications, eviction rate, late-payment / NSF rate, and stable-employment percentage? A property-management company in the area should have these aggregated.
- How much new for-sale + rental construction is in the pipeline within 1–3 miles? Heavy new supply typically softens prices + rents 12–24 months out; constrained supply supports both.
Investment metrics
- 1% rule
- 0.71% ✗
- Cap rate
- 4.65%
- Cash-on-cash
- -5.87%
- DSCR
- 0.74
- GRM
- 11.8
CMA / ARV
- ARV (median comp)
- $311,036
- List price
- $269,990
- Delta
- -13.20%
- Verdict
- UNDERPRICED
- Comps
- 5 within 1.0 mi
Projected returns pro-forma
-3.0% appreciation · 3.29% rent growth · sell at horizon
- IRR
- -26.0%
- Equity multiple
- 0.12×
- Total profit
- $-76,863
- Equity at exit
- $46,377
- IRR
- -21.9%
- Equity multiple
- -0.14×
- Total profit
- $-99,072
- Equity at exit
- $26,893
Cash invested: $87,090 (down + closing). Projections, not guarantees.
Landlord ↔ Tenant lean methodology
- Overall (STATE)
- 87 Strongly Landlord-Friendly
- State Texas
- 87 Strongly Landlord-Friendly · R+5
- County
- — inherits STATE
- City
- — inherits STATE
ZIP-level market 75601
- Home prices YoY
- -29.9%
- Rents YoY
- 3.3%
- Active inventory
- 155
- Price-to-rent
- 10.3×
Monthly cashflow live
- Estimated rent
- $2,194 high interval (Pro) →
- Mortgage (P&I)
- −$1,631
- Tax est. 1.5%
- −$389 /mo · $4,666/yr
- Insurance
- −$130
- HOA
- −$10
- Vacancy / Maint / Mgmt
- −$461
- Net cashflow
- $-426
Break-even live
Sensitivity live
| Price | -10% $-211 | -5% $-319 | +0% $-426 | +5% $-534 | +10% $-641 |
|---|---|---|---|---|---|
| Rent | -10% $-600 | -5% $-513 | +0% $-426 | +5% $-340 | +10% $-253 |
| Rate | -1.0pp $-270 | -0.5pp $-347 | base $-426 | +0.5pp $-507 | +1.0pp $-589 |
UW: 25.0% down · 7.5% · 30yr · 1.5% tax · 5.0% vac · 8.0% maint · 8.0% mgmt
Financing live
Cash to close
- Down payment
- $77,759
- Closing costs
- $9,331
- Reserves months
- —
- Total cash needed
- —
Loan-product check · same deal, 3 products live
Conventional
25% down · 7.5% · 30yr
- Down + closing
- —
- Monthly P&I
- —
- Monthly cashflow
- —
- DSCR
- —
- Eligible?
- —
Personal DTI + credit; lowest rate.
DSCR
20% down · 8.5% · 30yr
- Down + closing
- —
- Monthly P&I
- —
- Monthly cashflow
- —
- DSCR
- —
- Eligible?
- —
No personal income docs; deal must DSCR.
Hard money
10% down · 12.0% · 12mo
- Down + closing
- —
- Monthly P&I
- —
- Monthly cashflow
- —
- DSCR
- —
- Eligible?
- —
Short-term bridge; refi at stabilization.
Rent comps 6 comps
| Address | Beds | Baths | Sqft | Rent | $/sqft | DOM | Units | Dist |
|---|---|---|---|---|---|---|---|---|
| 3109 Mesa Dr Longview, TX | 4.0 | 2.0 | 1582 | $2,400 | $1.52 | 15d | 1 | 0.02mi |
| 3100 Mesa Dr Longview, TX | 3.0 | 2.0 | 1234 | $2,250 | $1.82 | 45d | 1 | 0.02mi |
| 3105 Mesa Dr Longview, TX | 4.0 | 2.0 | 1550 | $2,600 | $1.68 | 23d | 1 | 0.02mi |
| 1609 Everwood Ct Longview, TX | 3.0 | 2.0 | 1505 | $2,495 | $1.66 | 15d | 1 | 1.11mi |
| 3401 E Marshall Ave Longview, TX | 1.0–3.0 | 1.0–2.0 | 1025 | $1,300 | $1.27 | 15d | 4 | 1.14mi |
| 3401 E Marshall Ave Longview, TX | 3.0 | 2.0 | 1300 | $1,300 | $1.00 | 23d | 1 | 1.14mi |
HOA detail
- Monthly dues
- $10 · $120/yr
Listing history 18 events
-
2026-06-21days on market $269,990 Active 324 DOM
-
2026-06-19days on market $269,990 Active 322 DOM
-
2026-06-18days on market $269,990 Active 321 DOM
-
2026-06-17days on market $269,990 Active 320 DOM
-
2026-06-16days on market $269,990 Active 319 DOM
-
2026-06-15days on market $269,990 Active 318 DOM
-
2026-06-14days on market $269,990 Active 316 DOM
-
2026-06-13days on market $269,990 Active 315 DOM
-
2026-06-10days on market $269,990 Active 313 DOM
-
2026-06-09days on market $269,990 Active 312 DOM
-
2026-06-08days on market $269,990 Active 311 DOM
-
2026-06-07days on market $269,990 Active 310 DOM
-
2026-06-05days on market $269,990 Active 307 DOM
-
2026-06-02days on market $269,990 Active 305 DOM
-
2026-06-01days on market $269,990 Active 304 DOM
-
2026-05-31days on market $269,990 Active 303 DOM
-
2026-05-30days on market $269,990 Active 302 DOM
-
2025-08-02$269,990 Active 366-char remark
Show marketing remark (366 chars)
- FULLY LOADED™ Conaway Home - Solid poste-tension concrete foundation - 9ft raised ceilings throughout - Moisture controlling house wrap - HERS rated energy efficient home - Low-E, tilt-sash vinyl windows - R-38 insulated ceilings - Energy saving appliances - 14 SEER air conditioning unit - 1, 2 & 6 year builder warranty - Plus much more. ..
ⓘ Source: listings_history table (triggers on properties + properties_extension) + one-shot
backfill from property_details.listing_events for pre-trigger history.
Nearby sold comps map
Loading sold comps map…
Walkable amenities ~0.75 mi
Loading nearby amenities…
Taxation est. · year 1
- Rental income
- $26,329
- − Mortgage interest
- −$17,423
- − Property taxes
- −$4,666
- − Insurance
- −$1,555
- − Repairs & maintenance
- −$2,106
- − Management
- −$2,106
- − HOA
- −$120
- − Depreciation
- −$9,048
- Taxable loss
- −$10,695
- Est. tax savings @ 24.0%
- +$2,567
- After-tax cash flow
- $-2,547/yr
For passive investors: Depreciation is non-cash, so a rental often shows a tax loss while cash-flowing — sheltering income. Rental losses are passive: they offset passive income freely, and up to $25,000/yr can offset ordinary (W-2) income if you actively participate and your MAGI is under $100k (phasing out to $0 by $150k); unused losses carry forward. On sale, claimed depreciation is recaptured at up to 25%, and gains may owe capital-gains tax (a 1031 exchange can defer both). Figures are a year-1 estimate at your 24.0% rate — not tax advice; consult a CPA.
Condition & rehab AI · 5 photos
This fully loaded Conaway home is in excellent condition with no visible repairs needed. Smart home and security features enhance its value for both resale and rental.
Value-add opportunities
- Both Smart home technology — Enhances convenience and energy efficiency
- Both Smart security system — Improves safety and peace of mind
Renovation cost estimate screening
Value-add ROI direction
- Both Smart home technology — Enhances convenience and energy efficiency ↑
- Both Smart security system — Improves safety and peace of mind ↑
ⓘ Cost ranges are severity-bucket heuristics (US national rule-of-thumb). Get contractor quotes + a written scope before underwriting a rehab budget.
Schools (NCES district)
- District
- Hallsville ISD
- NCES district ID
- 4822170
- Math proficiency
- 30% ▼ -2.00%
- Reading proficiency
- 40% ▲ 2.00%
- Median HH income
- $57,770
- Composite
- 31.05/100
- National rank
- #6081
- State rank
- #490 of 826 in TX
Livability — Longview
- Score
- 73/100
- State rank
- #213
- US rank
- #5287
Category grades
Schools grade is shown separately in the Schools card above.
Census & demographics
- Census place
- Longview, TX
- County
- Gregg County · 128,826 people
- City population
- 103,792
- Metro
- Longview, TX
- Population (ZIP)
- 15,780
- Household income
- $65,700
- Rent vs Own
- Severe rent burden
- 761.0
Population outlook (Harrison County) Hauer SSP2
- Today (2025)
- 68,691 people
- By 2030
- 69,317 · +0.9%
- By 2040
- 69,973 · +1.9%
- By 2050
- 70,090 · +2.0%
- By 2075
- 70,607 · +2.8%
- By 2100
- 67,546 · -1.7%
Race, ethnicity, and origin ACS 2023
- Neighborhood character
- Diverse neighborhood (Simpson 0.63)
- Race & ethnicity
- White 53% Black 21% Hispanic / Latino 21% Two or more races 13% Asian 3%
- Hispanic origin (detail)
- Mexican 17%
- Common ancestry
- Lithuanian 3% Slovak 3% Romanian 1%
- Foreign-born
- 10% · Canada, Vietnam
- Languages at home
- 81% English-only · Spanish 16% Other Indo-European 1% Other Asian/Pacific 1%
Political lean MEDSL · Harrison
- 2024 margin
- Solid R (+50.6) · D 24.4% · R 75.0%
- 2008→2024 swing
- -19.2pp toward R · 2008: -31.4pp · 2024: -50.6pp
- All cycles
- 2024: R+50.6 2020: R+45.6 2016: R+43.9 2012: R+34.6 2008: R+31.4
Not yet ingested
- Civics
- —
Market trends
- HPI YoY
- ▼ -107.73%
- Current HPI
- 252.0752
- Rent YoY
- ▲ 3.29%
- Metro
- Longview, TX
- State GDP YoY
- ▲ 3.95%
- F500 in state
- 110
Industry mix (Fortune 500 HQ in TX)
| Industry | F500 HQs | Revenue |
|---|---|---|
| Energy | 16 | $1,198B |
|
||
| Technology | 5 | $198B |
|
||
| Engineering / Construction | 4 | $72B |
|
||
| Energy Services | 3 | $60B |
|
||
| Utilities | 3 | $41B |
|
||
| Healthcare | 2 | $330B |
|
||
Price history
1 event — show timeline
- 2025-08-02 Listed $269,990 Zillow
Cash-flow waterfall
monthlySold comps — $/sqft
last 12 mo · ≤1 miLoading sold comps…