2809 Thompson Hollow Rd · Margaretville, NY
Flood risk 3/10 · Minor
- FEMA flood zone
- X (unshaded)
- Chance of flooding over 30 yrs
- 0.12%
- Est. flood insurance / yr
- $507 – $1,088
Fire risk 1/10 · Minimal
- Est. fire insurance / yr
- $691 – $1,283
Heat risk 1/10 · Minimal
- Hot days now (above 86°F)
- 7 days/yr
- Hot days in 30 yrs
- 17 days/yr
Wind risk 2/10 · Minimal
- Chance of severe wind over 30 yrs
- 1.0%
Air-quality risk 1/10 · Minimal
- Unhealthy air days now
- 0 days/yr
- Unhealthy air days in 30 yrs
- 0 days/yr
Risk factors via First Street. Map © Google.
Why this score? — see what drove the D grade
The composite is a weighted blend of 9 inputs, each scored 0–100. Each bar is that input's sub-score; the figure is the points it added to the 100-point composite (weight × sub-score).
- ARV discount +15.0/15.0
- Appreciation +7.2/10.0
- Cash flow +6.7/30.0
- Livability +3.2/5.0
- Schools +2.6/10.0
- Rent growth +2.5/5.0
- Condition / age +2.5/5.0
- 1% rule +0.9/10.0
- DSCR +0.9/10.0
$525,000
🖨 Deal sheet (PDF) 📄 Offer letter ✓ Due diligence
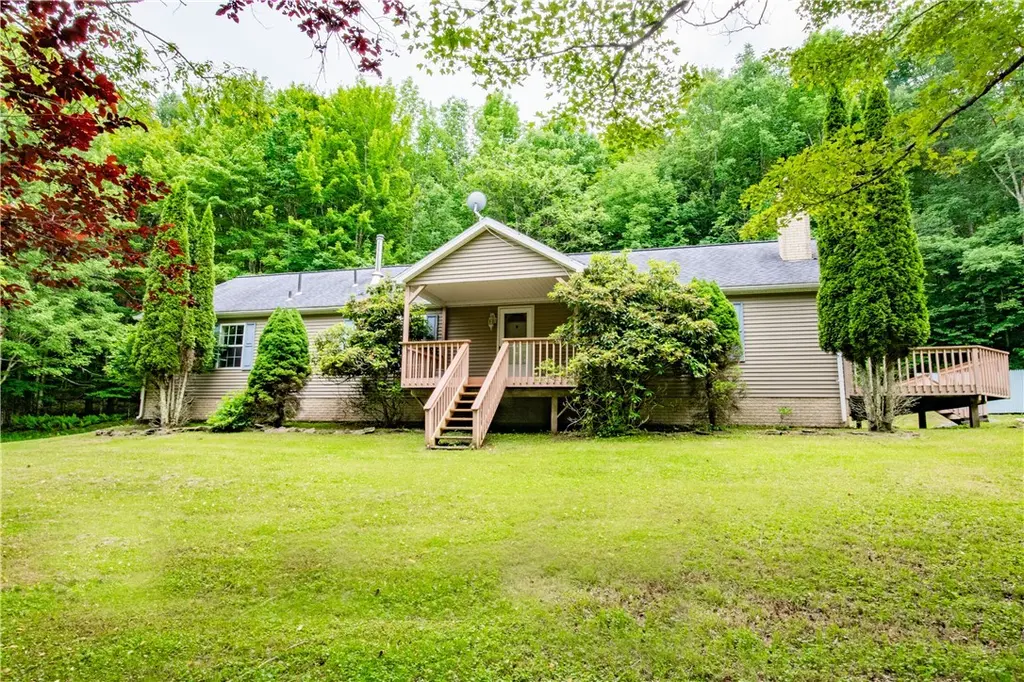
Listing remarks
This secluded ranch comes with a whole mountainside. Located off of a town-maintained road, in one of the most scenic valleys in the Catskills. The property is 156 acres spanning over three tax parcels. The top of the property crosses over the ridge of the mountain. Excellent for hiking, hunting, or enjoying solitude. The house has all new appliances and a modern propane boiler. There is a fireplace and a wood stove for enjoying the winter months. The primary bedroom has a spacious ensuite bath with a shower and Jacuzzi tub. Mature landscaping fills the lawn. Deer can be spotted crossing the property to access the nearby brook. Located only 2.5 hours to the GW bridge, 14 mins to Margaretvil
Key facts
- 3.52 acre lot
- Built 1997
- Listed 52 days
Property features AI
Exterior
- Parking: No garage
- Utilities: Well water; Septic tank
- Home design: Single-story home; Existing construction; Frame construction
- Construction: Frame construction
- Exterior features: Gravel driveway; Leased propane tank
Interior
- Kitchen: Gas oven; Gas range
- Bedrooms: 3 bedrooms on the main level
- Flooring: Laminate; Varies
- Bathrooms: 2 full bathrooms; 1 half bathroom; 3 bathrooms on the main level
- Heating & cooling: Propane heating; Baseboard heating; Has heating
- Interior features: Country kitchen; Crawl space basement; Has fireplace (2 total)
- Laundry & utility: Propane water heater
Neighborhood map
What this means for you Summary
Snapshot
- This is a 3-bed/2.5-bath single-family listed at $525k.
Deal economics
- At list price, monthly cash flow is $-851 ($-10k/yr) — negative.
- To cash-flow at today's rent, offer at most $375k (28.6% below list).
- To meet the 1% rule (rent ≥ 1% of price), the offer needs to be $311k (40.7% below list).
- Recommended offer: $311k (40.7% below list) — sets the bar for 1% rule.
Location & tenants
- Location reads 65/100 on livability (#711 in NY) — a middle-class / working-renter tenant base. Strengths: health & safety A, cost of living A-; Watch: employment D, schools F, crime F.
- Margaretville Central School District (rural): math 30% / reading 25% proficiency, ranked #734 of 755 in NY (top 97%) — low school quality limits family demand, transient renter base, plan for 1-2y turnover.
- Market conditions: 46 active listings in the ZIP; 66 units permitted in Delaware County in 2024 (0 in 5+ unit buildings).
Forward outlook
- In year one you build about $27k of equity ($4k loan paydown + $23k appreciation (4.4% local appreciation)).
- Delaware County population projected at -27% by 2050 — secular population decline; favor cash flow + early exit over multi-decade hold.
- By year 2, paydown + projected appreciation supports a ~$43k cash-out refi (75% LTV) — recoverable capital for the next deal without selling this one.
Negotiation context
- It's been on market 52 days — a 3% lower offer ($509k) is reasonable based on typical stale-listing flexibility.
- 3 sale attempts with the ask held roughly flat each time — persistent listings suggest the price (not the market) is what's stuck; bring a comps-based counter.
Questions for the listing agent
- What do current leases actually rent for vs. the listed asking? Can we see a recent rent roll and the last 12 months of T-12 income?
- It's been on market 52 days. Have you received any prior offers? Is the seller open to a 41% concession, seller financing, or rate buy-down credit?
- Is there a deadline driving the sale (1031 exchange, divorce, estate, relocation)? That informs how much negotiation room exists.
- Schools are F-rated, which usually means shorter tenancies and higher turnover. Who's the typical renter profile here, and what's been the actual vacancy rate?
- Crime grade is F in this area — have there been break-ins, vandalism, or insurance claims at this property in the last 3 years? What carrier currently insures it and at what premium?
- The area grade is low — what's the realistic commute time and amenity access for the typical tenant pool here? Any planned neighborhood developments (good or bad) we should know about?
- What's the average days-on-market for RENTAL listings here right now (not sales)? A rising rental-DOM trend means longer vacancies and softer asking-rent achievability than the comps imply.
- What's the recent tenant-quality profile in this submarket — average credit score on applications, eviction rate, late-payment / NSF rate, and stable-employment percentage? A property-management company in the area should have these aggregated.
- How much new for-sale + rental construction is in the pipeline within 1–3 miles? Heavy new supply typically softens prices + rents 12–24 months out; constrained supply supports both.
Investment metrics
- 1% rule
- 0.59% ✗
- Cap rate
- 4.35%
- Cash-on-cash
- -6.95%
- DSCR
- 0.69
- GRM
- 14.1
CMA / ARV
- ARV (median comp)
- $692,641
- List price
- $525,000
- Delta
- -24.20%
- Verdict
- UNDERPRICED
- Comps
- 1 within 2.0 mi
Projected returns pro-forma
4.36% appreciation · 3.0% rent growth · sell at horizon
- IRR
- 5.2%
- Equity multiple
- 1.32×
- Total profit
- $47,746
- Equity at exit
- $277,409
- IRR
- 7.8%
- Equity multiple
- 2.36×
- Total profit
- $200,644
- Equity at exit
- $462,920
Cash invested: $147,000 (down + closing). Projections, not guarantees.
Landlord ↔ Tenant lean methodology
- Overall (STATE)
- 15 Strongly Tenant-Friendly
- State New York
- 15 Strongly Tenant-Friendly · D+10
- County
- — inherits STATE
- City
- — inherits STATE
ZIP-level market 12455
- Home prices YoY
- 1.2%
- Active inventory
- 46
- Price-to-rent
- 14.1×
Monthly cashflow live
- Estimated rent
- $3,112 medium interval (Pro) →
- Mortgage (P&I)
- −$2,753
- Tax from tax record
- −$338 /mo · $4,057/yr
- Insurance
- −$219
- HOA
- −$0
- Vacancy / Maint / Mgmt
- −$654
- Net cashflow
- $-851
Break-even live
Sensitivity live
| Price | -10% $-554 | -5% $-703 | +0% $-851 | +5% $-1,000 | +10% $-1,148 |
|---|---|---|---|---|---|
| Rent | -10% $-1,097 | -5% $-974 | +0% $-851 | +5% $-728 | +10% $-605 |
| Rate | -1.0pp $-587 | -0.5pp $-718 | base $-851 | +0.5pp $-987 | +1.0pp $-1,126 |
UW: 25.0% down · 7.5% · 30yr · 1.5% tax · 5.0% vac · 8.0% maint · 8.0% mgmt
Financing live
Cash to close
- Down payment
- $131,250
- Closing costs
- $15,750
- Reserves months
- —
- Total cash needed
- —
Loan-product check · same deal, 3 products live
Conventional
25% down · 7.5% · 30yr
- Down + closing
- —
- Monthly P&I
- —
- Monthly cashflow
- —
- DSCR
- —
- Eligible?
- —
Personal DTI + credit; lowest rate.
DSCR
20% down · 8.5% · 30yr
- Down + closing
- —
- Monthly P&I
- —
- Monthly cashflow
- —
- DSCR
- —
- Eligible?
- —
No personal income docs; deal must DSCR.
Hard money
10% down · 12.0% · 12mo
- Down + closing
- —
- Monthly P&I
- —
- Monthly cashflow
- —
- DSCR
- —
- Eligible?
- —
Short-term bridge; refi at stabilization.
Listing history 21 events
-
2026-06-21days on market $525,000 Active 52 DOM
-
2026-06-21days on market $525,000 Active 51 DOM
-
2026-06-18days on market $525,000 Active 49 DOM
-
2026-06-17days on market $525,000 Active 48 DOM
-
2026-06-16days on market $525,000 Active 47 DOM
-
2026-06-15days on market $525,000 Active 46 DOM
-
2026-06-13days on market $525,000 Active 44 DOM
-
2026-06-12days on market $525,000 Active 43 DOM
-
2026-06-09days on market $525,000 Active 40 DOM
-
2026-06-09status $525,000 Active 39 DOM
-
2026-06-08days on market $525,000 Active Under Contract 39 DOM
-
2026-06-07days on market $525,000 Active Under Contract 38 DOM
-
2026-06-04days on market $525,000 Active Under Contract 34 DOM
-
2026-06-03status $525,000 Active Under Contract 33 DOM
-
2026-06-02days on market $525,000 Active 33 DOM
-
2026-06-01days on market $525,000 Active 32 DOM
-
2026-05-31days on market $525,000 Active 31 DOM
-
2026-04-30$525,000 Active 1018-char remark
-
2025-11-20historical
-
2025-09-14price $650,000
-
2025-07-06$750,000 Active
ⓘ Source: listings_history table (triggers on properties + properties_extension) + one-shot
backfill from property_details.listing_events for pre-trigger history.
Tax reassessment forecast NY · Partial reset (capped growth)
- Current annual tax
- $4,057 · $338/mo
- Projected year-2 tax
- $6,465 · $539/mo
- Expected delta
- +$2,408/yr (+$201/mo · 59.3%)
ⓘ Screening estimate from a state-policy table — verify with the county assessor before closing.
Climate risk First Street
- Flood 3/10 Moderate FEMA zone X (unshaded) · 12% chance over 30 yrs
- Wildfire 1/10 Low
- Heat 1/10 Low 7 d/yr ≥86°F today · 17 d/yr by 30 yrs out
- Wind 2/10 Low 100% chance of damaging wind over 30 yrs
- Air quality 1/10 Low 0 unhealthy d/yr today · 0 by 30 yrs out
Nearby sold comps map
Loading sold comps map…
Walkable amenities ~0.75 mi
Loading nearby amenities…
Taxation est. · year 1
- Rental income
- $37,349
- − Mortgage interest
- −$29,408
- − Property taxes
- −$4,057
- − Insurance
- −$2,625
- − Repairs & maintenance
- −$2,988
- − Management
- −$2,988
- − Depreciation
- −$15,273
- Taxable loss
- −$19,990
- Est. tax savings @ 24.0%
- +$4,798
- After-tax cash flow
- $-5,417/yr
For passive investors: Depreciation is non-cash, so a rental often shows a tax loss while cash-flowing — sheltering income. Rental losses are passive: they offset passive income freely, and up to $25,000/yr can offset ordinary (W-2) income if you actively participate and your MAGI is under $100k (phasing out to $0 by $150k); unused losses carry forward. On sale, claimed depreciation is recaptured at up to 25%, and gains may owe capital-gains tax (a 1031 exchange can defer both). Figures are a year-1 estimate at your 24.0% rate — not tax advice; consult a CPA.
Schools (NCES district)
- District
- Margaretville Central School District
- NCES district ID
- 3618510
- Math proficiency
- 30% ▬ 0.00%
- Reading proficiency
- 25% ▼ -5.00%
- Median HH income
- $42,369
- Composite
- 26.35/100
- National rank
- #12675
- State rank
- #734 of 755 in NY
Livability — Margaretville
- Score
- 65/100
- State rank
- #711
- US rank
- #13534
Category grades
Schools grade is shown separately in the Schools card above.
Census & demographics
- Population (ZIP)
- 1,859
Population outlook (Delaware County) Hauer SSP2
- Today (2025)
- 42,668 people
- By 2030
- 40,337 · -5.5%
- By 2040
- 35,514 · -16.8%
- By 2050
- 31,265 · -26.7%
- By 2075
- 24,455 · -42.7%
- By 2100
- 19,529 · -54.2%
Race, ethnicity, and origin ACS 2023
- Neighborhood character
- Predominantly White (74%)
- Race & ethnicity
- White 74% Hispanic / Latino 21% Two or more races 11%
- Hispanic origin (detail)
- Puerto Rican 1% Dominican 2%
- Common ancestry
- Romanian 5% Iranian 3% Slovak 3%
- Foreign-born
- 21% · Canada, South Korea
- Languages at home
- 77% English-only · Spanish 12% Russian/Polish/Slavic 2% Other Indo-European 2%
Political lean MEDSL · Delaware
- 2024 margin
- R (+19.8) · D 40.1% · R 59.9%
- 2008→2024 swing
- -14.6pp toward R · 2008: -5.2pp · 2024: -19.8pp
- All cycles
- 2024: R+19.8 2020: R+18.4 2016: R+29.2 2012: R+9.6 2008: R+5.2
Not yet ingested
- Civics
- —
Market trends
- HPI YoY
- ▲ 4.36%
- Current HPI
- 355.7672
- Rent YoY
- —
- Metro
- —
- State GDP YoY
- ▲ 2.60%
- F500 in state
- 92
Industry mix (Fortune 500 HQ in NY)
| Industry | F500 HQs | Revenue |
|---|---|---|
| Financial Services | 10 | $950B |
|
||
| Consumer Goods | 9 | $162B |
|
||
| Insurance | 4 | $225B |
|
||
| Telecommunications | 2 | $144B |
|
||
| Pharmaceuticals | 2 | $112B |
|
||
| Media / Entertainment | 2 | $69B |
|
||
Price history
-30.0% since first listed6 events — show timeline
- 2026-06-08 Relisted — UNYREIS
- 2026-06-02 Contingent — UNYREIS
- 2026-04-30 Listed $525,000 UNYREIS
- 2025-11-20 Listing Removed — UNYREIS
- 2025-09-14 Price Changed $650,000 UNYREIS
- 2025-07-06 Listed $750,000 UNYREIS
Property tax history
+1.5%/yrLatest (2025): $4,057 · +1.0% YoY. Source: county tax records.
Cash-flow waterfall
monthlySold comps — $/sqft
last 12 mo · ≤1 miLoading sold comps…