7450 E Continental Mountain Estates Dr #1 · Cave Creek, AZ
Flood risk 1/10 · Minimal
- FEMA flood zone
- X (shaded)
- Chance of flooding over 30 yrs
- 0.0%
- Est. flood insurance / yr
- $507 – $1,088
Fire risk 6/10 · Moderate
- Est. fire insurance / yr
- $610 – $1,132
Heat risk 8/10 · Major
- Hot days now (above 105°F)
- 7 days/yr
- Hot days in 30 yrs
- 20 days/yr
Wind risk 1/10 · Minimal
- Chance of severe wind over 30 yrs
- —
Air-quality risk 3/10 · Minor
- Unhealthy air days now
- 2 days/yr
- Unhealthy air days in 30 yrs
- 4 days/yr
Risk factors via First Street. Map © Google.
Why this score? — see what drove the F grade
The composite is a weighted blend of 9 inputs, each scored 0–100. Each bar is that input's sub-score; the figure is the points it added to the 100-point composite (weight × sub-score).
- Cash flow +7.6/30.0
- ARV discount +7.5/15.0
- Schools +5.4/10.0
- Rent growth +2.5/5.0
- Livability +2.5/5.0
- Condition / age +2.5/5.0
- 1% rule +2.2/10.0
- DSCR +1.7/10.0
- Appreciation +0.0/10.0
$550,000
🖨 Deal sheet 📄 Offer letter ✓ Due diligence
Listing remarks MLS
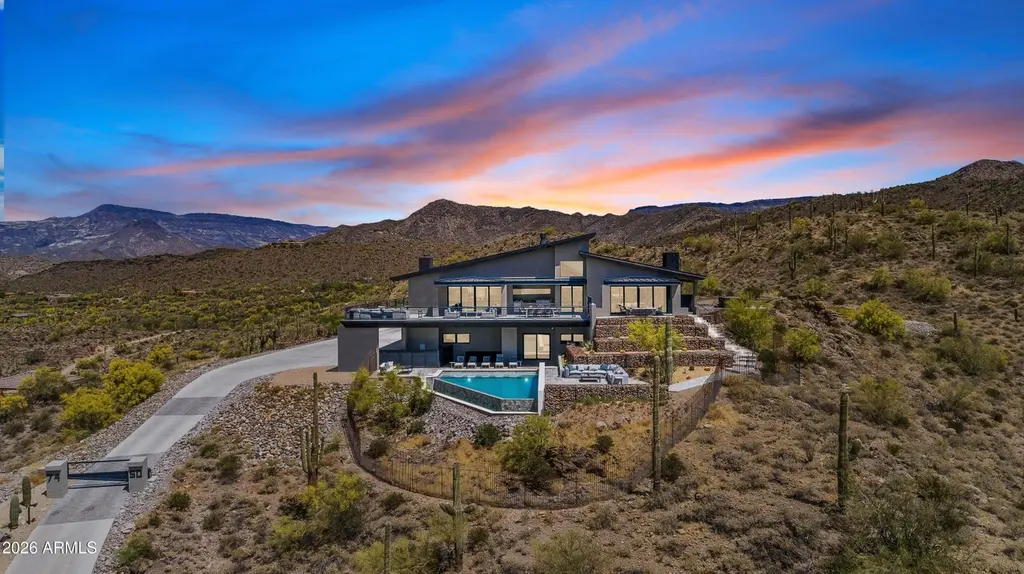
New co-ownership opportunity by Pacaso: Own one-eighth of Desert Haven, a professionally managed, turnkey home. As you ascend the winding driveway, the setting unfolds into a private desert retreat. Positioned on a secluded mountaintop, the home features glass walls, wraparound balconies, a gourmet kitchen and a resort-style infinity pool. Sleek, contemporary architecture emphasizes seamless indoor-outdoor living, beginning in the spacious great room. The gourmet kitchen is equipped with stainless steel appliances and a quartz waterfall island. A formal dining area and executive bar provide ample space for entertaining, complemented by a temperature-controlled whiskey and wine room. The primary suite includes a fireplace, wine fridge and direct access to the patio. The en suite bathroom offers a soaking tub, tiled shower, dual sinks and a makeup vanity. An office and game room open to the infinity pool and patio. The residence includes an elevator and is offered fully furnished and professionally decorated.
Key facts
- Glass walls
- Wraparound balconies
- Gourmet kitchen
Tags
Neighborhood map
What this means for you Summary
Snapshot
- This is a 4-bed/4.5-bath single-family listed at $550k.
Deal economics
- At list price, monthly cash flow is $-666 ($-8k/yr) — negative.
- To cash-flow at today's rent, offer at most $454k (17.5% below list).
- To meet the 1% rule (rent ≥ 1% of price), the offer needs to be $397k (27.9% below list).
- Recommended offer: $397k (27.9% below list) — sets the bar for 1% rule.
- Cap rate 4.8% vs local median 1.5% in Cave Creek — top-decile yield for the area; either an underpriced asset or a hidden risk that comps aren't pricing in. Stress-test before assuming the spread holds.
Location & tenants
- Location reads 50/100 on livability (#325 in AZ) — a working-class tenant base; expect higher turnover. Strengths: schools A, crime A, housing B; Watch: amenities F, commute F, employment F.
- Cave Creek Unified District (4244) (urban): math 57% / reading 59% proficiency, ranked #13 of 249 in AZ (top 5%) — acceptable for families but not a draw, mixed tenant base, ~2y average lease; only 8% free/reduced lunch — higher-income household profile.
- Market conditions: 394 active listings in the ZIP; high-income renter base; 36,011 units permitted in Maricopa County in 2024 (12,801 in 5+ unit buildings).
- This rent runs 37% of the median local income ($129k/yr) — at the standard rent-burdened threshold; future hikes will face affordability resistance.
Forward outlook
- Local home prices are declining (-3.0%/yr); year-one equity from $4k of loan paydown is wiped out by about $16k of value loss. Plan a longer hold.
- Maricopa County population projected at +38% by 2050 — long-run rental-demand tailwind backs the buy-and-hold thesis.
Negotiation context
- It's been on market 105 days — a 9% lower offer ($500k) is reasonable based on typical stale-listing flexibility.
- 2 sale attempts since 2y ago with the ask held roughly flat each time — persistent listings suggest the price (not the market) is what's stuck; bring a comps-based counter.
Risks & watch-outs
- Climate carrying-cost: major wildfire risk; extreme-heat days projected 7→20/yr by 2055 (HVAC capex compounding) — expect insurance premiums to compound above CPI over the hold.
Questions for the listing agent
- What do current leases actually rent for vs. the listed asking? Can we see a recent rent roll and the last 12 months of T-12 income?
- It's been on market 105 days. Have you received any prior offers? Is the seller open to a 28% concession, seller financing, or rate buy-down credit?
- Why hasn't it sold? Are there any deal-killer items the seller is aware of (foundation, flood, title, zoning, code violations)?
- Is there a deadline driving the sale (1031 exchange, divorce, estate, relocation)? That informs how much negotiation room exists.
- Schools are A-rated — typically a magnet for longer-tenancy family renters. What's the average tenant stay here, and is there a school-zone premium baked into asking?
- The area grade is low — what's the realistic commute time and amenity access for the typical tenant pool here? Any planned neighborhood developments (good or bad) we should know about?
- What's the average days-on-market for RENTAL listings here right now (not sales)? A rising rental-DOM trend means longer vacancies and softer asking-rent achievability than the comps imply.
- What's the recent tenant-quality profile in this submarket — average credit score on applications, eviction rate, late-payment / NSF rate, and stable-employment percentage? A property-management company in the area should have these aggregated.
- How much new for-sale + rental construction is in the pipeline within 1–3 miles? Heavy new supply typically softens prices + rents 12–24 months out; constrained supply supports both.
Investment metrics
- 1% rule
- 0.72% ✗
- Cap rate
- 4.84%
- Cash-on-cash
- -5.19%
- DSCR
- 0.77
- GRM
- 11.6
CMA / ARV
- ARV (median comp)
- $2,755,585
- List price
- $550,000
- Delta
- -80.04%
- Verdict
- UNDERPRICED
- Comps
- 8 within 1.0 mi
Projected returns pro-forma
-3.0% appreciation · 3.0% rent growth · sell at horizon
- IRR
- -25.1%
- Equity multiple
- 0.15×
- Total profit
- $-131,488
- Equity at exit
- $82,007
- IRR
- -21.1%
- Equity multiple
- -0.10×
- Total profit
- $-168,883
- Equity at exit
- $47,554
Cash invested: $154,000 (down + closing). Projections, not guarantees.
Landlord ↔ Tenant lean methodology
- Overall (STATE)
- 87 Strongly Landlord-Friendly
- State Arizona
- 87 Strongly Landlord-Friendly · R+3
- County
- — inherits STATE
- City
- — inherits STATE
ZIP-level market 85331
- Home prices YoY
- -29.8%
- Active inventory
- 394
- Price-to-rent
- 11.6×
Monthly cashflow live
- Estimated rent
- $3,968 medium interval (Pro) →
- Mortgage (P&I)
- −$2,884
- Tax est. 1.5%
- −$688 /mo · $8,250/yr
- Insurance
- −$229
- HOA
- −$0
- Vacancy / Maint / Mgmt
- −$833
- Net cashflow
- $-666
Break-even live
UW: 25.0% down · 7.5% · 30yr · 1.5% tax · 5.0% vac · 8.0% maint · 8.0% mgmt
Financing live
Cash to close
- Down payment
- $137,500
- Closing costs
- $16,500
- Reserves months
- —
- Total cash needed
- —
Loan-product check · same deal, 3 products live
Conventional
25% down · 7.5% · 30yr
- Down + closing
- —
- Monthly P&I
- —
- Monthly cashflow
- —
- DSCR
- —
- Eligible?
- —
Personal DTI + credit; lowest rate.
DSCR
20% down · 8.5% · 30yr
- Down + closing
- —
- Monthly P&I
- —
- Monthly cashflow
- —
- DSCR
- —
- Eligible?
- —
No personal income docs; deal must DSCR.
Hard money
10% down · 12.0% · 12mo
- Down + closing
- —
- Monthly P&I
- —
- Monthly cashflow
- —
- DSCR
- —
- Eligible?
- —
Short-term bridge; refi at stabilization.
Listing history 17 events
-
2026-06-18days on market $550,000 Active 105 DOM
-
2026-06-17days on market $550,000 Active 104 DOM
-
2026-06-16days on market $550,000 Active 103 DOM
-
2026-06-15days on market $550,000 Active 102 DOM
-
2026-06-13days on market $550,000 Active 100 DOM
-
2026-06-13days on market $550,000 Active 99 DOM
-
2026-06-09days on market $550,000 Active 96 DOM
-
2026-06-08days on market $550,000 Active 95 DOM
-
2026-06-07days on market $550,000 Active 94 DOM
-
2026-06-04days on market $550,000 Active 91 DOM
-
2026-06-03days on market $550,000 Active 90 DOM
-
2026-06-02days on market $550,000 Active 89 DOM
-
2026-06-01days on market $550,000 Active 88 DOM
-
2026-05-31days on market $550,000 Active 87 DOM
-
2026-03-05$550,000 Active 1022-char remark
Show marketing remark (1022 chars)
New co-ownership opportunity by Pacaso: Own one-eighth of Desert Haven, a professionally managed, turnkey home. As you ascend the winding driveway, the setting unfolds into a private desert retreat. Positioned on a secluded mountaintop, the home features glass walls, wraparound balconies, a gourmet kitchen and a resort-style infinity pool. Sleek, contemporary architecture emphasizes seamless indoor-outdoor living, beginning in the spacious great room. The gourmet kitchen is equipped with stainless steel appliances and a quartz waterfall island. A formal dining area and executive bar provide ample space for entertaining, complemented by a temperature-controlled whiskey and wine room. The primary suite includes a fireplace, wine fridge and direct access to the patio. The en suite bathroom offers a soaking tub, tiled shower, dual sinks and a makeup vanity. An office and game room open to the infinity pool and patio. The residence includes an elevator and is offered fully furnished and professionally decorated.
-
2026-02-21historical
-
2024-06-24$599,000 Active
ⓘ Source: listings_history table (triggers on properties + properties_extension) + one-shot
backfill from property_details.listing_events for pre-trigger history.
Climate risk First Street
- Flood 1/10 Low FEMA zone X (shaded) · 0% chance over 30 yrs
- Wildfire 6/10 Major
- Heat 8/10 Severe 7 d/yr ≥105°F today · 20 d/yr by 30 yrs out
- Wind 1/10 Low
- Air quality 3/10 Moderate 2 unhealthy d/yr today · 4 by 30 yrs out
Nearby sold comps map
Loading sold comps map…
Walkable amenities ~0.75 mi
Loading nearby amenities…
Taxation est. · year 1
- Rental income
- $47,618
- − Mortgage interest
- −$30,809
- − Property taxes
- −$8,250
- − Insurance
- −$2,750
- − Repairs & maintenance
- −$3,809
- − Management
- −$3,809
- − Depreciation
- −$16,000
- Taxable loss
- −$17,810
- Est. tax savings @ 24.0%
- +$4,274
- After-tax cash flow
- $-3,719/yr
For passive investors: Depreciation is non-cash, so a rental often shows a tax loss while cash-flowing — sheltering income. Rental losses are passive: they offset passive income freely, and up to $25,000/yr can offset ordinary (W-2) income if you actively participate and your MAGI is under $100k (phasing out to $0 by $150k); unused losses carry forward. On sale, claimed depreciation is recaptured at up to 25%, and gains may owe capital-gains tax (a 1031 exchange can defer both). Figures are a year-1 estimate at your 24.0% rate — not tax advice; consult a CPA.
Schools (NCES district)
- District
- Cave Creek Unified District (4244)
- NCES district ID
- 0400001
- Math proficiency
- 57% ▼ -9.00%
- Reading proficiency
- 59% ▼ -8.00%
- Median HH income
- $102,788
- Composite
- 54.46/100
- National rank
- #1351
- State rank
- #13 of 249 in AZ
Livability — Cave Creek
- Score
- 50/100
- State rank
- #325
- US rank
- #25577
Category grades
Schools grade is shown separately in the Schools card above.
Census & demographics
- Census place
- Cave Creek, AZ
- County
- Maricopa County · 4,537,380 people
- City population
- 31,968
- Metro
- Phoenix-Mesa-Chandler, AZ
- Population (ZIP)
- 31,968
- Household income
- $129,083
- Rent vs Own
- Severe rent burden
- 169.0
Population outlook (Maricopa County) Hauer SSP2
- Today (2025)
- 4,979,203 people
- By 2030
- 5,378,229 · +8.0%
- By 2040
- 6,156,598 · +23.6%
- By 2050
- 6,872,376 · +38.0%
- By 2075
- 8,401,270 · +68.7%
- By 2100
- 9,247,439 · +85.7%
Race, ethnicity, and origin ACS 2023
- Neighborhood character
- Predominantly White (86%)
- Race & ethnicity
- White 86% Hispanic / Latino 7% Two or more races 5% Asian 2%
- Hispanic origin (detail)
- Mexican 4%
- Common ancestry
- Romanian 5% Italian 4% Portuguese 4%
- Foreign-born
- 6% · Canada
- Languages at home
- 93% English-only · Spanish 3% Other Indo-European 1% Russian/Polish/Slavic 1%
Political lean MEDSL · Maricopa
- 2024 margin
- Toss-up / Even · D 47.7% · R 51.2% · Other 1.1%
- 2008→2024 swing
- +7.1pp toward D · 2008: -10.6pp · 2024: -3.5pp
- All cycles
- 2024: R+3.5 2020: D+2.2 2016: R+3.5 2012: R+12.0 2008: R+10.6
Not yet ingested
- Civics
- —
Market trends
- HPI YoY
- ▼ -134.66%
- Current HPI
- 316.6855
- Rent YoY
- —
- Metro
- Phoenix-Mesa-Chandler, AZ
- State GDP YoY
- ▲ 4.54%
- F500 in state
- 20
Industry mix (Fortune 500 HQ in AZ)
| Industry | F500 HQs | Revenue |
|---|---|---|
| Technology | 2 | $13B |
|
||
| Mining / Metals | 1 | $23B |
|
||
| Environmental Services | 1 | $16B |
|
||
| Metals / Steel | 1 | $14B |
|
||
| Technology Distribution | 1 | $9B |
|
||
| Homebuilding | 1 | $8B |
|
||
Price history
-8.2% since first listed3 events — show timeline
- 2026-03-05 Listed $550,000 ARMLS
- 2026-02-21 Listing Removed — ARMLS
- 2024-06-24 Listed $599,000 ARMLS
Cash-flow waterfall
monthlySold comps — $/sqft
last 12 mo · ≤1 miLoading sold comps…