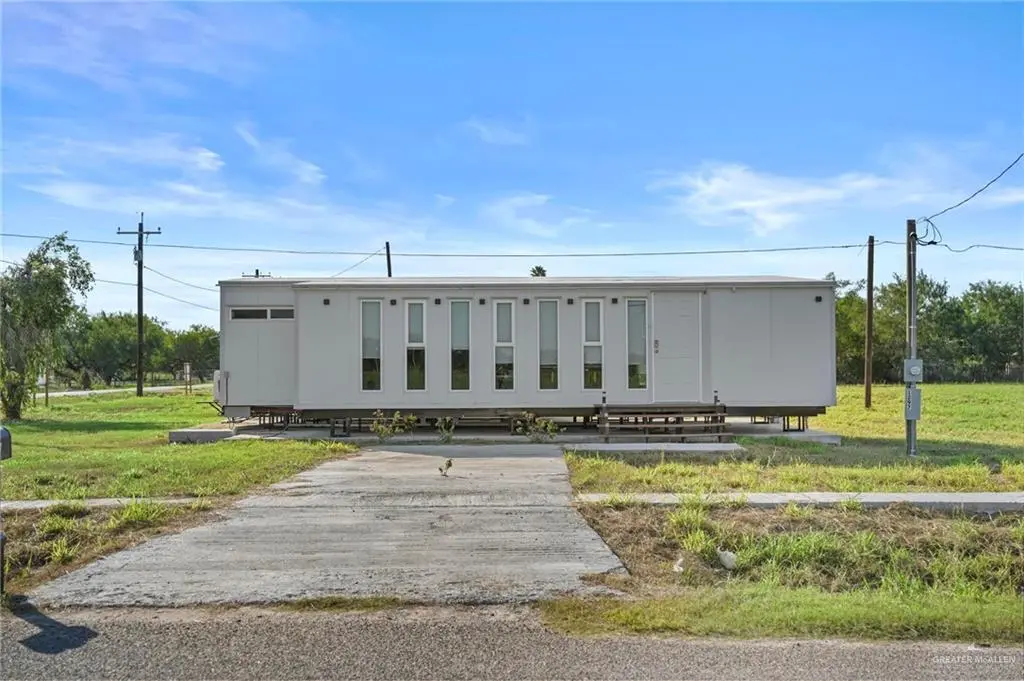
1293 S 3rd St · South Alamo, TX
Flood risk No data
- FEMA flood zone
- —
- Chance of flooding over 30 yrs
- —
- Est. flood insurance / yr
- —
Fire risk No data
- Est. fire insurance / yr
- —
Heat risk No data
- Hot days now (above threshold)
- —
- Hot days in 30 yrs
- —
Wind risk No data
- Chance of severe wind over 30 yrs
- —
Air-quality risk No data
- Unhealthy air days now
- —
- Unhealthy air days in 30 yrs
- —
Risk factors via First Street. Map © Google.
Why this score? — see what drove the D- grade
The composite is a weighted blend of 9 inputs, each scored 0–100. Each bar is that input's sub-score; the figure is the points it added to the 100-point composite (weight × sub-score).
- ARV discount +15.0/15.0
- Cash flow +9.9/30.0
- 1% rule +3.0/10.0
- DSCR +2.8/10.0
- Livability +2.8/5.0
- Rent growth +2.5/5.0
- Condition / age +2.5/5.0
- Schools +1.1/10.0
- Appreciation +0.0/10.0
$185,900
🖨 Deal sheet (PDF) 📄 Offer letter ✓ Due diligence
Listing remarks MLS
Welcome to the FUTURE! This New Construction modular home in Alamo, Texas, this charming modular home is priced under $190K and sits on a spacious corner lot, offering ample yard space and privacy. The home gives you a modern, open-concept layout with 3 bedrooms and 3 bathrooms, perfect for a growing family or first-time buyers! The kitchen features sleek countertops and a built in island bar, while large windows throughout the home fill the space with natural light. Outside, the corner lot provides plenty of room for outdoor activities or future landscaping projects. Located in a peaceful neighborhood with easy access to local schools and shopping, this property is an excellent opportunity for affordable homeownership. Don’t miss out on this well-maintained, move-in ready home!
Key facts
- Modular home
- New construction
- Spacious corner lot
Tags
Neighborhood map
What this means for you Summary
Snapshot
- This is a 3-bed/3.0-bath single-family listed at $186k.
Deal economics
- At list price, monthly cash flow is $-116 ($-1k/yr) — negative.
- To cash-flow at today's rent, offer at most $169k (9.0% below list).
- To meet the 1% rule (rent ≥ 1% of price), the offer needs to be $148k (20.4% below list).
- Recommended offer: $148k (20.4% below list) — sets the bar for 1% rule.
Location & tenants
- Location reads 56/100 on livability (#1,320 in TX) — a working-class tenant base; expect higher turnover. Strengths: cost of living A+, housing A+, crime B; Watch: amenities F, commute F, employment F.
- Donna ISD (suburban): math 11% / reading 18% proficiency, ranked #821 of 826 in TX (top 99%) — low school quality limits family demand, transient renter base, plan for 1-2y turnover.
- Zoned schools: M Rivas Pri Discovery Academy (math 12% / reading 17%, grade F, #4,048 of 4,322 statewide, top 95%, 349 students, 93% FRL); A P Solis Middle (math 8% / reading 19%, grade F, #1,602 of 1,662 statewide, top 97%, 666 students, 93% FRL); Donna H S (math 16% / reading 21%, grade F, #1,436 of 1,632 statewide, top 88%, 2,095 students, 92% FRL) — zoned schools average 93% FRL vs 48% district-wide (44 pts higher); higher-poverty schools than district average — tighter screening recommended.
- Market conditions: 349 active listings in the ZIP; 2 comparable units currently listed for rent nearby; 7,378 units permitted in Hidalgo County in 2024 (641 in 5+ unit buildings).
- This rent runs 33% of the median local income ($53k/yr) — at the standard rent-burdened threshold; future hikes will face affordability resistance.
Forward outlook
- Local home prices are declining (-3.0%/yr); year-one equity from $1k of loan paydown is wiped out by about $6k of value loss. Plan a longer hold.
- Hidalgo County population projected at +28% by 2050 — long-run rental-demand tailwind backs the buy-and-hold thesis.
Negotiation context
- It's been on market 510 days — a 12% lower offer ($164k) is reasonable based on typical stale-listing flexibility.
- 2 sale attempts since 2y ago with the ask held roughly flat each time — persistent listings suggest the price (not the market) is what's stuck; bring a comps-based counter.
Questions for the listing agent
- What do current leases actually rent for vs. the listed asking? Can we see a recent rent roll and the last 12 months of T-12 income?
- It's been on market 510 days. Have you received any prior offers? Is the seller open to a 20% concession, seller financing, or rate buy-down credit?
- Why hasn't it sold? Are there any deal-killer items the seller is aware of (foundation, flood, title, zoning, code violations)?
- Is there a deadline driving the sale (1031 exchange, divorce, estate, relocation)? That informs how much negotiation room exists.
- Schools are F-rated, which usually means shorter tenancies and higher turnover. Who's the typical renter profile here, and what's been the actual vacancy rate?
- The area grade is low — what's the realistic commute time and amenity access for the typical tenant pool here? Any planned neighborhood developments (good or bad) we should know about?
- What's the average days-on-market for RENTAL listings here right now (not sales)? A rising rental-DOM trend means longer vacancies and softer asking-rent achievability than the comps imply.
- What's the recent tenant-quality profile in this submarket — average credit score on applications, eviction rate, late-payment / NSF rate, and stable-employment percentage? A property-management company in the area should have these aggregated.
- How much new for-sale + rental construction is in the pipeline within 1–3 miles? Heavy new supply typically softens prices + rents 12–24 months out; constrained supply supports both.
Investment metrics
- 1% rule
- 0.80% ✗
- Cap rate
- 5.55%
- Cash-on-cash
- -2.67%
- DSCR
- 0.88
- GRM
- 10.5
CMA / ARV
- ARV (median comp)
- $223,114
- List price
- $185,900
- Delta
- -16.68%
- Verdict
- UNDERPRICED
- Comps
- 20 within 1.0 mi
Show comp detail 1 sale within ~0.75 mi
| Address | Dist | Beds/Ba | Sqft | Sold | Price | $/sf | Match |
|---|---|---|---|---|---|---|---|
| 100 San Angelo Dr | 0.29mi | 3/3.5 | 1,292 (+13%) | 12mo | $139,999 | $108 | 53 |
Match score weights: distance 35% · size 25% · config 20% · recency 20%. Top-matched comps best support the ARV.
Projected returns pro-forma
-3.0% appreciation · 3.0% rent growth · sell at horizon
- IRR
- -20.7%
- Equity multiple
- 0.28×
- Total profit
- $-37,469
- Equity at exit
- $27,718
- IRR
- -14.0%
- Equity multiple
- 0.19×
- Total profit
- $-42,024
- Equity at exit
- $16,073
Cash invested: $52,052 (down + closing). Projections, not guarantees.
Landlord ↔ Tenant lean methodology
- Overall (STATE)
- 87 Strongly Landlord-Friendly
- State Texas
- 87 Strongly Landlord-Friendly · R+5
- County
- — inherits STATE
- City
- — inherits STATE
ZIP-level market 78516
- Home prices YoY
- -6.5%
- Active inventory
- 349
- Price-to-rent
- 10.5×
Monthly cashflow live
- Estimated rent
- $1,480 medium interval (Pro) →
- Mortgage (P&I)
- −$975
- Tax est. 1.5%
- −$232 /mo · $2,788/yr
- Insurance
- −$77
- HOA
- −$0
- Vacancy / Maint / Mgmt
- −$311
- Net cashflow
- $-116
Break-even live
Sensitivity live
| Price | -10% $13 | -5% $-51 | +0% $-116 | +5% $-180 | +10% $-244 |
|---|---|---|---|---|---|
| Rent | -10% $-233 | -5% $-174 | +0% $-116 | +5% $-57 | +10% $1 |
| Rate | -1.0pp $-22 | -0.5pp $-68 | base $-116 | +0.5pp $-164 | +1.0pp $-213 |
UW: 25.0% down · 7.5% · 30yr · 1.5% tax · 5.0% vac · 8.0% maint · 8.0% mgmt
Financing live
Cash to close
- Down payment
- $46,475
- Closing costs
- $5,577
- Reserves months
- —
- Total cash needed
- —
Loan-product check · same deal, 3 products live
Conventional
25% down · 7.5% · 30yr
- Down + closing
- —
- Monthly P&I
- —
- Monthly cashflow
- —
- DSCR
- —
- Eligible?
- —
Personal DTI + credit; lowest rate.
DSCR
20% down · 8.5% · 30yr
- Down + closing
- —
- Monthly P&I
- —
- Monthly cashflow
- —
- DSCR
- —
- Eligible?
- —
No personal income docs; deal must DSCR.
Hard money
10% down · 12.0% · 12mo
- Down + closing
- —
- Monthly P&I
- —
- Monthly cashflow
- —
- DSCR
- —
- Eligible?
- —
Short-term bridge; refi at stabilization.
Rent comps 2 comps
| Address | Beds | Baths | Sqft | Rent | $/sqft | DOM | Units | Dist |
|---|---|---|---|---|---|---|---|---|
| 504 San Antonio Cir Alamo, TX | 3.0 | 2.0 | 1216 | $1,600 | $1.32 | 16d | 1 | 0.66mi |
| 1003 Alta Vista Dr Alamo, TX | 4.0 | 2.0 | 1144 | $1,200 | $1.05 | 25d | 1 | 1.23mi |
Listing history 19 events
-
2026-06-21days on market $185,900 Active 510 DOM
-
2026-06-18days on market $185,900 Active 507 DOM
-
2026-06-17days on market $185,900 Active 506 DOM
-
2026-06-16days on market $185,900 Active 505 DOM
-
2026-06-15days on market $185,900 Active 504 DOM
-
2026-06-14days on market $185,900 Active 502 DOM
-
2026-06-13days on market $185,900 Active 501 DOM
-
2026-06-10days on market $185,900 Active 499 DOM
-
2026-06-09days on market $185,900 Active 498 DOM
-
2026-06-08days on market $185,900 Active 497 DOM
-
2026-06-07days on market $185,900 Active 496 DOM
-
2026-06-05days on market $185,900 Active 493 DOM
-
2026-06-03days on market $185,900 Active 492 DOM
-
2026-06-02days on market $185,900 Active 491 DOM
-
2026-06-01days on market $185,900 Active 490 DOM
-
2026-05-31days on market $185,900 Active 489 DOM
-
2026-05-31days on market $185,900 Active 488 DOM
-
2025-01-27$185,900 Active 795-char remark
Show marketing remark (795 chars)
Welcome to the FUTURE! This New Construction modular home in Alamo, Texas, this charming modular home is priced under $190K and sits on a spacious corner lot, offering ample yard space and privacy. The home gives you a modern, open-concept layout with 3 bedrooms and 3 bathrooms, perfect for a growing family or first-time buyers! The kitchen features sleek countertops and a built in island bar, while large windows throughout the home fill the space with natural light. Outside, the corner lot provides plenty of room for outdoor activities or future landscaping projects. Located in a peaceful neighborhood with easy access to local schools and shopping, this property is an excellent opportunity for affordable homeownership. Don’t miss out on this well-maintained, move-in ready home!
-
2024-10-17$185,900 Active
ⓘ Source: listings_history table (triggers on properties + properties_extension) + one-shot
backfill from property_details.listing_events for pre-trigger history.
Nearby sold comps map
Loading sold comps map…
Walkable amenities ~0.75 mi
Loading nearby amenities…
Taxation est. · year 1
- Rental income
- $17,757
- − Mortgage interest
- −$10,413
- − Property taxes
- −$2,788
- − Insurance
- −$930
- − Repairs & maintenance
- −$1,421
- − Management
- −$1,421
- − Depreciation
- −$5,408
- Taxable loss
- −$4,623
- Est. tax savings @ 24.0%
- +$1,110
- After-tax cash flow
- $-279/yr
For passive investors: Depreciation is non-cash, so a rental often shows a tax loss while cash-flowing — sheltering income. Rental losses are passive: they offset passive income freely, and up to $25,000/yr can offset ordinary (W-2) income if you actively participate and your MAGI is under $100k (phasing out to $0 by $150k); unused losses carry forward. On sale, claimed depreciation is recaptured at up to 25%, and gains may owe capital-gains tax (a 1031 exchange can defer both). Figures are a year-1 estimate at your 24.0% rate — not tax advice; consult a CPA.
Schools (NCES district)
- District
- Donna ISD
- NCES district ID
- 4817390
- Math proficiency
- 11% ▼ -30.00%
- Reading proficiency
- 18% ▼ -13.00%
- Median HH income
- $27,330
- Composite
- 11.16/100
- National rank
- #9728
- State rank
- #821 of 826 in TX
Livability — South Alamo
- Score
- 56/100
- State rank
- #1320
- US rank
- #22734
Category grades
Schools grade is shown separately in the Schools card above.
Census & demographics
- Census place
- South Alamo, TX
- County
- Hidalgo County · 623,128 people
- Metro
- McAllen-Edinburg-Mission, TX
- Population (ZIP)
- 34,370
- Household income
- $53,229
- Rent vs Own
- Severe rent burden
- 476.0
Population outlook (Hidalgo County) Hauer SSP2
- Today (2025)
- 955,232 people
- By 2030
- 1,009,774 · +5.7%
- By 2040
- 1,120,332 · +17.3%
- By 2050
- 1,225,036 · +28.2%
- By 2075
- 1,439,189 · +50.7%
- By 2100
- 1,533,429 · +60.5%
Race, ethnicity, and origin ACS 2023
- Neighborhood character
- Predominantly Hispanic (89%)
- Race & ethnicity
- Hispanic / Latino 89% Two or more races 40% White 10% Black 1%
- Hispanic origin (detail)
- Mexican 86%
- Foreign-born
- 29% · Canada
- Languages at home
- 24% English-only · Spanish 76%
Political lean MEDSL · Hidalgo
- 2024 margin
- Toss-up / Even · D 48.1% · R 51.0%
- 2008→2024 swing
- -41.6pp toward R · 2008: 38.7pp · 2024: -2.9pp
- All cycles
- 2024: R+2.9 2020: D+17.1 2016: D+40.5 2012: D+41.8 2008: D+38.7
Not yet ingested
- Civics
- —
Market trends
- HPI YoY
- ▼ -15.56%
- Current HPI
- 225.4438
- Rent YoY
- —
- Metro
- McAllen-Edinburg-Mission, TX
- State GDP YoY
- ▲ 3.95%
- F500 in state
- 110
Industry mix (Fortune 500 HQ in TX)
| Industry | F500 HQs | Revenue |
|---|---|---|
| Energy | 16 | $1,198B |
|
||
| Technology | 5 | $198B |
|
||
| Engineering / Construction | 4 | $72B |
|
||
| Energy Services | 3 | $60B |
|
||
| Utilities | 3 | $41B |
|
||
| Healthcare | 2 | $330B |
|
||
Price history
+0.0% since first listed2 events — show timeline
- 2025-01-27 Listed $185,900 MCALLENMLS
- 2024-10-17 Listed $185,900 MCALLENMLS
Cash-flow waterfall
monthlySold comps — $/sqft
last 12 mo · ≤1 miLoading sold comps…