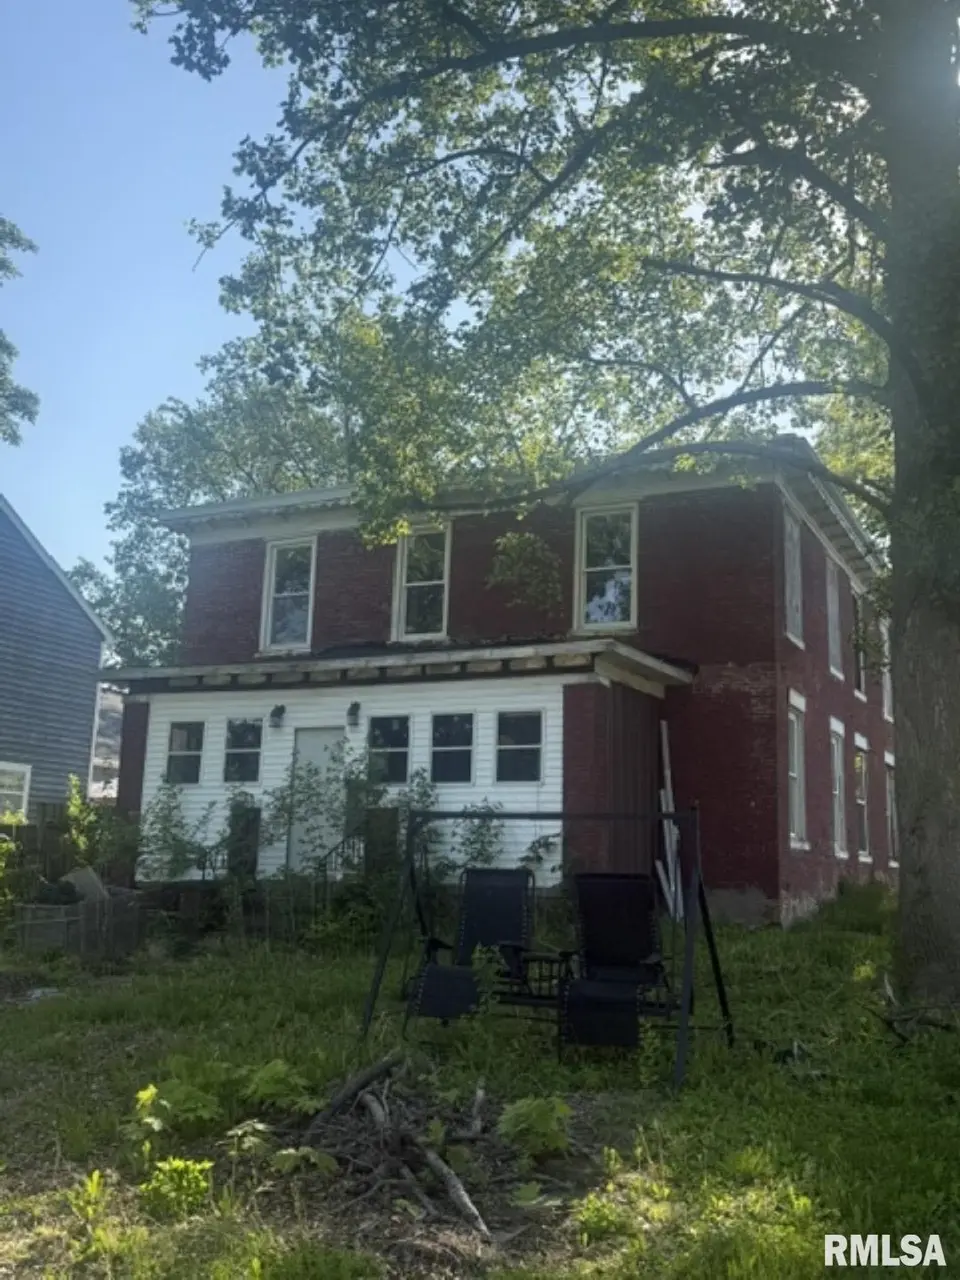
218 S Ida St · Lacon, IL
Flood risk 1/10 · Minimal
- FEMA flood zone
- X (unshaded)
- Chance of flooding over 30 yrs
- 0.0%
- Est. flood insurance / yr
- $507 – $1,088
Fire risk 1/10 · Minimal
- Est. fire insurance / yr
- $804 – $1,492
Heat risk 3/10 · Minor
- Hot days now (above 105°F)
- 7 days/yr
- Hot days in 30 yrs
- 17 days/yr
Wind risk 2/10 · Minimal
- Chance of severe wind over 30 yrs
- 1.0%
Air-quality risk 3/10 · Minor
- Unhealthy air days now
- 2 days/yr
- Unhealthy air days in 30 yrs
- 3 days/yr
Risk factors via First Street. Map © Google.
Why this score? — see what drove the B- grade
The composite is a weighted blend of 9 inputs, each scored 0–100. Each bar is that input's sub-score; the figure is the points it added to the 100-point composite (weight × sub-score).
- Cash flow +30.0/30.0
- 1% rule +10.0/10.0
- DSCR +10.0/10.0
- ARV discount +7.5/15.0
- Livability +3.7/5.0
- Schools +3.1/10.0
- Rent growth +2.5/5.0
- Condition / age +2.5/5.0
- Appreciation +0.0/10.0
$42,500
🖨 Deal sheet 📄 Offer letter ✓ Due diligence
Listing remarks
4 bedroom, 2 bath, 2-story home offering a fantastic opportunity for investors or buyers ready to add their personal touch! This property is a blank canvas with strong potential to begin renovations immediately. Functional layout offers flexibility for modern updates and creative design possibilities. Whether you’re looking for a rental, flip, or future owner-occupied property, this home presents a valuable opportunity in an established neighborhood. Sold AS-IS, the seller will not be completing any repairs. Appliances not warranted - sold as-is. Only cash or conventional financing.
Key facts
- 0.26 acre lot
- Parking
- Built 1900
Property features AI
Finance
- Other: Residential zoning; Lot dimensions approximately 66 x 173 (0.26 acre); Partial, unfinished basement
- HOA & community: No association fee
Exterior
- Parking: No garage spaces; On-street parking, gravel parking, and other parking options
- Utilities: Public water and public sewer
- Home design: Single-family residence; Two levels; Built in 1900
- Construction: Composition roof
- Exterior features: Corner, level lot; Shed(s); Paved road access
Interior
- Kitchen: Kitchen includes refrigerator and dishwasher
- Bedrooms: 4 bedrooms; Bedroom 1 on main level (15' x 10') with egress window and hardwood flooring; Bedroom 2 on upper level (15' x 13') with egress window and hardwood flooring; Bedroom 3 on upper level (14' x 12') with egress window and hardwood flooring; Bedroom 4 on upper level (15' x 9') with egress window and hardwood flooring
- Flooring: Hardwood flooring in multiple rooms; Tile flooring in kitchen and dining room
- Bathrooms: 2 full bathrooms
- Heating & cooling: Forced air heating; Gas water heater; No cooling system
- Interior features: Dishwasher, Refrigerator; Non-functional fireplace (one)
- Laundry & utility: Main level laundry (7' x 7')
Neighborhood map
What this means for you Summary
Snapshot
- This is a 4-bed/2.0-bath single-family listed at $42k.
Deal economics
- At list price, monthly cash flow is $598 ($7k/yr) — positive.
- The deal already cash-flows at list — no discount required.
- Meets the 1% rule at list price ($1k rent vs $42k).
- Recommended offer: $41k (3.0% below list) — sets the bar for market timing.
Location & tenants
- Location reads 73/100 on livability (#275 in IL) — a middle-class / working-renter tenant base. Strengths: crime A+, cost of living A+, housing A+; Watch: employment D+, amenities F, commute F.
- Midland CUSD 7 (rural): math 24% / reading 46% proficiency, ranked #189 of 620 in IL (top 30%) — families likely to look elsewhere, expect single-tenant / working-renter base with shorter leases.
- Zoned schools: Midland Elementary School (math 17% / reading 27%, grade F, #940 of 2,056 statewide, top 49%, 274 students, 0% FRL); Midland Middle School (math 27% / reading 57%, grade D-, #116 of 665 statewide, top 19%, 196 students, 0% FRL); Midland High School (math 24% / reading 34%, grade F, #187 of 693 statewide, top 30%, 195 students, 0% FRL) — zoned schools average 0% FRL vs 36% district-wide (36 pts lower); this property's tenant base skews higher-income than the district average.
- Market conditions: 27 active listings in the ZIP; 9 units permitted in Marshall County in 2024 (0 in 5+ unit buildings).
Forward outlook
- Local home prices are declining (-3.0%/yr); year-one equity from $294 of loan paydown is wiped out by about $1k of value loss. Plan a longer hold.
- Marshall County population projected at -32% by 2050 — secular population decline; favor cash flow + early exit over multi-decade hold.
- At projected returns (-3.0% appreciation + 3.0% rent growth), your $12k cash investment doubles in ~2 years — after that, you're playing with house money.
Negotiation context
- It's been on market 37 days — a 3% lower offer ($41k) is reasonable based on typical stale-listing flexibility.
- 3 sale attempts since 9y ago; this cycle's ask has dropped $7k (15%) from the opening price — seller is motivated, your offer sets the floor, not the list.
- Current owner paid $17k; list at $42k implies a 150% gain — meaningful room to come down on a strong offer.
Risks & watch-outs
- Watch-outs: built in 1900 — expect roof / HVAC / electrical / plumbing capex.
Questions for the listing agent
- It's been on market 37 days. Have you received any prior offers? Is the seller open to a 3% concession, seller financing, or rate buy-down credit?
- Built in 1900 — when were the roof, HVAC, electrical panel, plumbing, and water heater last replaced?
- Is there a deadline driving the sale (1031 exchange, divorce, estate, relocation)? That informs how much negotiation room exists.
- What's the average days-on-market for RENTAL listings here right now (not sales)? A rising rental-DOM trend means longer vacancies and softer asking-rent achievability than the comps imply.
- What's the recent tenant-quality profile in this submarket — average credit score on applications, eviction rate, late-payment / NSF rate, and stable-employment percentage? A property-management company in the area should have these aggregated.
- How much new for-sale + rental construction is in the pipeline within 1–3 miles? Heavy new supply typically softens prices + rents 12–24 months out; constrained supply supports both.
Investment metrics
- 1% rule
- 2.57% ✓
- Cap rate
- 23.17%
- Cash-on-cash
- 60.29%
- DSCR
- 3.68
- GRM
- 3.2
CMA / ARV
- ARV (median comp)
- $166,073
- List price
- $42,500
- Delta
- -74.41%
- Verdict
- UNDERPRICED
- Comps
- 20 within 1.0 mi
Show comp detail 4 sales within ~0.75 mi
| Address | Dist | Beds/Ba | Sqft | Sold | Price | $/sf | Match |
|---|---|---|---|---|---|---|---|
| 817 8th St | 0.32mi | 3/2.0 (-1) | 1,260 (+9%) | 3mo | $175,000 | $139 | 63 |
| 906 Park Ln | 0.19mi | 3/2.5 (-1) | 1,232 (+7%) | 19mo | $165,000 | $134 | 57 |
| 212 S Main St | 0.53mi | 3/1.0 (-1) | 1,021 (-12%) | 11mo | $39,500 | $39 | 37 |
| 516 8th St | 0.40mi | 3/2.0 (-1) | 1,304 (+13%) | 21mo | $135,900 | $104 | 37 |
Match score weights: distance 35% · size 25% · config 20% · recency 20%. Top-matched comps best support the ARV.
Projected returns pro-forma
-3.0% appreciation · 3.0% rent growth · sell at horizon
- IRR
- 59.0%
- Equity multiple
- 3.62×
- Total profit
- $31,190
- Equity at exit
- $6,337
- IRR
- 63.8%
- Equity multiple
- 7.40×
- Total profit
- $76,187
- Equity at exit
- $3,675
Cash invested: $11,900 (down + closing). Projections, not guarantees.
Landlord ↔ Tenant lean methodology
- Overall (STATE)
- 43 Moderately Tenant-Leaning
- State Illinois
- 43 Moderately Tenant-Leaning · D+7
- County
- — inherits STATE
- City
- — inherits STATE
ZIP-level market 61540
- Home prices YoY
- -27.4%
- Active inventory
- 27
- Price-to-rent
- 3.2×
Monthly cashflow live
- Estimated rent
- $1,092 medium interval (Pro) →
- Mortgage (P&I)
- −$223
- Tax from tax record
- −$24 /mo · $290/yr
- Insurance
- −$18
- HOA
- −$0
- Vacancy / Maint / Mgmt
- −$229
- Net cashflow
- $598
Break-even live
UW: 25.0% down · 7.5% · 30yr · 1.5% tax · 5.0% vac · 8.0% maint · 8.0% mgmt
Financing live
Cash to close
- Down payment
- $10,625
- Closing costs
- $1,275
- Reserves months
- —
- Total cash needed
- —
Loan-product check · same deal, 3 products live
Conventional
25% down · 7.5% · 30yr
- Down + closing
- —
- Monthly P&I
- —
- Monthly cashflow
- —
- DSCR
- —
- Eligible?
- —
Personal DTI + credit; lowest rate.
DSCR
20% down · 8.5% · 30yr
- Down + closing
- —
- Monthly P&I
- —
- Monthly cashflow
- —
- DSCR
- —
- Eligible?
- —
No personal income docs; deal must DSCR.
Hard money
10% down · 12.0% · 12mo
- Down + closing
- —
- Monthly P&I
- —
- Monthly cashflow
- —
- DSCR
- —
- Eligible?
- —
Short-term bridge; refi at stabilization.
Listing history 25 events
-
2026-06-18days on market $42,500 Under Contract 37 DOM
-
2026-06-17days on market $42,500 Under Contract 36 DOM
-
2026-06-16days on market $42,500 Under Contract 35 DOM
-
2026-06-15days on market $42,500 Under Contract 34 DOM
-
2026-06-13days on market $42,500 Under Contract 32 DOM
-
2026-06-12statusdays on market $42,500 Under Contract 31 DOM
-
2026-06-09days on market $42,500 Active 28 DOM
-
2026-06-08days on market $42,500 Active 27 DOM
-
2026-06-07days on market $42,500 Active 26 DOM
-
2026-06-07days on market $42,500 Active 25 DOM
-
2026-06-04days on market $42,500 Active 22 DOM
-
2026-06-02days on market $42,500 Active 21 DOM
-
2026-06-01days on market $42,500 Active 20 DOM
-
2026-05-31days on market $42,500 Active 19 DOM
-
2026-05-31days on market $42,500 Active 18 DOM
-
2026-05-12$49,900 Active 595-char remark
-
2026-05-05historical
-
2026-04-17price
-
2026-04-10price
-
2026-04-02Active
-
2021-08-06historical
-
2020-05-15soldstatus $17,000
-
2017-07-21soldstatus $18,000
-
2017-02-21$19,900
-
1998-06-22soldstatus $44,000
ⓘ Source: listings_history table (triggers on properties + properties_extension) + one-shot
backfill from property_details.listing_events for pre-trigger history.
Tax reassessment forecast IL · Partial reset (capped growth)
- Current annual tax
- $290 · $24/mo
- Projected year-2 tax
- $628 · $52/mo
- Expected delta
- +$337/yr (+$28/mo · 116.1%)
ⓘ Screening estimate from a state-policy table — verify with the county assessor before closing.
Climate risk First Street
- Flood 1/10 Low FEMA zone X (unshaded) · 0% chance over 30 yrs
- Wildfire 1/10 Low
- Heat 3/10 Moderate 7 d/yr ≥105°F today · 17 d/yr by 30 yrs out
- Wind 2/10 Low 100% chance of damaging wind over 30 yrs
- Air quality 3/10 Moderate 2 unhealthy d/yr today · 3 by 30 yrs out
Nearby sold comps map
Loading sold comps map…
Walkable amenities ~0.75 mi
Loading nearby amenities…
Taxation est. · year 1
- Rental income
- $13,104
- − Mortgage interest
- −$2,381
- − Property taxes
- −$290
- − Insurance
- −$212
- − Repairs & maintenance
- −$1,048
- − Management
- −$1,048
- − Depreciation
- −$1,236
- Taxable income
- $6,887
- Est. tax owed @ 24.0%
- −$1,653
- After-tax cash flow
- $5,522/yr
For passive investors: Depreciation is non-cash, so a rental often shows a tax loss while cash-flowing — sheltering income. Rental losses are passive: they offset passive income freely, and up to $25,000/yr can offset ordinary (W-2) income if you actively participate and your MAGI is under $100k (phasing out to $0 by $150k); unused losses carry forward. On sale, claimed depreciation is recaptured at up to 25%, and gains may owe capital-gains tax (a 1031 exchange can defer both). Figures are a year-1 estimate at your 24.0% rate — not tax advice; consult a CPA.
Schools (NCES district)
- District
- Midland CUSD 7
- NCES district ID
- 1700126
- Math proficiency
- 24% ▼ -4.00%
- Reading proficiency
- 46% ▼ -7.00%
- Median HH income
- $55,523
- Composite
- 30.79/100
- National rank
- #6148
- State rank
- #189 of 620 in IL
Livability — Lacon
- Score
- 73/100
- State rank
- #275
- US rank
- #5270
Category grades
Schools grade is shown separately in the Schools card above.
Census & demographics
- Census place
- Lacon, IL
- Population (ZIP)
- 2,700
Population outlook (Marshall County) Hauer SSP2
- Today (2025)
- 10,717 people
- By 2030
- 9,992 · -6.8%
- By 2040
- 8,554 · -20.2%
- By 2050
- 7,236 · -32.5%
- By 2075
- 4,958 · -53.7%
- By 2100
- 3,326 · -69.0%
Race, ethnicity, and origin ACS 2023
- Neighborhood character
- Predominantly White (97%)
- Race & ethnicity
- White 97% Hispanic / Latino 1%
- Common ancestry
- Romanian 3% Italian 2% Iranian 2%
- Foreign-born
- 0%
- Languages at home
- 98% English-only · Spanish 2%
Political lean MEDSL · Marshall
- 2024 margin
- Solid R (+36.0) · D 31.2% · R 67.2% · Other 1.6%
- 2008→2024 swing
- -35.0pp toward R · 2008: -1.0pp · 2024: -36.0pp
- All cycles
- 2024: R+36.0 2020: R+34.5 2016: R+33.8 2012: R+14.3 2008: R+1.0
Not yet ingested
- Civics
- —
Market trends
- HPI YoY
- ▼ -62.03%
- Current HPI
- 164.3293
- Rent YoY
- —
- Metro
- —
- State GDP YoY
- ▲ 1.59%
- F500 in state
- 60
Industry mix (Fortune 500 HQ in IL)
| Industry | F500 HQs | Revenue |
|---|---|---|
| Insurance | 4 | $201B |
|
||
| Consumer Goods | 4 | $87B |
|
||
| Industrial Machinery | 3 | $64B |
|
||
| Healthcare | 2 | $55B |
|
||
| Retail / Pharmacy | 1 | $148B |
|
||
| Agriculture / Food | 1 | $86B |
|
||
Price history
-3.4% since first listed12 events — show timeline
- 2026-06-12 Contingent — RMLSA as Distributed by MLS Grid
- 2026-05-28 Price Changed $42,500 RMLSA as Distributed by MLS Grid
- 2026-05-12 Listed $49,900 RMLSA as Distributed by MLS Grid
- 2026-05-05 Listing Removed — MRED as Distributed by MLS Grid
- 2026-04-17 Price Changed — MRED as Distributed by MLS Grid
- 2026-04-10 Price Changed — MRED as Distributed by MLS Grid
- 2026-04-02 Listed — MRED as Distributed by MLS Grid
- 2021-08-06 Listing Removed — RMLSA as Distributed by MLS Grid
- 2020-05-15 Sold (Public Records) $17,000 Public Records
- 2017-07-21 Sold (MLS) $18,000 RMLSA as Distributed by MLS Grid
- 2017-02-21 Listed $19,900 RMLSA as Distributed by MLS Grid
- 1998-06-22 Sold (Public Records) $44,000 Public Records
Property tax history
-15.7%/yrLatest (2024): $290 · -2.8% YoY. Source: county tax records.
Cash-flow waterfall
monthlySold comps — $/sqft
last 12 mo · ≤1 miLoading sold comps…