 🌊 Lakefront
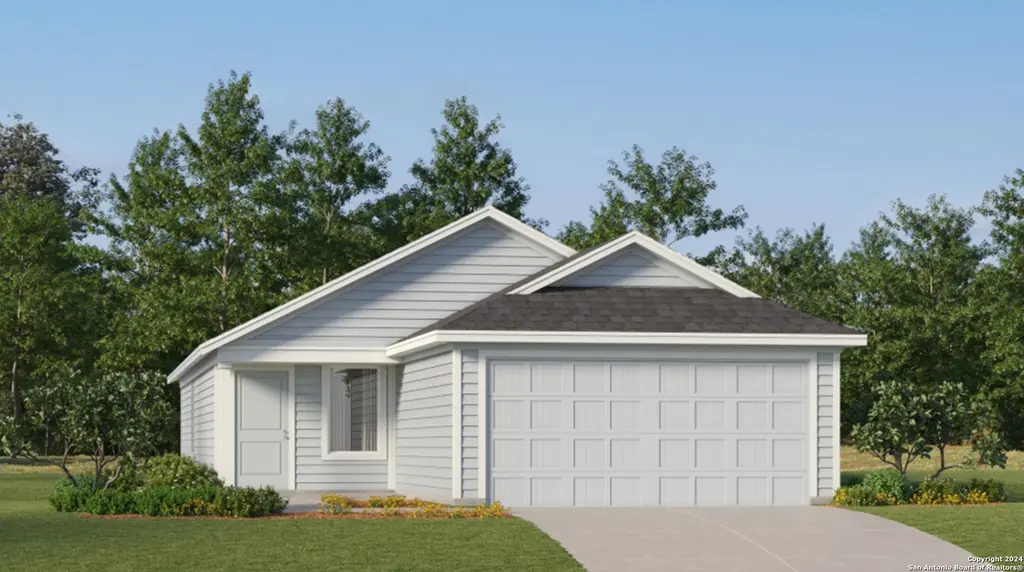
3919 El Dorado · New Braunfels, TX
Flood risk No data
- FEMA flood zone
- —
- Chance of flooding over 30 yrs
- —
- Est. flood insurance / yr
- —
Fire risk No data
- Est. fire insurance / yr
- —
Heat risk No data
- Hot days now (above threshold)
- —
- Hot days in 30 yrs
- —
Wind risk No data
- Chance of severe wind over 30 yrs
- —
Air-quality risk No data
- Unhealthy air days now
- —
- Unhealthy air days in 30 yrs
- —
Risk factors via First Street. Map © Google.
Why this score? — see what drove the D+ grade
The composite is a weighted blend of 9 inputs, each scored 0–100. Each bar is that input's sub-score; the figure is the points it added to the 100-point composite (weight × sub-score).
- ARV discount +15.0/15.0
- Cash flow +11.1/30.0
- Schools +5.2/10.0
- Livability +4.2/5.0
- 1% rule +3.9/10.0
- DSCR +3.2/10.0
- Condition / age +2.5/5.0
- Rent growth +2.0/5.0
- Appreciation +0.0/10.0
$200,999
🖨 Deal sheet (PDF) 📄 Offer letter ✓ Due diligence
Listing remarks MLS
The Kitson- An inviting open-concept floorplan serves as the heart of this single-level home, providing for seamless transitions between the kitchen, dining area and family room. A restful owner's suite is located at the back of home, featuring a comfortable bedroom, en-suite bathroom and walk-in closet. Two secondary bedrooms can be found off the entry. Estimated COE March 2026.
Key facts
- Walk-in closet
- Secondary bedrooms
- En-suite bathroom
Tags
Neighborhood map
What this means for you Summary
Snapshot
- This is a 3-bed/2.0-bath single-family listed at $201k.
Deal economics
- At list price, monthly cash flow is $-80 ($-962/yr) — negative.
- To cash-flow at today's rent, offer at most $189k (5.8% below list).
- To meet the 1% rule (rent ≥ 1% of price), the offer needs to be $178k (11.3% below list).
- Recommended offer: $178k (11.3% below list) — sets the bar for 1% rule.
- Cap rate 5.8% vs local median 3.3% in New Braunfels — top-decile yield for the area; either an underpriced asset or a hidden risk that comps aren't pricing in. Stress-test before assuming the spread holds.
Location & tenants
- Location reads 83/100 on livability (#9 in TX, #925 nationally) — a professional / high-income tenant draw. Strengths: amenities A+, housing A+, health & safety A+; Watch: commute F.
- Comal ISD (rural): math 57% / reading 59% proficiency, ranked #58 of 826 in TX (top 7%) — acceptable for families but not a draw, mixed tenant base, ~2y average lease.
- Zoned schools: Oak Creek El (math 53% / reading 57%, grade C, #602 of 4,322 statewide, top 14%, 765 students, 37% FRL); Church Hill Middle (math 64% / reading 60%, grade B+, #134 of 1,662 statewide, top 8%, 748 students, 29% FRL); Canyon H S (math 59% / reading 65%, grade B-, #237 of 1,632 statewide, top 16%, 2,348 students, 35% FRL) — zoned schools at 34% FRL track the district average.
- Market conditions: Rents soft (-2.0%/yr); 1931 active listings in the ZIP; 19 comparable units currently listed for rent nearby; rentals at typical pace (median 26d on market — plan ~3-4 weeks tenant-placement turnaround); solid renter incomes; 3,420 units permitted in Comal County in 2024 (1,164 in 5+ unit buildings).
Forward outlook
- Local home prices are declining (-3.0%/yr); year-one equity from $1k of loan paydown is wiped out by about $6k of value loss. Plan a longer hold.
- Comal County population projected at +70% by 2050 — long-run rental-demand tailwind backs the buy-and-hold thesis.
Negotiation context
- Only 10 days on market — expect competitive offers; lowballing is unlikely to land.
- 3 sale attempts; this cycle's ask is 12868% above the opening price — seller raised mid-cycle; expect resistance to lowballs.
Questions for the listing agent
- What do current leases actually rent for vs. the listed asking? Can we see a recent rent roll and the last 12 months of T-12 income?
- What does the HOA fee cover, when was the last increase, and are there any pending special assessments or reserve-fund shortfalls?
- Is there a deadline driving the sale (1031 exchange, divorce, estate, relocation)? That informs how much negotiation room exists.
- Schools are B-rated — typically a magnet for longer-tenancy family renters. What's the average tenant stay here, and is there a school-zone premium baked into asking?
- The area grade is low — what's the realistic commute time and amenity access for the typical tenant pool here? Any planned neighborhood developments (good or bad) we should know about?
- This sits on a lake — are riparian / water-frontage rights deeded with the parcel? Any dock permits, shoreline easements, or HOA water-use restrictions?
- What's the documented flood / surge / shoreline-erosion history here (FEMA AND non-FEMA — e.g., storm surge, creek backup, septic-field saturation)?
- Any water-quality or seasonal algae-bloom issues that affect tenant satisfaction or short-term-rental demand?
- What's the average days-on-market for RENTAL listings here right now (not sales)? A rising rental-DOM trend means longer vacancies and softer asking-rent achievability than the comps imply.
- What's the recent tenant-quality profile in this submarket — average credit score on applications, eviction rate, late-payment / NSF rate, and stable-employment percentage? A property-management company in the area should have these aggregated.
- How much new for-sale + rental construction is in the pipeline within 1–3 miles? Heavy new supply typically softens prices + rents 12–24 months out; constrained supply supports both.
Investment metrics
- 1% rule
- 0.89% ✗
- Cap rate
- 5.81%
- Cash-on-cash
- -1.71%
- DSCR
- 0.92
- GRM
- 9.4
CMA / ARV
- ARV (on-the-fly)
- $314,188
- Comps found
- 12
Show comp detail 12 sales within ~0.75 mi
| Address | Dist | Beds/Ba | Sqft | Sold | Price | $/sf | Match |
|---|---|---|---|---|---|---|---|
| 3919 El Dorado | 0.00mi | 3/2.0 | 1,402 (0%) | 3mo | $200,999 | $143 | 98 |
| 305 Tahoe Ave | 0.02mi | 3/2.0 | 1,402 (0%) | 3mo | $203,999 | $146 | 96 |
| 290 Tahoe Ave | 0.06mi | 3/2.0 | 1,402 (0%) | 4mo | $208,999 | $149 | 93 |
| 281 Inyo St | 0.15mi | 3/2.0 | 1,510 (+8%) | 1mo | $235,999 | $156 | 80 |
| 306 Tahoe Ave | 0.05mi | 3/2.0 | 1,266 (-10%) | 5mo | $219,999 | $174 | 77 |
| 3915 El Dorado | 0.00mi | 4/2.0 (+1) | 1,575 (+12%) | 3mo | $265,999 | $169 | 72 |
| 115 Trifle Trl | 0.55mi | 3/2.5 | 1,392 (-1%) | 1mo | $299,990 | $216 | 70 |
| 294 Tahoe Ave | 0.06mi | 4/2.0 (+1) | 1,575 (+12%) | 4mo | $261,999 | $166 | 69 |
| 301 Tahoe Ave | 0.03mi | 4/2.0 (+1) | 1,600 (+14%) | 2mo | $211,459 | $132 | 68 |
| 298 Tahoe Ave | 0.06mi | 4/2.0 (+1) | 1,600 (+14%) | 3mo | $221,999 | $139 | 66 |
| 131 Trifle Trl | 0.57mi | 3/2.0 | 1,194 (-15%) | 6mo | $293,990 | $246 | 44 |
| 119 Trifle Trl | 0.56mi | 3/2.0 | 1,194 (-15%) | 8mo | $299,990 | $251 | 43 |
Match score weights: distance 35% · size 25% · config 20% · recency 20%. Top-matched comps best support the ARV.
Projected returns pro-forma
-3.0% appreciation · 0.0% rent growth · sell at horizon
- IRR
- -22.8%
- Equity multiple
- 0.24×
- Total profit
- $-42,814
- Equity at exit
- $29,970
- IRR
- -28.6%
- Equity multiple
- -0.13×
- Total profit
- $-63,695
- Equity at exit
- $17,379
Cash invested: $56,280 (down + closing). Projections, not guarantees.
Landlord ↔ Tenant lean methodology
- Overall (STATE)
- 87 Strongly Landlord-Friendly
- State Texas
- 87 Strongly Landlord-Friendly · R+5
- County
- — inherits STATE
- City
- — inherits STATE
ZIP-level market 78130
- Rents YoY
- -2.0%
- Active inventory
- 1931
- Price-to-rent
- 9.4×
Monthly cashflow live
- Estimated rent
- $1,783 high interval (Pro) →
- Mortgage (P&I)
- −$1,054
- Tax est. 1.5%
- −$251 /mo · $3,015/yr
- Insurance
- −$84
- HOA
- −$100
- Vacancy / Maint / Mgmt
- −$375
- Net cashflow
- $-80
Break-even live
Sensitivity live
| Price | -10% $59 | -5% $-11 | +0% $-80 | +5% $-150 | +10% $-219 |
|---|---|---|---|---|---|
| Rent | -10% $-221 | -5% $-151 | +0% $-80 | +5% $-10 | +10% $61 |
| Rate | -1.0pp $21 | -0.5pp $-29 | base $-80 | +0.5pp $-132 | +1.0pp $-185 |
UW: 25.0% down · 7.5% · 30yr · 1.5% tax · 5.0% vac · 8.0% maint · 8.0% mgmt
Financing live
Cash to close
- Down payment
- $50,250
- Closing costs
- $6,030
- Reserves months
- —
- Total cash needed
- —
Loan-product check · same deal, 3 products live
Conventional
25% down · 7.5% · 30yr
- Down + closing
- —
- Monthly P&I
- —
- Monthly cashflow
- —
- DSCR
- —
- Eligible?
- —
Personal DTI + credit; lowest rate.
DSCR
20% down · 8.5% · 30yr
- Down + closing
- —
- Monthly P&I
- —
- Monthly cashflow
- —
- DSCR
- —
- Eligible?
- —
No personal income docs; deal must DSCR.
Hard money
10% down · 12.0% · 12mo
- Down + closing
- —
- Monthly P&I
- —
- Monthly cashflow
- —
- DSCR
- —
- Eligible?
- —
Short-term bridge; refi at stabilization.
Rent comps 19 comps
| Address | Beds | Baths | Sqft | Rent | $/sqft | DOM | Units | Dist |
|---|---|---|---|---|---|---|---|---|
| 301 Tahoe Ave New Braunfels, TX | 4.0 | 2.0 | 1276 | $1,650 | $1.29 | 45d | 1 | 0.06mi |
| 298 Tahoe Ave New Braunfels, TX | 4.0 | 2.0 | 1600 | $1,595 | $1.00 | 45d | 1 | 0.08mi |
| 116 Radnor Rd New Braunfels, TX | 3.0 | 2.0 | 1825 | $2,450 | $1.34 | 45d | 1 | 0.53mi |
| 131 Trifle Trl New Braunfels, TX | 3.0 | 2.0 | 1194 | $1,863 | $1.56 | 16d | 1 | 0.61mi |
| 5430 Addante St New Braunfels, TX | 1.0–3.0 | 1.0–2.5 | 981 | $2,299 | $2.34 | 0d | 183 | 0.98mi |
| 4817 Interstate 35 Unit 2-2M New Braunfels, TX | 2.0 | 2.0 | 1011 | $1,559 | $1.54 | 25d | 1 | 1.05mi |
| 138 Conrads Ln Unit 2-H New Braunfels, TX | 2.0 | 2.0 | 1007 | $1,559 | $1.55 | 25d | 1 | 1.08mi |
| 378 Tanager Dr New Braunfels, TX | 3.0 | 2.0 | 1719 | $1,825 | $1.06 | 45d | 1 | 1.09mi |
| 635 NW Crossing Dr New Braunfels, TX | 3.0 | 2.0 | 1475 | $1,650 | $1.12 | 6d | 1 | 1.17mi |
| 620 Northgap Dr New Braunfels, TX | 3.0 | 2.0 | 1260 | $1,500 | $1.19 | 45d | 1 | 1.19mi |
| 505 Starling Crk New Braunfels, TX | 4.0 | 2.0 | 1602 | $1,900 | $1.19 | 25d | 1 | 1.22mi |
| 3215 Northwest Blvd New Braunfels, TX | 3.0 | 2.5 | 1574 | $1,625 | $1.03 | 6d | 1 | 1.22mi |
| 3235 Blue Jay Dr New Braunfels, TX | 3.0 | 2.0 | 1282 | $1,725 | $1.35 | 4d | 1 | 1.24mi |
| 373 Starling Crk New Braunfels, TX | 3.0 | 2.5 | 1794 | $1,950 | $1.09 | 45d | 1 | 1.28mi |
| 128 Lonesome Quail New Braunfels, TX | 1.0–2.0 | 1.0–2.0 | 935 | $1,655 | $1.77 | 0d | 14 | 1.32mi |
| 3103 Swallow Pointe New Braunfels, TX | 3.0 | 2.5 | 1551 | $1,775 | $1.14 | 25d | 1 | 1.36mi |
| 108 Oak Creek Way New Braunfels, TX | 1.0–3.0 | 1.0–2.0 | 1051 | $2,000 | $1.90 | 0d | 45 | 1.41mi |
| 2937 Post Oak Cir New Braunfels, TX | 3.0 | 2.0 | 1641 | $1,875 | $1.14 | 0d | 1 | 1.47mi |
| 307 Limestone Crk New Braunfels, TX | 3.0 | 2.0 | 1736 | $2,200 | $1.27 | 45d | 1 | 1.49mi |
HOA detail
- Monthly dues
- $100 · $1,200/yr
Listing history 10 events
-
2026-05-06historical $1,550
-
2026-04-29$1,550
-
2026-03-26soldstatus Sold 382-char remark
Show marketing remark (382 chars)
The Kitson- An inviting open-concept floorplan serves as the heart of this single-level home, providing for seamless transitions between the kitchen, dining area and family room. A restful owner's suite is located at the back of home, featuring a comfortable bedroom, en-suite bathroom and walk-in closet. Two secondary bedrooms can be found off the entry. Estimated COE March 2026.
-
2026-02-13status Pending
-
2026-02-10price $200,999
-
2026-02-05price $210,999
-
2026-02-02$255,999 New
-
2026-01-31price $255,999 382-char remark
Show marketing remark (382 chars)
The Kitson- An inviting open-concept floorplan serves as the heart of this single-level home, providing for seamless transitions between the kitchen, dining area and family room. A restful owner's suite is located at the back of home, featuring a comfortable bedroom, en-suite bathroom and walk-in closet. Two secondary bedrooms can be found off the entry. Estimated COE March 2026.
-
2026-01-24price $260,999 382-char remark
Show marketing remark (382 chars)
The Kitson- An inviting open-concept floorplan serves as the heart of this single-level home, providing for seamless transitions between the kitchen, dining area and family room. A restful owner's suite is located at the back of home, featuring a comfortable bedroom, en-suite bathroom and walk-in closet. Two secondary bedrooms can be found off the entry. Estimated COE March 2026.
-
2025-12-10$265,999 New 382-char remark
Show marketing remark (382 chars)
The Kitson- An inviting open-concept floorplan serves as the heart of this single-level home, providing for seamless transitions between the kitchen, dining area and family room. A restful owner's suite is located at the back of home, featuring a comfortable bedroom, en-suite bathroom and walk-in closet. Two secondary bedrooms can be found off the entry. Estimated COE March 2026.
ⓘ Source: listings_history table (triggers on properties + properties_extension) + one-shot
backfill from property_details.listing_events for pre-trigger history.
Nearby sold comps map
Loading sold comps map…
Walkable amenities ~0.75 mi
Loading nearby amenities…
Taxation est. · year 1
- Rental income
- $21,401
- − Mortgage interest
- −$11,259
- − Property taxes
- −$3,015
- − Insurance
- −$1,005
- − Repairs & maintenance
- −$1,712
- − Management
- −$1,712
- − HOA
- −$1,200
- − Depreciation
- −$5,847
- Taxable loss
- −$4,349
- Est. tax savings @ 24.0%
- +$1,044
- After-tax cash flow
- $82/yr
For passive investors: Depreciation is non-cash, so a rental often shows a tax loss while cash-flowing — sheltering income. Rental losses are passive: they offset passive income freely, and up to $25,000/yr can offset ordinary (W-2) income if you actively participate and your MAGI is under $100k (phasing out to $0 by $150k); unused losses carry forward. On sale, claimed depreciation is recaptured at up to 25%, and gains may owe capital-gains tax (a 1031 exchange can defer both). Figures are a year-1 estimate at your 24.0% rate — not tax advice; consult a CPA.
Schools (NCES district)
- District
- Comal ISD
- NCES district ID
- 4814730
- Math proficiency
- 57% ▼ -9.00%
- Reading proficiency
- 59% ▼ -2.00%
- Median HH income
- $74,792
- Composite
- 51.79/100
- National rank
- #1671
- State rank
- #58 of 826 in TX
Livability — New Braunfels
- Score
- 83/100
- State rank
- #9
- US rank
- #925
Category grades
Schools grade is shown separately in the Schools card above.
Census & demographics
- County
- Comal County · 206,262 people
- City population
- 144,962
- Metro
- San Antonio-New Braunfels, TX
- Population (ZIP)
- 104,009
- Household income
- $83,064
- Rent vs Own
- Severe rent burden
- 2912.0
Population outlook (Comal County) Hauer SSP2
- Today (2025)
- 175,637 people
- By 2030
- 199,911 · +13.8%
- By 2040
- 249,436 · +42.0%
- By 2050
- 299,430 · +70.5%
- By 2075
- 423,857 · +141.3%
- By 2100
- 512,048 · +191.5%
Race, ethnicity, and origin ACS 2023
- Neighborhood character
- Majority White (58%)
- Race & ethnicity
- White 58% Hispanic / Latino 37% Two or more races 19% Black 2%
- Hispanic origin (detail)
- Mexican 32%
- Common ancestry
- Romanian 2% Lithuanian 2% Slovak 2%
- Foreign-born
- 7% · Canada
- Languages at home
- 78% English-only · Spanish 20% German/W. Germanic 1%
Political lean MEDSL · Comal
- 2024 margin
- Solid R (+45.5) · D 26.8% · R 72.2%
- 2008→2024 swing
- +1.9pp toward D · 2008: -47.4pp · 2024: -45.5pp
- All cycles
- 2024: R+45.5 2020: R+42.7 2016: R+50.1 2012: R+54.1 2008: R+47.4
Not yet ingested
- Civics
- —
Market trends
- HPI YoY
- ▼ -190.61%
- Current HPI
- 173.7128
- Rent YoY
- ▼ -1.97%
- Metro
- San Antonio-New Braunfels, TX
- State GDP YoY
- ▲ 3.95%
- F500 in state
- 110
Industry mix (Fortune 500 HQ in TX)
| Industry | F500 HQs | Revenue |
|---|---|---|
| Energy | 16 | $1,198B |
|
||
| Technology | 5 | $198B |
|
||
| Engineering / Construction | 4 | $72B |
|
||
| Energy Services | 3 | $60B |
|
||
| Utilities | 3 | $41B |
|
||
| Healthcare | 2 | $330B |
|
||
Price history
-99.4% since first listed10 events — show timeline
- 2026-05-06 Rental Removed $1,550 SABOR
- 2026-04-29 Listed for Rent $1,550 SABOR
- 2026-03-26 Sold (MLS) — LERA
- 2026-02-13 Pending — LERA
- 2026-02-10 Price Changed $200,999 LERA
- 2026-02-05 Price Changed $210,999 LERA
- 2026-02-02 Listed $255,999 LERA
- 2026-01-31 Price Changed $255,999 LERA
- 2026-01-24 Price Changed $260,999 LERA
- 2025-12-10 Listed $265,999 LERA
Cash-flow waterfall
monthlySold comps — $/sqft
last 12 mo · ≤1 miLoading sold comps…