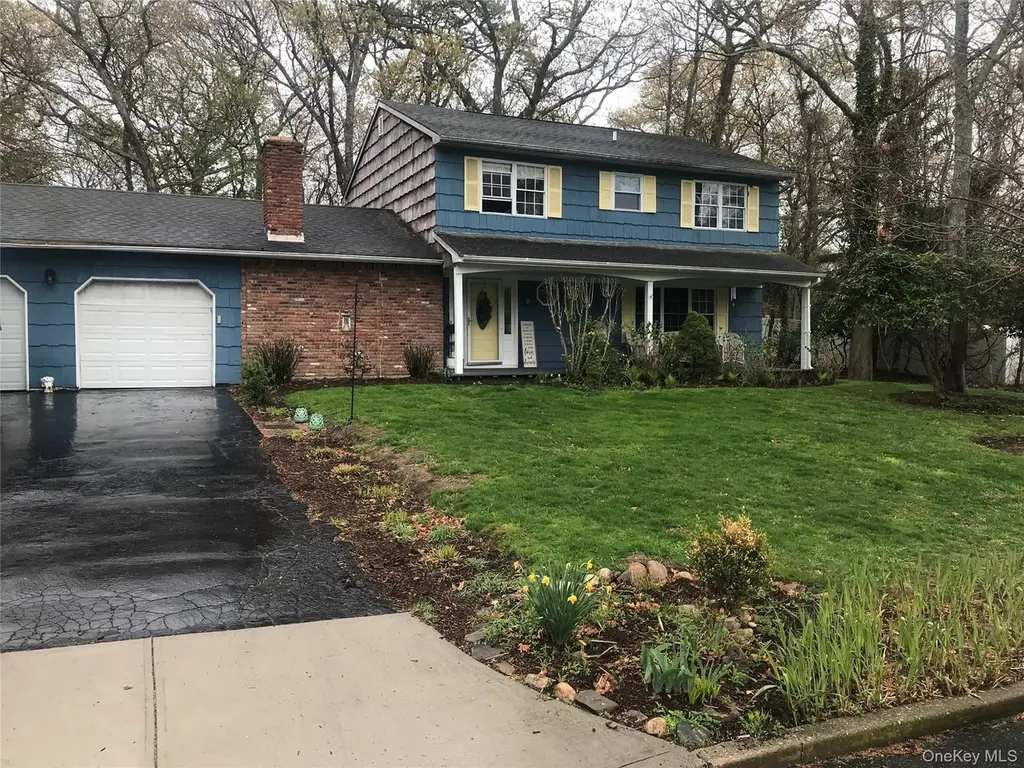
19 Reynolds Rd · East Shoreham, NY
Flood risk 1/10 · Minimal
- FEMA flood zone
- X (unshaded)
- Chance of flooding over 30 yrs
- 0.0%
- Est. flood insurance / yr
- $473 – $860
Fire risk 3/10 · Minor
- Est. fire insurance / yr
- $691 – $1,283
Heat risk 4/10 · Minor
- Hot days now (above 93°F)
- 7 days/yr
- Hot days in 30 yrs
- 18 days/yr
Wind risk 6/10 · Moderate
- Chance of severe wind over 30 yrs
- 75.0%
Air-quality risk 4/10 · Minor
- Unhealthy air days now
- 3 days/yr
- Unhealthy air days in 30 yrs
- 5 days/yr
Risk factors via First Street. Map © Google.
Why this score? — see what drove the D grade
The composite is a weighted blend of 9 inputs, each scored 0–100. Each bar is that input's sub-score; the figure is the points it added to the 100-point composite (weight × sub-score).
- ARV discount +15.0/15.0
- Schools +7.4/10.0
- Cash flow +6.6/30.0
- Livability +3.2/5.0
- Rent growth +2.5/5.0
- Condition / age +2.5/5.0
- 1% rule +2.3/10.0
- DSCR +0.8/10.0
- Appreciation +0.0/10.0
$649,900
🖨 Deal sheet 📄 Offer letter ✓ Due diligence
Listing remarks
Jomar 4Bedroom, 2 Car Garage, Colonial in North Shoreham, Shoreham Wading River School District. Close to shopping and beaches and vast nature trails and woods. IMMEADIATE OCCUPANCY !!
Key facts
- Woods
- Nature trails
- 0.52 acre lot
Tags
Property features AI
Exterior
- Parking: Driveway; 2-car garage
- Utilities: Cesspool sewer; Cable connected; Electricity connected; Water connected
- Home design: Single family residence; Two levels
- Construction: Frame construction
- Exterior features: Frame construction; Not waterfront
Interior
- Kitchen: Convection oven; Cooktop; Dishwasher; Refrigerator
- Bedrooms: Total rooms: 8
- Flooring: Hardwood floors
- Bathrooms: 2 full bathrooms; 1 half bathroom
- Heating & cooling: Electric heating; No central air
- Interior features: Open kitchen; Unfinished basement; Crawl attic; Fireplace
- Laundry & utility: Basement present (unfinished)
Neighborhood map
What this means for you Summary
Snapshot
- This is a 4-bed/2.5-bath single-family listed at $650k.
Deal economics
- At list price, monthly cash flow is $-1k ($-13k/yr) — negative.
- To cash-flow at today's rent, offer at most $460k (29.3% below list).
- To meet the 1% rule (rent ≥ 1% of price), the offer needs to be $475k (26.9% below list).
- Recommended offer: $460k (29.3% below list) — sets the bar for cash-flow.
- Cap rate 4.3% vs local median 3.1% in East Shoreham — top-decile yield for the area; either an underpriced asset or a hidden risk that comps aren't pricing in. Stress-test before assuming the spread holds.
Location & tenants
- Location reads 64/100 on livability (#724 in NY) — a middle-class / working-renter tenant base. Strengths: employment A+, housing A+, crime A; Watch: amenities F, commute F, cost of living F.
- Shoreham-Wading River Central School District (suburban): math 80% / reading 81% proficiency, ranked #36 of 590 in NY (top 6%) — strong family-tenant draw, lease renewals of 3-5y typical; only 3% free/reduced lunch — higher-income household profile.
- Zoned schools: Miller Avenue School (427 students, 0% FRL); Albert G Prodell Middle School (math 62% / reading 87%, grade A, #61 of 729 statewide, top 9%, 456 students, 0% FRL); Shoreham-Wading River High School (math 98% / reading 84%, grade A+, #203 of 1,100 statewide, top 20%, 708 students, 0% FRL) — zoned schools at 0% FRL track the district average.
- Market conditions: 45 active listings in the ZIP; 1 comparable units currently listed for rent nearby; 1,366 units permitted in Suffolk County in 2024 (216 in 5+ unit buildings).
Forward outlook
- Local home prices are declining (-3.0%/yr); year-one equity from $4k of loan paydown is wiped out by about $19k of value loss. Plan a longer hold.
- Suffolk County population projected to shrink 5% by 2050 — rents likely to lag national; underwrite the cash flow, not the appreciation.
Negotiation context
- Only 7 days on market — expect competitive offers; lowballing is unlikely to land.
Risks & watch-outs
- Climate carrying-cost: major wind risk, 75% chance of damaging wind over 30y — expect insurance premiums to compound above CPI over the hold.
Questions for the listing agent
- What do current leases actually rent for vs. the listed asking? Can we see a recent rent roll and the last 12 months of T-12 income?
- Built in 1975 — when were the roof, HVAC, electrical panel, plumbing, and water heater last replaced?
- Is there a deadline driving the sale (1031 exchange, divorce, estate, relocation)? That informs how much negotiation room exists.
- The area grade is low — what's the realistic commute time and amenity access for the typical tenant pool here? Any planned neighborhood developments (good or bad) we should know about?
- What's the average days-on-market for RENTAL listings here right now (not sales)? A rising rental-DOM trend means longer vacancies and softer asking-rent achievability than the comps imply.
- What's the recent tenant-quality profile in this submarket — average credit score on applications, eviction rate, late-payment / NSF rate, and stable-employment percentage? A property-management company in the area should have these aggregated.
- How much new for-sale + rental construction is in the pipeline within 1–3 miles? Heavy new supply typically softens prices + rents 12–24 months out; constrained supply supports both.
Investment metrics
- 1% rule
- 0.73% ✗
- Cap rate
- 4.30%
- Cash-on-cash
- -7.10%
- DSCR
- 0.68
- GRM
- 11.4
CMA / ARV
- ARV (median comp)
- $782,349
- List price
- $649,900
- Delta
- -16.93%
- Verdict
- UNDERPRICED
- Comps
- 20 within 1.0 mi
Show comp detail 12 sales within ~0.75 mi
| Address | Dist | Beds/Ba | Sqft | Sold | Price | $/sf | Match |
|---|---|---|---|---|---|---|---|
| 26 Royal Way | 0.11mi | 4/2.5 | 1,984 (-1%) | 7mo | $810,000 | $408 | 87 |
| 10 Jomar Rd | 0.14mi | 4/2.5 | 2,000 (-0%) | 11mo | $725,000 | $363 | 84 |
| 14 Miller Ave | 0.40mi | 4/2.5 | 2,023 (+1%) | 9mo | $745,000 | $368 | 73 |
| 23 John St | 0.19mi | 4/2.5 | 2,191 (+9%) | 4mo | $790,000 | $361 | 72 |
| 8 Miller Ave | 0.41mi | 4/2.5 | 2,129 (+6%) | 1mo | $780,000 | $366 | 70 |
| 12 Jomar Rd | 0.13mi | 3/2.0 (-1) | 1,800 (-10%) | 2mo | $730,500 | $406 | 68 |
| 34 John St | 0.25mi | 4/3.0 | 1,751 (-13%) | 5mo | $532,500 | $304 | 61 |
| 43 Fox Ln | 0.58mi | 3/2.0 (-1) | 2,034 (+1%) | 4mo | $560,000 | $275 | 60 |
| 10 Valentine Rd | 0.37mi | 3/3.0 (-1) | 2,200 (+10%) | 5mo | $575,000 | $261 | 55 |
| 3 Vee Jay Dr | 0.55mi | 3/1.0 (-1) | 2,100 (+5%) | 4mo | $615,000 | $293 | 52 |
| 5 Dartmouth Rd | 0.70mi | 3/2.0 (-1) | 2,137 (+6%) | 4mo | $730,000 | $342 | 46 |
| 7 Cornell Rd | 0.69mi | 3/2.0 (-1) | 1,800 (-10%) | 8mo | $645,000 | $358 | 38 |
Match score weights: distance 35% · size 25% · config 20% · recency 20%. Top-matched comps best support the ARV.
Projected returns pro-forma
-3.0% appreciation · 3.0% rent growth · sell at horizon
- IRR
- -28.6%
- Equity multiple
- 0.05×
- Total profit
- $-173,615
- Equity at exit
- $96,902
- IRR
- -27.8%
- Equity multiple
- -0.31×
- Total profit
- $-238,356
- Equity at exit
- $56,191
Cash invested: $181,972 (down + closing). Projections, not guarantees.
Landlord ↔ Tenant lean methodology
- Overall (STATE)
- 15 Strongly Tenant-Friendly
- State New York
- 15 Strongly Tenant-Friendly · D+10
- County
- — inherits STATE
- City
- — inherits STATE
ZIP-level market 11786
- Home prices YoY
- -16.2%
- Active inventory
- 45
- Price-to-rent
- 11.4×
Monthly cashflow live
- Estimated rent
- $4,750 medium interval (Pro) →
- Mortgage (P&I)
- −$3,408
- Tax from tax record
- −$1,150 /mo · $13,804/yr
- Insurance
- −$271
- HOA
- −$0
- Vacancy / Maint / Mgmt
- −$998
- Net cashflow
- $-1,077
Break-even live
UW: 25.0% down · 7.5% · 30yr · 1.5% tax · 5.0% vac · 8.0% maint · 8.0% mgmt
Financing live
Cash to close
- Down payment
- $162,475
- Closing costs
- $19,497
- Reserves months
- —
- Total cash needed
- —
Loan-product check · same deal, 3 products live
Conventional
25% down · 7.5% · 30yr
- Down + closing
- —
- Monthly P&I
- —
- Monthly cashflow
- —
- DSCR
- —
- Eligible?
- —
Personal DTI + credit; lowest rate.
DSCR
20% down · 8.5% · 30yr
- Down + closing
- —
- Monthly P&I
- —
- Monthly cashflow
- —
- DSCR
- —
- Eligible?
- —
No personal income docs; deal must DSCR.
Hard money
10% down · 12.0% · 12mo
- Down + closing
- —
- Monthly P&I
- —
- Monthly cashflow
- —
- DSCR
- —
- Eligible?
- —
Short-term bridge; refi at stabilization.
Rent comps 1 comps
| Address | Beds | Baths | Sqft | Rent | $/sqft | DOM | Units | Dist |
|---|---|---|---|---|---|---|---|---|
| 26 Fox Ln Shoreham, NY | 4.0 | 3.0 | 1720 | $4,750 | $2.76 | 10d | 1 | 0.51mi |
Listing history 1 events
-
2026-04-28$649,900 Active
ⓘ Source: listings_history table (triggers on properties + properties_extension) + one-shot
backfill from property_details.listing_events for pre-trigger history.
Tax reassessment forecast NY · Partial reset (capped growth)
- Current annual tax
- $13,804 · $1,150/mo
- Projected year-2 tax
- $13,804 · $1,150/mo
- Expected delta
- $0/yr ($0/mo · -0.0%)
ⓘ Screening estimate from a state-policy table — verify with the county assessor before closing.
Climate risk First Street
- Flood 1/10 Low FEMA zone X (unshaded) · 0% chance over 30 yrs
- Wildfire 3/10 Moderate
- Heat 4/10 Moderate 7 d/yr ≥93°F today · 18 d/yr by 30 yrs out
- Wind 6/10 Major 75% chance of damaging wind over 30 yrs
- Air quality 4/10 Moderate 3 unhealthy d/yr today · 5 by 30 yrs out
Nearby sold comps map
Loading sold comps map…
Walkable amenities ~0.75 mi
Loading nearby amenities…
Taxation est. · year 1
- Rental income
- $57,000
- − Mortgage interest
- −$36,405
- − Property taxes
- −$13,804
- − Insurance
- −$3,250
- − Repairs & maintenance
- −$4,560
- − Management
- −$4,560
- − Depreciation
- −$18,906
- Taxable loss
- −$24,485
- Est. tax savings @ 24.0%
- +$5,876
- After-tax cash flow
- $-7,045/yr
For passive investors: Depreciation is non-cash, so a rental often shows a tax loss while cash-flowing — sheltering income. Rental losses are passive: they offset passive income freely, and up to $25,000/yr can offset ordinary (W-2) income if you actively participate and your MAGI is under $100k (phasing out to $0 by $150k); unused losses carry forward. On sale, claimed depreciation is recaptured at up to 25%, and gains may owe capital-gains tax (a 1031 exchange can defer both). Figures are a year-1 estimate at your 24.0% rate — not tax advice; consult a CPA.
Schools (NCES district)
- District
- Shoreham-Wading River Central School District
- NCES district ID
- 3626840
- Math proficiency
- 80% ▼ -1.00%
- Reading proficiency
- 81% ▲ 6.00%
- Median HH income
- $115,782
- Composite
- 74.37/100
- National rank
- #160
- State rank
- #36 of 590 in NY
Livability — East Shoreham
- Score
- 64/100
- State rank
- #724
- US rank
- #13829
Category grades
Schools grade is shown separately in the Schools card above.
Census & demographics
- Census place
- East Shoreham, NY
- City population
- 6,348
- Population (ZIP)
- 6,348
Population outlook (Suffolk County) Hauer SSP2
- Today (2025)
- 1,505,262 people
- By 2030
- 1,498,318 · -0.5%
- By 2040
- 1,471,101 · -2.3%
- By 2050
- 1,424,848 · -5.3%
- By 2075
- 1,337,157 · -11.2%
- By 2100
- 1,217,720 · -19.1%
Race, ethnicity, and origin ACS 2023
- Neighborhood character
- Predominantly White (83%)
- Race & ethnicity
- White 83% Hispanic / Latino 12% Two or more races 6% Asian 3% Black 2%
- Hispanic origin (detail)
- Mexican 1% Puerto Rican 6% Cuban 1%
- Common ancestry
- Romanian 5% Scotch-Irish 1% Lithuanian 1%
- Foreign-born
- 6% · Canada, China, South Korea
- Languages at home
- 92% English-only · Spanish 4% Other Indo-European 2% Arabic 1%
Political lean MEDSL · Suffolk
- 2024 margin
- Lean R (+10.0) · D 45.0% · R 55.0%
- 2008→2024 swing
- -16.0pp toward R · 2008: 6.0pp · 2024: -10.0pp
- All cycles
- 2024: R+10.0 2020: R+0.0 2016: R+8.2 2012: D+2.9 2008: D+6.0
Not yet ingested
- Civics
- —
Market trends
- HPI YoY
- ▼ -63.92%
- Current HPI
- 330.5038
- Rent YoY
- —
- Metro
- —
- State GDP YoY
- ▲ 2.60%
- F500 in state
- 92
Industry mix (Fortune 500 HQ in NY)
| Industry | F500 HQs | Revenue |
|---|---|---|
| Financial Services | 10 | $950B |
|
||
| Consumer Goods | 9 | $162B |
|
||
| Insurance | 4 | $225B |
|
||
| Telecommunications | 2 | $144B |
|
||
| Pharmaceuticals | 2 | $112B |
|
||
| Media / Entertainment | 2 | $69B |
|
||
Price history
2 events — show timeline
- 2026-05-23 Pending — OneKey® MLS as Distributed by MLS Grid
- 2026-04-28 Listed $649,900 OneKey® MLS as Distributed by MLS Grid
Property tax history
+2.7%/yrLatest (2025): $13,804 · +0.0% YoY. Source: county tax records.
Cash-flow waterfall
monthlySold comps — $/sqft
last 12 mo · ≤1 miLoading sold comps…