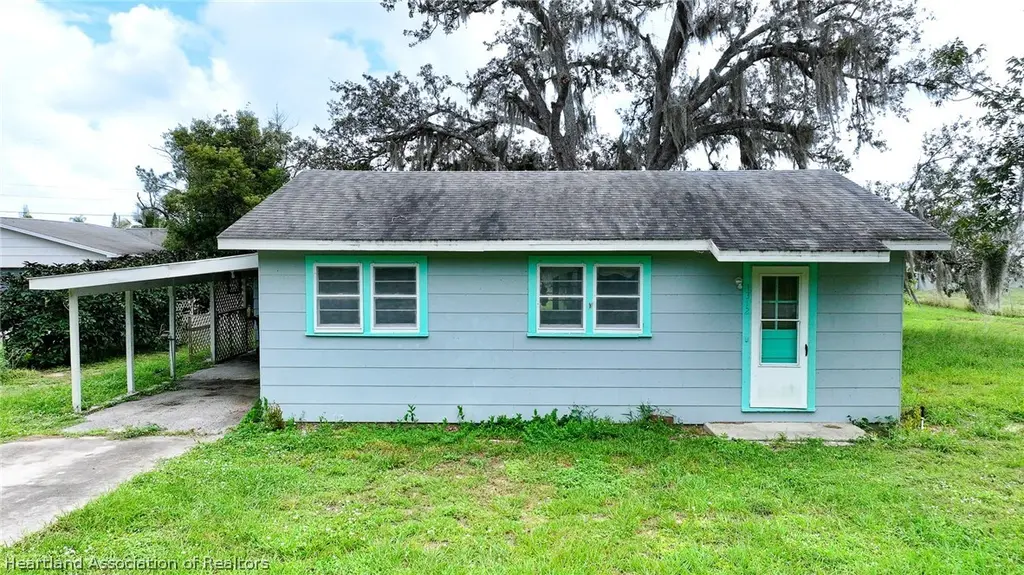
1312 Weigle Ave · Sebring, FL
Flood risk No data
- FEMA flood zone
- —
- Chance of flooding over 30 yrs
- —
- Est. flood insurance / yr
- —
Fire risk No data
- Est. fire insurance / yr
- —
Heat risk No data
- Hot days now (above threshold)
- —
- Hot days in 30 yrs
- —
Wind risk No data
- Chance of severe wind over 30 yrs
- —
Air-quality risk No data
- Unhealthy air days now
- —
- Unhealthy air days in 30 yrs
- —
Risk factors via First Street. Map © Google.
Why this score? — see what drove the D grade
The composite is a weighted blend of 9 inputs, each scored 0–100. Each bar is that input's sub-score; the figure is the points it added to the 100-point composite (weight × sub-score).
- Cash flow +20.6/30.0
- DSCR +6.5/10.0
- 1% rule +4.9/10.0
- Schools +3.6/10.0
- Livability +3.3/5.0
- Rent growth +2.4/5.0
- Condition / age +2.2/5.0
- ARV discount +0.0/15.0
- Appreciation +0.0/10.0
$125,000
🖨 Deal sheet 📄 Offer letter ✓ Due diligence
Listing remarks MLS
Lots of potential with this historic home on a double lot close to downtown Sebring! No HOA here. The bonus lot allows ample space for gardening, and the fenced backyard creates a perfect space for pets - even chickens! Perfect location to have a small 0.31 acre "homestead" with all the convenience of living in the city. This cozy one bedroom, one bathroom home has a cottage style kitchen. Original southern yellow pine flooring throughout (sheet linoleum covers the flooring in the kitchen) has the potential to be beautifully restored. The enclosed rear porch could be converted into a second bedroom. Fresh exterior paint. Roof replaced December 2017. Bring your creative side and tour this home today before it's gone!
Key facts
- Downtown sebring
- Central location
- Quiet neighborhood
Tags
Property features AI
Exterior
- Parking: Carport (1 car)
- Utilities: Public water; Public sewer
- Home design: Single-family residence; One story; Residential property
- Construction: Frame construction; Shingle roof; Built on a single-level foundation
- Exterior features: Enclosed rear porch; Paved road frontage; Frontage length approximately 50 feet; Pets allowed
Interior
- Kitchen: Cooktop; Refrigerator
- Bedrooms: 2 total rooms (includes bedrooms and living areas)
- Flooring: Hardwood floors
- Bathrooms: 1 full bathroom
- Heating & cooling: Wall furnace heating; Wall-mounted cooling unit(s)
- Interior features: Cooktop; Refrigerator
Neighborhood map
What this means for you Summary
Snapshot
- This is a 2-bed/1.0-bath single-family listed at $125k. Condition is rated fair.
Deal economics
- At list price, monthly cash flow is $166 ($2k/yr) — positive.
- The deal already cash-flows at list — no discount required.
- To meet the 1% rule (rent ≥ 1% of price), the offer needs to be $123k (1.4% below list).
- Recommended offer: $121k (3.0% below list) — sets the bar for market timing.
- Cap rate 7.9% vs local median 4.3% in Sebring — top-decile yield for the area; either an underpriced asset or a hidden risk that comps aren't pricing in. Stress-test before assuming the spread holds.
Location & tenants
- Location reads 66/100 on livability (#618 in FL) — a middle-class / working-renter tenant base. Strengths: cost of living A+, housing A+, health & safety A; Watch: amenities F, commute F, employment F.
- Highlands (other): math 45% / reading 43% proficiency, ranked #54 of 73 in FL (top 74%) — families likely to look elsewhere, expect single-tenant / working-renter base with shorter leases; 68% free/reduced lunch — lower-income household profile, screen leases tightly.
- Zoned schools: Sebring Middle School (math 52% / reading 40%, grade D+, #300 of 571 statewide, top 53%, 815 students, 64% FRL); Sebring High School (math 32% / reading 48%, grade F, #296 of 667 statewide, top 45%, 1,809 students, 56% FRL).
- Market conditions: Rents soft (-0.3%/yr); 475 active listings in the ZIP; 980 units permitted in Highlands County in 2024 (80 in 5+ unit buildings).
Forward outlook
- Local home prices are declining (-3.0%/yr); year-one equity from $864 of loan paydown is wiped out by about $4k of value loss. Plan a longer hold.
Negotiation context
- It's been on market 35 days — a 3% lower offer ($121k) is reasonable based on typical stale-listing flexibility.
- 3 sale attempts since 10y ago with the ask held roughly flat each time — persistent listings suggest the price (not the market) is what's stuck; bring a comps-based counter.
- Current owner paid $70k; list at $125k implies a 79% gain — meaningful room to come down on a strong offer.
Risks & watch-outs
- Watch-outs: built in 1955 — expect roof / HVAC / electrical / plumbing capex.
Questions for the listing agent
- It's been on market 35 days. Have you received any prior offers? Is the seller open to a 3% concession, seller financing, or rate buy-down credit?
- Have any recent inspections been done? Can we get a copy of the seller's disclosures and any deferred-maintenance estimates?
- Built in 1955 — when were the roof, HVAC, electrical panel, plumbing, and water heater last replaced?
- Is there a deadline driving the sale (1031 exchange, divorce, estate, relocation)? That informs how much negotiation room exists.
- Schools are D-rated, which usually means shorter tenancies and higher turnover. Who's the typical renter profile here, and what's been the actual vacancy rate?
- The area grade is low — what's the realistic commute time and amenity access for the typical tenant pool here? Any planned neighborhood developments (good or bad) we should know about?
- What's the average days-on-market for RENTAL listings here right now (not sales)? A rising rental-DOM trend means longer vacancies and softer asking-rent achievability than the comps imply.
- What's the recent tenant-quality profile in this submarket — average credit score on applications, eviction rate, late-payment / NSF rate, and stable-employment percentage? A property-management company in the area should have these aggregated.
- How much new for-sale + rental construction is in the pipeline within 1–3 miles? Heavy new supply typically softens prices + rents 12–24 months out; constrained supply supports both.
Investment metrics
- 1% rule
- 0.99% ✗
- Cap rate
- 7.89%
- Cash-on-cash
- 5.70%
- DSCR
- 1.25
- GRM
- 8.5
CMA / ARV
- ARV (on-the-fly)
- $95,760
- Comps found
- 10
Show comp detail 10 sales within ~0.75 mi
| Address | Dist | Beds/Ba | Sqft | Sold | Price | $/sf | Match |
|---|---|---|---|---|---|---|---|
| 1312 Weigle Ave | 0.00mi | 2/1.0 | 720 (0%) | 0mo | $125,000 | $174 | 100 |
| 1506 Orange Blossom Ave | 0.64mi | 2/1.0 | 725 (+1%) | 5mo | $55,000 | $76 | 65 |
| 615 Denise Ave | 0.23mi | 2/1.0 | 800 (+11%) | 8mo | $106,250 | $133 | 64 |
| 614 Denise Ave | 0.26mi | 2/1.0 | 800 (+11%) | 8mo | $106,250 | $133 | 63 |
| 4718 2nd St | 0.55mi | 2/1.0 | 812 (+13%) | 2mo | $54,900 | $68 | 51 |
| 3021 Villa Rd | 0.63mi | 2/1.0 | 800 (+11%) | 1mo | $120,000 | $150 | 51 |
| 1912 Wightman Ave | 0.39mi | 2/1.0 | 816 (+13%) | 16mo | $152,000 | $186 | 47 |
| 1900 Palm Blvd | 0.59mi | 2/1.0 | 625 (-13%) | 5mo | $73,000 | $117 | 46 |
| 1705 Roseland Ave | 0.59mi | 1/1.0 (-1) | 625 (-13%) | 6mo | $56,000 | $90 | 40 |
| 3002 Spinks Rd | 0.68mi | 2/1.0 | 800 (+11%) | 20mo | $127,000 | $159 | 33 |
Match score weights: distance 35% · size 25% · config 20% · recency 20%. Top-matched comps best support the ARV.
Projected returns pro-forma
-3.0% appreciation · 0.0% rent growth · sell at horizon
- IRR
- -10.7%
- Equity multiple
- 0.62×
- Total profit
- $-13,291
- Equity at exit
- $18,638
- IRR
- -6.1%
- Equity multiple
- 0.66×
- Total profit
- $-11,960
- Equity at exit
- $10,808
Cash invested: $35,000 (down + closing). Projections, not guarantees.
Landlord ↔ Tenant lean methodology
- Overall (STATE)
- 87 Strongly Landlord-Friendly
- State Florida
- 87 Strongly Landlord-Friendly · R+3
- County
- — inherits STATE
- City
- — inherits STATE
ZIP-level market 33870
- Home prices YoY
- -20.0%
- Rents YoY
- -0.3%
- Active inventory
- 475
- Price-to-rent
- 8.5×
Monthly cashflow live
- Estimated rent
- $1,233 medium interval (Pro) →
- Mortgage (P&I)
- −$656
- Tax from tax record
- −$100 /mo · $1,199/yr
- Insurance
- −$52
- HOA
- −$0
- Vacancy / Maint / Mgmt
- −$259
- Net cashflow
- $166
Break-even live
UW: 25.0% down · 7.5% · 30yr · 1.5% tax · 5.0% vac · 8.0% maint · 8.0% mgmt
Financing live
Cash to close
- Down payment
- $31,250
- Closing costs
- $3,750
- Reserves months
- —
- Total cash needed
- —
Loan-product check · same deal, 3 products live
Conventional
25% down · 7.5% · 30yr
- Down + closing
- —
- Monthly P&I
- —
- Monthly cashflow
- —
- DSCR
- —
- Eligible?
- —
Personal DTI + credit; lowest rate.
DSCR
20% down · 8.5% · 30yr
- Down + closing
- —
- Monthly P&I
- —
- Monthly cashflow
- —
- DSCR
- —
- Eligible?
- —
No personal income docs; deal must DSCR.
Hard money
10% down · 12.0% · 12mo
- Down + closing
- —
- Monthly P&I
- —
- Monthly cashflow
- —
- DSCR
- —
- Eligible?
- —
Short-term bridge; refi at stabilization.
Listing history 6 events
-
2026-04-21$125,000 Active
-
2026-01-08price $125,000
-
2022-04-12soldstatus $69,900 735-char remark
Show marketing remark (735 chars)
Lots of potential with this historic home on a double lot close to downtown Sebring! No HOA here. The bonus lot allows ample space for gardening, and the fenced backyard creates a perfect space for pets - even chickens! Perfect location to have a small 0.31 acre "homestead" with all the convenience of living in the city. This cozy one bedroom, one bathroom home has a cottage style kitchen. Original southern yellow pine flooring throughout (sheet linoleum covers the flooring in the kitchen) has the potential to be beautifully restored. The enclosed rear porch could be converted into a second bedroom. Fresh exterior paint. Roof replaced December 2017. Bring your creative side and tour this home today before it's gone!
-
2022-03-20$69,900 735-char remark
Show marketing remark (735 chars)
Lots of potential with this historic home on a double lot close to downtown Sebring! No HOA here. The bonus lot allows ample space for gardening, and the fenced backyard creates a perfect space for pets - even chickens! Perfect location to have a small 0.31 acre "homestead" with all the convenience of living in the city. This cozy one bedroom, one bathroom home has a cottage style kitchen. Original southern yellow pine flooring throughout (sheet linoleum covers the flooring in the kitchen) has the potential to be beautifully restored. The enclosed rear porch could be converted into a second bedroom. Fresh exterior paint. Roof replaced December 2017. Bring your creative side and tour this home today before it's gone!
-
2016-08-01soldstatus $15,010
-
2016-07-19$15,000
ⓘ Source: listings_history table (triggers on properties + properties_extension) + one-shot
backfill from property_details.listing_events for pre-trigger history.
Tax reassessment forecast FL · Resets to sale price
- Current annual tax
- $1,199 · $100/mo
- Projected year-2 tax
- $1,199 · $100/mo
- Expected delta
- $0/yr ($0/mo · 0.0%)
ⓘ Screening estimate from a state-policy table — verify with the county assessor before closing.
Nearby sold comps map
Loading sold comps map…
Walkable amenities ~0.75 mi
Loading nearby amenities…
Taxation est. · year 1
- Rental income
- $14,792
- − Mortgage interest
- −$7,002
- − Property taxes
- −$1,199
- − Insurance
- −$625
- − Repairs & maintenance
- −$1,183
- − Management
- −$1,183
- − Depreciation
- −$3,636
- Taxable loss
- −$37
- Est. tax savings @ 24.0%
- +$9
- After-tax cash flow
- $2,005/yr
For passive investors: Depreciation is non-cash, so a rental often shows a tax loss while cash-flowing — sheltering income. Rental losses are passive: they offset passive income freely, and up to $25,000/yr can offset ordinary (W-2) income if you actively participate and your MAGI is under $100k (phasing out to $0 by $150k); unused losses carry forward. On sale, claimed depreciation is recaptured at up to 25%, and gains may owe capital-gains tax (a 1031 exchange can defer both). Figures are a year-1 estimate at your 24.0% rate — not tax advice; consult a CPA.
Condition & rehab AI · 12 photos
This home requires moderate renovations to address structural and aesthetic issues, but has great potential for increased value through targeted updates.
Repairs flagged
- Major Exposed subfloor — Structural damage
- Major Missing cabinets — Aesthetic and functional loss
- Major Worn fixtures — Aesthetic and functional loss
- Major Missing shower curtain — Aesthetic and functional loss
- Major Overgrown landscaping — Reduces curb appeal
- Major Peeling paint — Reduces curb appeal
- Major Worn hardwood — Reduces value
- Major Exposed subfloor — Structural damage
Value-add opportunities
- Resale New cabinets and countertops — Enhances kitchen functionality and aesthetics
- Resale New flooring — Enhances overall home appearance
- Both Landscaping and curb appeal improvements — Enhances home's curb appeal and overall aesthetic
- Resale Painting and repairs — Enhances home's overall appearance and value
Renovation cost estimate screening
| Repair item | Severity | Est. cost |
|---|---|---|
| Exposed subfloor · Structural damage | Major | $15,000–50,000 |
| Missing cabinets · Aesthetic and functional loss | Major | $15,000–50,000 |
| Worn fixtures · Aesthetic and functional loss | Major | $15,000–50,000 |
| Missing shower curtain · Aesthetic and functional loss | Major | $15,000–50,000 |
| Overgrown landscaping · Reduces curb appeal | Major | $15,000–50,000 |
| Peeling paint · Reduces curb appeal | Major | $15,000–50,000 |
| Worn hardwood · Reduces value | Major | $15,000–50,000 |
| Exposed subfloor · Structural damage | Major | $15,000–50,000 |
| Total estimated repair cost · 8 items | $120,000–400,000 |
Value-add ROI direction
- Resale New cabinets and countertops — Enhances kitchen functionality and aesthetics ↑
- Resale New flooring — Enhances overall home appearance ↑
- Both Landscaping and curb appeal improvements — Enhances home's curb appeal and overall aesthetic ↑
- Resale Painting and repairs — Enhances home's overall appearance and value ↑
ⓘ Cost ranges are severity-bucket heuristics (US national rule-of-thumb). Get contractor quotes + a written scope before underwriting a rehab budget.
Schools (NCES district)
- District
- Highlands
- NCES district ID
- 1200840
- Math proficiency
- 45% ▼ -7.00%
- Reading proficiency
- 43% ▼ -3.00%
- Median HH income
- $35,276
- Composite
- 36.42/100
- National rank
- #4672
- State rank
- #54 of 73 in FL
Livability — Sebring
- Score
- 66/100
- State rank
- #618
- US rank
- #11992
Category grades
Schools grade is shown separately in the Schools card above.
Census & demographics
- County
- Highlands County · 98,898 people
- City population
- 50,797
- Metro
- Sebring-Avon Park, FL
- Population (ZIP)
- 25,195
- Household income
- $49,942
- Rent vs Own
- Severe rent burden
- 994.0
Population outlook (Highlands County) Hauer SSP2
- Today (2025)
- 99,674 people
- By 2030
- 99,615 · -0.1%
- By 2040
- 99,342 · -0.3%
- By 2050
- 98,242 · -1.4%
- By 2075
- 93,291 · -6.4%
- By 2100
- 79,894 · -19.8%
Race, ethnicity, and origin ACS 2023
- Neighborhood character
- Diverse neighborhood (Simpson 0.57)
- Race & ethnicity
- White 60% Hispanic / Latino 22% Black 13% Two or more races 10% Asian 1%
- Hispanic origin (detail)
- Mexican 8% Puerto Rican 7% Cuban 5%
- Common ancestry
- Slovak 2% Romanian 1% Lithuanian 1%
- Foreign-born
- 10% · Canada, Jamaica, China
- Languages at home
- 80% English-only · Spanish 16% Other Indo-European 1% French/Haitian/Cajun 1%
Political lean MEDSL · Highlands
- 2024 margin
- Solid R (+40.8) · D 29.3% · R 70.1%
- 2008→2024 swing
- -22.7pp toward R · 2008: -18.1pp · 2024: -40.8pp
- All cycles
- 2024: R+40.8 2020: R+34.4 2016: R+32.0 2012: R+23.0 2008: R+18.1
Not yet ingested
- Civics
- —
Market trends
- HPI YoY
- ▼ -68.68%
- Current HPI
- 273.9861
- Rent YoY
- ▼ -0.29%
- Metro
- Sebring-Avon Park, FL
- State GDP YoY
- ▲ 3.28%
- F500 in state
- 36
Industry mix (Fortune 500 HQ in FL)
| Industry | F500 HQs | Revenue |
|---|---|---|
| Industrial Technology | 2 | $29B |
|
||
| Insurance | 2 | $17B |
|
||
| Retail | 1 | $60B |
|
||
| Technology Distribution | 1 | $58B |
|
||
| Homebuilding | 1 | $35B |
|
||
| Technology Manufacturing | 1 | $35B |
|
||
Price history
+733.3% since first listed6 events — show timeline
- 2026-04-21 Listed $125,000 HAOR as distributed by MLS GRID
- 2026-01-08 Price Changed $125,000 HAOR as distributed by MLS GRID
- 2022-04-12 Sold (MLS) $69,900 HAOR as distributed by MLS GRID
- 2022-03-20 Listed $69,900 HAOR as distributed by MLS GRID
- 2016-08-01 Sold (MLS) $15,010 HAOR as distributed by MLS GRID
- 2016-07-19 Listed $15,000 HAOR as distributed by MLS GRID
Cash-flow waterfall
monthlySold comps — $/sqft
last 12 mo · ≤1 miLoading sold comps…