63 S 3rd St · Ravenden, AR
Flood risk No data
- FEMA flood zone
- —
- Chance of flooding over 30 yrs
- —
- Est. flood insurance / yr
- —
Fire risk No data
- Est. fire insurance / yr
- —
Heat risk No data
- Hot days now (above threshold)
- —
- Hot days in 30 yrs
- —
Wind risk No data
- Chance of severe wind over 30 yrs
- —
Air-quality risk No data
- Unhealthy air days now
- —
- Unhealthy air days in 30 yrs
- —
Risk factors via First Street. Map © Google.
Why this score? — see what drove the D grade
The composite is a weighted blend of 9 inputs, each scored 0–100. Each bar is that input's sub-score; the figure is the points it added to the 100-point composite (weight × sub-score).
- Cash flow +13.7/30.0
- ARV discount +7.5/15.0
- Appreciation +5.0/10.0
- DSCR +4.1/10.0
- 1% rule +3.8/10.0
- Livability +3.1/5.0
- Rent growth +2.5/5.0
- Condition / age +2.5/5.0
- Schools +2.3/10.0
$99,900
🖨 Deal sheet 📄 Offer letter ✓ Due diligence
Listing remarks
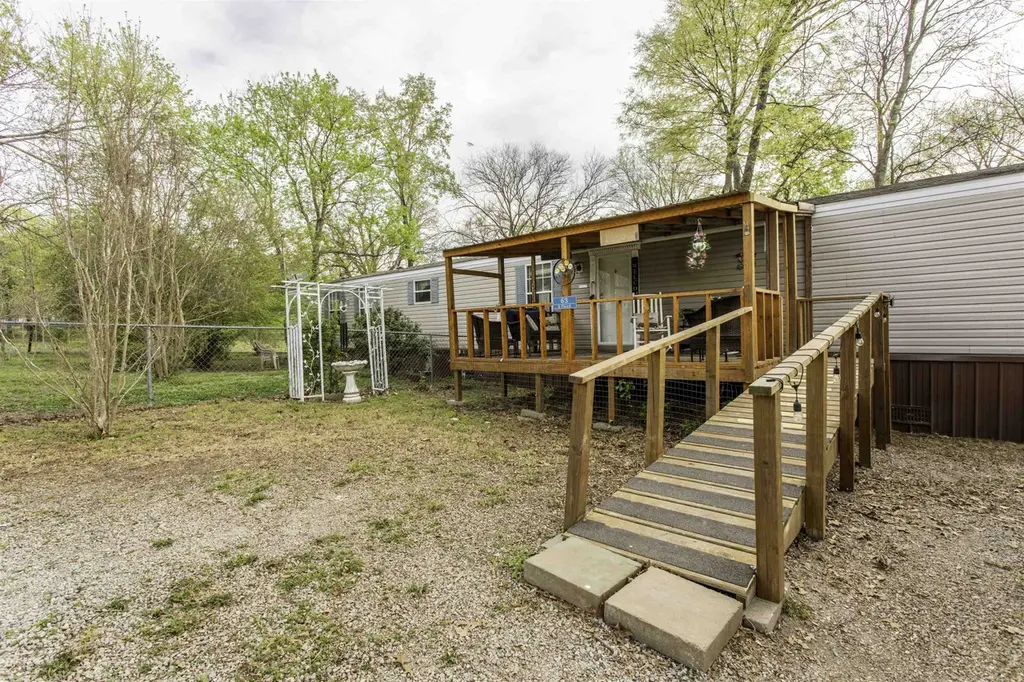
Country home in town on Approx. 1 Acre in Ravenden, AR! Welcome to this well-maintained 3-bedroom, 2-bath manufactured home nestled on multiple lots totaling approximately 1 acre in the heart of Lawrence County. If you’re looking for peaceful surroundings with room to breathe, this one checks the boxes. Enjoy your mornings or evenings on the inviting covered front deck (8’x16’), complete with a handicap-accessible ramp for easy entry. The home offers a comfortable layout with a spacious living area, open kitchen and dining space, and a private primary suite featuring a relaxing soaking tub. Outside, you’ll find a partially fenced yard—perfect for pets or a gar
Key facts
- 2-car metal carport
- Covered front deck
- 1 acre lot
Tags
Property features AI
Finance
- Other: Approximately 1 acre lot
- Financial info: Cash financing available
Exterior
- Parking: Carport for 2 cars
- Utilities: Public sewer; Public water; Electric provided by co-op; Fiber internet available
- Home design: Manufactured single-wide home; Located inside city limits; Level lot in a subdivision
- Construction: Metal/vinyl siding; Metal and architectural shingle roof; Crawl space foundation
- Exterior features: Deck; Porch; Covered patio; Partially fenced yard; Chain link fencing; Dog run; Outside storage area
Interior
- Kitchen: Free-standing stove / electric range; Dishwasher; Refrigerator included
- Flooring: Carpet; Vinyl; Laminate
- Bathrooms: 2 full bathrooms
- Heating & cooling: Central electric heating; Central electric cooling
- Interior features: Washer connection and washer included; Dryer connection (electric) and dryer included; Walk-in closet(s); Handicapped design; Walk-in shower; Formica kitchen countertops; Sheetrock walls and ceilings
- Laundry & utility: Laundry room
Neighborhood map
What this means for you Summary
Snapshot
- This is a 3-bed/2.0-bath manufactured listed at $100k.
Deal economics
- At list price, monthly cash flow is $8 ($91/yr) — positive.
- The deal already cash-flows at list — no discount required.
- To meet the 1% rule (rent ≥ 1% of price), the offer needs to be $88k (11.6% below list).
- Recommended offer: $88k (11.6% below list) — sets the bar for 1% rule.
Location & tenants
- Location reads 61/100 on livability (#241 in AR) — a middle-class / working-renter tenant base. Strengths: cost of living A+, housing A+, health & safety A; Watch: crime C-, amenities F, commute F.
- Sloan-Hendrix School District (rural): math 28% / reading 28% proficiency, ranked #171 of 238 in AR (top 72%) — low school quality limits family demand, transient renter base, plan for 1-2y turnover.
- Zoned schools: Sloan-Hendrix Elem. School (math 37% / reading 22%, grade F, #305 of 454 statewide, top 71%, 440 students, 69% FRL); Sloan-Hendrix High School (math 22% / reading 31%, grade F, #180 of 292 statewide, top 62%, 365 students, 62% FRL).
- Market conditions: 26 active listings in the ZIP; 63 units permitted in Lawrence County in 2024 (15 in 5+ unit buildings).
Forward outlook
- In year one you build about $4k of equity ($691 loan paydown + $3k appreciation (3.0% local appreciation)).
- Lawrence County population projected at -23% by 2050 — secular population decline; favor cash flow + early exit over multi-decade hold.
- At projected returns (3.0% appreciation + 3.0% rent growth), your $28k cash investment doubles in ~6 years — after that, you're playing with house money.
- By year 9, paydown + projected appreciation supports a ~$31k cash-out refi (75% LTV) — recoverable capital for the next deal without selling this one.
Negotiation context
- It's been on market 26 days — a 2% lower offer ($98k) is reasonable based on typical stale-listing flexibility.
- Current owner paid $12k; list at $100k implies a 732% gain — meaningful room to come down on a strong offer.
Questions for the listing agent
- Is there a deadline driving the sale (1031 exchange, divorce, estate, relocation)? That informs how much negotiation room exists.
- Schools are F-rated, which usually means shorter tenancies and higher turnover. Who's the typical renter profile here, and what's been the actual vacancy rate?
- The area grade is low — what's the realistic commute time and amenity access for the typical tenant pool here? Any planned neighborhood developments (good or bad) we should know about?
- What's the average days-on-market for RENTAL listings here right now (not sales)? A rising rental-DOM trend means longer vacancies and softer asking-rent achievability than the comps imply.
- What's the recent tenant-quality profile in this submarket — average credit score on applications, eviction rate, late-payment / NSF rate, and stable-employment percentage? A property-management company in the area should have these aggregated.
- How much new for-sale + rental construction is in the pipeline within 1–3 miles? Heavy new supply typically softens prices + rents 12–24 months out; constrained supply supports both.
Investment metrics
- 1% rule
- 0.88% ✗
- Cap rate
- 6.38%
- Cash-on-cash
- 0.32%
- DSCR
- 1.01
- GRM
- 9.4
CMA / ARV
No comps found within radius.
Projected returns pro-forma
3.0% appreciation · 3.0% rent growth · sell at horizon
- IRR
- 7.8%
- Equity multiple
- 1.45×
- Total profit
- $12,529
- Equity at exit
- $44,919
- IRR
- 10.5%
- Equity multiple
- 2.57×
- Total profit
- $43,962
- Equity at exit
- $69,226
Cash invested: $27,972 (down + closing). Projections, not guarantees.
Landlord ↔ Tenant lean methodology
- Overall (STATE)
- 92 Strongly Landlord-Friendly
- State Arkansas
- 92 Strongly Landlord-Friendly · R+14
- County
- — inherits STATE
- City
- — inherits STATE
ZIP-level market 72459
- Active inventory
- 26
- Price-to-rent
- 9.4×
Monthly cashflow live
- Estimated rent
- $883 medium interval (Pro) →
- Mortgage (P&I)
- −$524
- Tax est. 1.5%
- −$125 /mo · $1,498/yr
- Insurance
- −$42
- HOA
- −$0
- Vacancy / Maint / Mgmt
- −$186
- Net cashflow
- $8
Break-even live
UW: 25.0% down · 7.5% · 30yr · 1.5% tax · 5.0% vac · 8.0% maint · 8.0% mgmt
Financing live
Cash to close
- Down payment
- $24,975
- Closing costs
- $2,997
- Reserves months
- —
- Total cash needed
- —
Loan-product check · same deal, 3 products live
Conventional
25% down · 7.5% · 30yr
- Down + closing
- —
- Monthly P&I
- —
- Monthly cashflow
- —
- DSCR
- —
- Eligible?
- —
Personal DTI + credit; lowest rate.
DSCR
20% down · 8.5% · 30yr
- Down + closing
- —
- Monthly P&I
- —
- Monthly cashflow
- —
- DSCR
- —
- Eligible?
- —
No personal income docs; deal must DSCR.
Hard money
10% down · 12.0% · 12mo
- Down + closing
- —
- Monthly P&I
- —
- Monthly cashflow
- —
- DSCR
- —
- Eligible?
- —
Short-term bridge; refi at stabilization.
Listing history 3 events
-
2026-04-28status Under Contract
-
2026-04-02$99,900 New Listing
-
1999-08-13soldstatus $12,000
ⓘ Source: listings_history table (triggers on properties + properties_extension) + one-shot
backfill from property_details.listing_events for pre-trigger history.
Nearby sold comps map
Loading sold comps map…
Walkable amenities ~0.75 mi
Loading nearby amenities…
Taxation est. · year 1
- Rental income
- $10,602
- − Mortgage interest
- −$5,596
- − Property taxes
- −$1,498
- − Insurance
- −$500
- − Repairs & maintenance
- −$848
- − Management
- −$848
- − Depreciation
- −$2,906
- Taxable loss
- −$1,595
- Est. tax savings @ 24.0%
- +$383
- After-tax cash flow
- $473/yr
For passive investors: Depreciation is non-cash, so a rental often shows a tax loss while cash-flowing — sheltering income. Rental losses are passive: they offset passive income freely, and up to $25,000/yr can offset ordinary (W-2) income if you actively participate and your MAGI is under $100k (phasing out to $0 by $150k); unused losses carry forward. On sale, claimed depreciation is recaptured at up to 25%, and gains may owe capital-gains tax (a 1031 exchange can defer both). Figures are a year-1 estimate at your 24.0% rate — not tax advice; consult a CPA.
Schools (NCES district)
- District
- Sloan-Hendrix School District
- NCES district ID
- 0512480
- Math proficiency
- 28% ▼ -6.00%
- Reading proficiency
- 28% ▼ -10.00%
- Median HH income
- $30,202
- Composite
- 22.66/100
- National rank
- #8048
- State rank
- #171 of 238 in AR
Livability — Ravenden
- Score
- 61/100
- State rank
- #241
- US rank
- #17868
Category grades
Schools grade is shown separately in the Schools card above.
Census & demographics
- Census place
- Ravenden, AR
- Population (ZIP)
- 1,351
Population outlook (Lawrence County) Hauer SSP2
- Today (2025)
- 15,453 people
- By 2030
- 14,697 · -4.9%
- By 2040
- 13,247 · -14.3%
- By 2050
- 11,937 · -22.8%
- By 2075
- 9,466 · -38.7%
- By 2100
- 7,441 · -51.8%
Race, ethnicity, and origin ACS 2023
- Neighborhood character
- Predominantly White (96%)
- Race & ethnicity
- White 96% Two or more races 3%
- Common ancestry
- Slovak 4% Lithuanian 2% Italian 1%
- Foreign-born
- 1%
- Languages at home
- 99% English-only · German/W. Germanic 1%
Political lean MEDSL · Lawrence
- 2024 margin
- Solid R (+64.0) · D 16.9% · R 81.0% · Other 2.1%
- 2008→2024 swing
- -43.1pp toward R · 2008: -20.9pp · 2024: -64.0pp
- All cycles
- 2024: R+64.0 2020: R+59.6 2016: R+49.8 2012: R+31.6 2008: R+20.9
Not yet ingested
- Civics
- —
Market trends
- HPI YoY
- —
- Current HPI
- —
- Rent YoY
- —
- Metro
- —
- State GDP YoY
- ▲ 3.80%
- F500 in state
- 10
Industry mix (Fortune 500 HQ in AR)
| Industry | F500 HQs | Revenue |
|---|---|---|
| Retail | 1 | $681B |
|
||
| Food / Agriculture | 1 | $53B |
|
||
| Retail / Energy | 1 | $22B |
|
||
| Transportation / Logistics | 1 | $12B |
|
||
| Energy | 1 | $4B |
|
||
Price history
+732.5% since first listed3 events — show timeline
- 2026-04-28 Pending — CARMLS
- 2026-04-02 Listed $99,900 CARMLS
- 1999-08-13 Sold (Public Records) $12,000 Public Records
Cash-flow waterfall
monthlySold comps — $/sqft
last 12 mo · ≤1 miLoading sold comps…