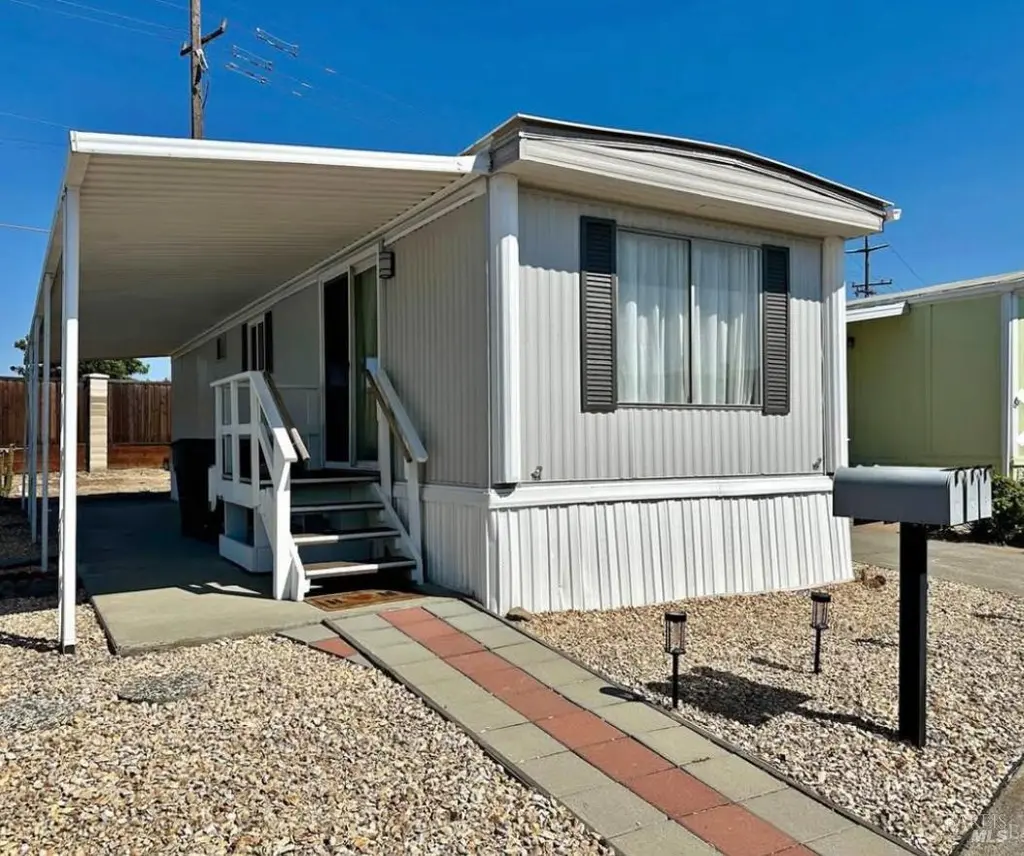
7 Geneseo St · Oakley, CA
Flood risk 4/10 · Minor
- FEMA flood zone
- X (unshaded)
- Chance of flooding over 30 yrs
- 0.22%
- Est. flood insurance / yr
- $507 – $1,088
Fire risk 5/10 · Moderate
- Est. fire insurance / yr
- $659 – $1,223
Heat risk 6/10 · Moderate
- Hot days now (above 101°F)
- 7 days/yr
- Hot days in 30 yrs
- 14 days/yr
Wind risk 1/10 · Minimal
- Chance of severe wind over 30 yrs
- —
Air-quality risk 9/10 · Severe
- Unhealthy air days now
- 17 days/yr
- Unhealthy air days in 30 yrs
- 18 days/yr
Risk factors via First Street. Map © Google.
Why this score? — see what drove the B+ grade
The composite is a weighted blend of 9 inputs, each scored 0–100. Each bar is that input's sub-score; the figure is the points it added to the 100-point composite (weight × sub-score).
- Cash flow +30.0/30.0
- ARV discount +15.0/15.0
- 1% rule +10.0/10.0
- DSCR +10.0/10.0
- Schools +3.8/10.0
- Rent growth +3.4/5.0
- Livability +3.0/5.0
- Condition / age +2.2/5.0
- Appreciation +0.0/10.0
$67,000
🖨 Deal sheet 📄 Offer letter ✓ Due diligence
Listing remarks
Finding affordable living in Northern California is getting harder and harder. That's why this upcoming Oakley 55+ community home is such a rare opportunity enjoy a comfortable lifestyle, community amenities, and lower maintenance home at a price point that is becoming harder to find in the Bay Area. This is perfect for someone ready to enjoy retirement with less stress and more freedom.
Key facts
- Parking
- Built 1972
- Listed 40 days
Property features AI
Finance
- Other: Park name: Eagle City Mobile home
- Financial info: Land lease amount: $900 (monthly)
- HOA & community: No association
Exterior
- Parking: 1 parking space
- Security: Carbon monoxide detector; Fire alarm
- Utilities: Cable available; Individual electric meter; Public sewer
- Home design: Manufactured in-park single wide; Biltmore make; Vinyl skirting; Located in a senior community
- Construction: Updated/remodeled
- Exterior features: Covered parking; Guest parking available; RV storage; Mobile home located in a park; Land lease in place
Interior
- Kitchen: Free standing gas oven; Free standing refrigerator
- Bedrooms: 1 bedroom
- Flooring: Laminate flooring
- Bathrooms: 1 full bathroom with tub/shower over
- Heating & cooling: Central heating; Central cooling
- Interior features: Updated/remodeled condition; Breakfast area; Dining/Family combo; Family room
- Laundry & utility: Washer and dryer included
Neighborhood map
What this means for you Summary
Snapshot
- This is a 1-bed/1.0-bath manufactured listed at $67k. Condition is rated fair.
Deal economics
- At list price, monthly cash flow is $1k ($14k/yr) — positive.
- The deal already cash-flows at list — no discount required.
- Meets the 1% rule at list price ($2k rent vs $67k).
- Recommended offer: $65k (3.0% below list) — sets the bar for market timing.
- Cap rate 26.6% vs local median 3.3% in Oakley — top-decile yield for the area; either an underpriced asset or a hidden risk that comps aren't pricing in. Stress-test before assuming the spread holds.
Location & tenants
- Location reads 60/100 on livability (#608 in CA) — a middle-class / working-renter tenant base. Strengths: employment A+, housing A+, crime A; Watch: schools D-, amenities F, commute F.
- Antioch Unified (suburban): math 29% / reading 55% proficiency, ranked #200 of 517 in CA (top 39%) — families likely to look elsewhere, expect single-tenant / working-renter base with shorter leases.
- Market conditions: Rents rising (+3.7%/yr); 234 active listings in the ZIP; 5 comparable units currently listed for rent nearby; rentals leasing fast (median 2d on market — plan ~1-2 weeks tenant-placement turnaround); high-income renter base; 2,169 units permitted in Contra Costa County in 2024 (896 in 5+ unit buildings).
- This rent is only 18% of the median local income ($135k/yr) — well below the 30% rent-burden line; pricing power to push rent on renewal without tenant pushback.
Forward outlook
- Local home prices are declining (-3.0%/yr); year-one equity from $463 of loan paydown is wiped out by about $2k of value loss. Plan a longer hold.
- Contra Costa County population projected at +26% by 2050 — long-run rental-demand tailwind backs the buy-and-hold thesis.
- At projected returns (-3.0% appreciation + 3.7% rent growth), your $19k cash investment doubles in ~2 years — after that, you're playing with house money.
Negotiation context
- It's been on market 41 days — a 3% lower offer ($65k) is reasonable based on typical stale-listing flexibility.
- 3 sale attempts with the ask held roughly flat each time — persistent listings suggest the price (not the market) is what's stuck; bring a comps-based counter.
Risks & watch-outs
- Climate carrying-cost: moderate wildfire risk; extreme-heat days projected 7→14/yr by 2055 (HVAC capex compounding) — expect insurance premiums to compound above CPI over the hold.
Questions for the listing agent
- It's been on market 41 days. Have you received any prior offers? Is the seller open to a 3% concession, seller financing, or rate buy-down credit?
- Have any recent inspections been done? Can we get a copy of the seller's disclosures and any deferred-maintenance estimates?
- Built in 1972 — when were the roof, HVAC, electrical panel, plumbing, and water heater last replaced?
- Is there a deadline driving the sale (1031 exchange, divorce, estate, relocation)? That informs how much negotiation room exists.
- Schools are D-rated, which usually means shorter tenancies and higher turnover. Who's the typical renter profile here, and what's been the actual vacancy rate?
- What's the average days-on-market for RENTAL listings here right now (not sales)? A rising rental-DOM trend means longer vacancies and softer asking-rent achievability than the comps imply.
- What's the recent tenant-quality profile in this submarket — average credit score on applications, eviction rate, late-payment / NSF rate, and stable-employment percentage? A property-management company in the area should have these aggregated.
- How much new for-sale + rental construction is in the pipeline within 1–3 miles? Heavy new supply typically softens prices + rents 12–24 months out; constrained supply supports both.
Investment metrics
- 1% rule
- 3.01% ✓
- Cap rate
- 26.57%
- Cash-on-cash
- 72.42%
- DSCR
- 4.22
- GRM
- 2.8
CMA / ARV
- ARV (median comp)
- $88,500
- List price
- $67,000
- Delta
- -24.29%
- Verdict
- UNDERPRICED
- Comps
- 7 within 1.0 mi
Show comp detail 5 sales within ~0.75 mi
| Address | Dist | Beds/Ba | Sqft | Sold | Price | $/sf | Match |
|---|---|---|---|---|---|---|---|
| 36 Cayuga St | 0.06mi | 2/1.5 (+1) | 756 (-10%) | 2mo | $86,625 | $115 | 72 |
| 99 Ottawa St | 0.09mi | 2/1.0 (+1) | 728 (-13%) | 3mo | $88,500 | $122 | 66 |
| 44 Cayuga | 0.09mi | 1/1.0 | 728 (-13%) | 10mo | $80,000 | $110 | 65 |
| 93 Ottawa St #93 | 0.05mi | 2/1.0 (+1) | 720 (-14%) | 21mo | $139,000 | $193 | 51 |
| 69 Oneida St | 0.10mi | 2/2.0 (+1) | 960 (+14%) | 21mo | $180,000 | $188 | 45 |
Match score weights: distance 35% · size 25% · config 20% · recency 20%. Top-matched comps best support the ARV.
Projected returns pro-forma
-3.0% appreciation · 3.68% rent growth · sell at horizon
- IRR
- 72.9%
- Equity multiple
- 4.34×
- Total profit
- $62,672
- Equity at exit
- $9,990
- IRR
- 76.9%
- Equity multiple
- 9.17×
- Total profit
- $153,335
- Equity at exit
- $5,793
Cash invested: $18,760 (down + closing). Projections, not guarantees.
Landlord ↔ Tenant lean methodology
- Overall (STATE)
- 18 Strongly Tenant-Friendly
- State California
- 18 Strongly Tenant-Friendly · D+13
- County
- — inherits STATE
- City
- — inherits STATE
ZIP-level market 94561
- Rents YoY
- 3.7%
- Active inventory
- 234
- Price-to-rent
- 2.8×
Monthly cashflow live
- Estimated rent
- $2,019 high interval (Pro) →
- Mortgage (P&I)
- −$351
- Tax est. 1.5%
- −$84 /mo · $1,005/yr
- Insurance
- −$28
- HOA
- −$0
- Vacancy / Maint / Mgmt
- −$424
- Net cashflow
- $1,132
Break-even live
UW: 25.0% down · 7.5% · 30yr · 1.5% tax · 5.0% vac · 8.0% maint · 8.0% mgmt
Financing live
Cash to close
- Down payment
- $16,750
- Closing costs
- $2,010
- Reserves months
- —
- Total cash needed
- —
Loan-product check · same deal, 3 products live
Conventional
25% down · 7.5% · 30yr
- Down + closing
- —
- Monthly P&I
- —
- Monthly cashflow
- —
- DSCR
- —
- Eligible?
- —
Personal DTI + credit; lowest rate.
DSCR
20% down · 8.5% · 30yr
- Down + closing
- —
- Monthly P&I
- —
- Monthly cashflow
- —
- DSCR
- —
- Eligible?
- —
No personal income docs; deal must DSCR.
Hard money
10% down · 12.0% · 12mo
- Down + closing
- —
- Monthly P&I
- —
- Monthly cashflow
- —
- DSCR
- —
- Eligible?
- —
Short-term bridge; refi at stabilization.
Rent comps 5 comps
| Address | Beds | Baths | Sqft | Rent | $/sqft | DOM | Units | Dist |
|---|---|---|---|---|---|---|---|---|
| 49 Carol Ln Oakley, CA | 1.0–3.0 | 1.0–2.0 | 686 | $1,787 | $2.60 | 1d | 1 | 0.29mi |
| 69 Carol Ln Oakley, CA | 1.0–3.0 | 1.0–2.0 | 802 | $1,660 | $2.07 | 1d | 9 | 0.32mi |
| 4290 Mehaffey Way Oakley, CA | 2.0 | 2.0 | 750 | $2,295 | $3.06 | 1d | 1 | 0.86mi |
| 3560 E 18th St Antioch, CA | 1.0–3.0 | 1.0–2.0 | 828 | $1,632 | $1.97 | 3d | 1 | 1.35mi |
| 3560 E 18th St Antioch, CA | 1.0–3.0 | 1.0–2.0 | 828 | $1,135 | $1.37 | 1d | 9 | 1.35mi |
Listing history 19 events
-
2026-06-18days on market $67,000 Active 41 DOM
-
2026-06-17days on market $67,000 Active 40 DOM
-
2026-06-16days on market $67,000 Active 39 DOM
-
2026-06-15days on market $67,000 Active 38 DOM
-
2026-06-13days on market $67,000 Active 36 DOM
-
2026-06-13days on market $67,000 Active 35 DOM
-
2026-06-09days on market $67,000 Active 32 DOM
-
2026-06-08days on market $67,000 Active 31 DOM
-
2026-06-07days on market $67,000 Active 30 DOM
-
2026-06-04days on market $67,000 Active 27 DOM
-
2026-06-03days on market $67,000 Active 26 DOM
-
2026-06-02days on market $67,000 Active 25 DOM
-
2026-06-01days on market $67,000 Active 24 DOM
-
2026-05-31days on market $67,000 Active 23 DOM
-
2026-05-07$67,000 Active 390-char remark
-
2026-01-07status Active
-
2026-01-07price $67,000
-
2025-10-22price $74,000
-
2025-08-29$77,000 Active
ⓘ Source: listings_history table (triggers on properties + properties_extension) + one-shot
backfill from property_details.listing_events for pre-trigger history.
Climate risk First Street
- Flood 4/10 Moderate FEMA zone X (unshaded) · 22% chance over 30 yrs
- Wildfire 5/10 Major
- Heat 6/10 Major 7 d/yr ≥101°F today · 14 d/yr by 30 yrs out
- Wind 1/10 Low
- Air quality 9/10 Extreme 17 unhealthy d/yr today · 18 by 30 yrs out
Nearby sold comps map
Loading sold comps map…
Walkable amenities ~0.75 mi
Loading nearby amenities…
Taxation est. · year 1
- Rental income
- $24,231
- − Mortgage interest
- −$3,753
- − Property taxes
- −$1,005
- − Insurance
- −$335
- − Repairs & maintenance
- −$1,938
- − Management
- −$1,938
- − Depreciation
- −$1,949
- Taxable income
- $13,312
- Est. tax owed @ 24.0%
- −$3,195
- After-tax cash flow
- $10,391/yr
For passive investors: Depreciation is non-cash, so a rental often shows a tax loss while cash-flowing — sheltering income. Rental losses are passive: they offset passive income freely, and up to $25,000/yr can offset ordinary (W-2) income if you actively participate and your MAGI is under $100k (phasing out to $0 by $150k); unused losses carry forward. On sale, claimed depreciation is recaptured at up to 25%, and gains may owe capital-gains tax (a 1031 exchange can defer both). Figures are a year-1 estimate at your 24.0% rate — not tax advice; consult a CPA.
Condition & rehab AI · 2 photos
This manufactured home requires significant exterior repairs and maintenance to improve its condition and value.
Repairs flagged
- Major exterior siding — Significant wear and tear
- Major exterior paint — Peeling and fading
- Major roof — Aged appearance
Value-add opportunities
- Both painting and repainting the exterior — Enhances curb appeal and value
- Both roof replacement — Improves structural integrity and aesthetic appeal
Renovation cost estimate screening
| Repair item | Severity | Est. cost |
|---|---|---|
| exterior siding · Significant wear and tear | Major | $15,000–50,000 |
| exterior paint · Peeling and fading | Major | $15,000–50,000 |
| roof · Aged appearance | Major | $15,000–50,000 |
| Total estimated repair cost · 3 items | $45,000–150,000 |
Value-add ROI direction
- Both painting and repainting the exterior — Enhances curb appeal and value ↑
- Both roof replacement — Improves structural integrity and aesthetic appeal ↑
ⓘ Cost ranges are severity-bucket heuristics (US national rule-of-thumb). Get contractor quotes + a written scope before underwriting a rehab budget.
Schools (NCES district)
- District
- Antioch Unified
- NCES district ID
- 0602850
- Math proficiency
- 29% ▲ 12.00%
- Reading proficiency
- 55% ▲ 25.00%
- Median HH income
- $65,935
- Composite
- 37.57/100
- National rank
- #4386
- State rank
- #200 of 517 in CA
Livability — Oakley
- Score
- 60/100
- State rank
- #608
- US rank
- #19421
Category grades
Schools grade is shown separately in the Schools card above.
Census & demographics
- Census place
- Oakley, CA
- County
- Contra Costa County · 1,059,880 people
- City population
- 46,368
- Metro
- San Francisco-Oakland-Berkeley, CA
- Population (ZIP)
- 46,368
- Household income
- $134,678
- Rent vs Own
- Severe rent burden
- 614.0
Population outlook (Contra Costa County) Hauer SSP2
- Today (2025)
- 1,287,720 people
- By 2030
- 1,364,937 · +6.0%
- By 2040
- 1,506,209 · +17.0%
- By 2050
- 1,624,373 · +26.1%
- By 2075
- 1,853,193 · +43.9%
- By 2100
- 1,901,231 · +47.6%
Race, ethnicity, and origin ACS 2023
- Neighborhood character
- Diverse neighborhood (Simpson 0.69)
- Race & ethnicity
- White 43% Hispanic / Latino 34% Two or more races 15% Asian 9% Black 9%
- Hispanic origin (detail)
- Mexican 25% Puerto Rican 1%
- Common ancestry
- Italian 2% Russian 2% Slovak 2%
- Foreign-born
- 18% · Canada, China
- Languages at home
- 70% English-only · Spanish 21% Tagalog/Filipino 4% Other Indo-European 3%
Political lean MEDSL · Contra Costa
- 2024 margin
- Solid D (+38.0) · D 67.3% · R 29.4% · Other 3.3%
- 2008→2024 swing
- +0.2pp no change · 2008: 37.8pp · 2024: 38.0pp
- All cycles
- 2024: D+38.0 2020: D+45.3 2016: D+43.5 2012: D+33.7 2008: D+37.8
Not yet ingested
- Civics
- —
Market trends
- HPI YoY
- ▼ -249.42%
- Current HPI
- 301.9916
- Rent YoY
- ▲ 3.68%
- Metro
- San Francisco-Oakland-Berkeley, CA
- State GDP YoY
- ▲ 3.21%
- F500 in state
- 116
Industry mix (Fortune 500 HQ in CA)
| Industry | F500 HQs | Revenue |
|---|---|---|
| Technology | 27 | $1,492B |
|
||
| Financial Services | 3 | $174B |
|
||
| Retail | 3 | $44B |
|
||
| Insurance | 3 | $26B |
|
||
| Media / Entertainment | 2 | $115B |
|
||
| Pharmaceuticals / Biotech | 2 | $62B |
|
||
Price history
-13.0% since first listed5 events — show timeline
- 2026-05-07 Listed $67,000 BAREIS
- 2026-01-07 Relisted — BAREIS
- 2026-01-07 Price Changed $67,000 BAREIS
- 2025-10-22 Price Changed $74,000 BAREIS
- 2025-08-29 Listed $77,000 BAREIS
Cash-flow waterfall
monthlySold comps — $/sqft
last 12 mo · ≤1 miLoading sold comps…