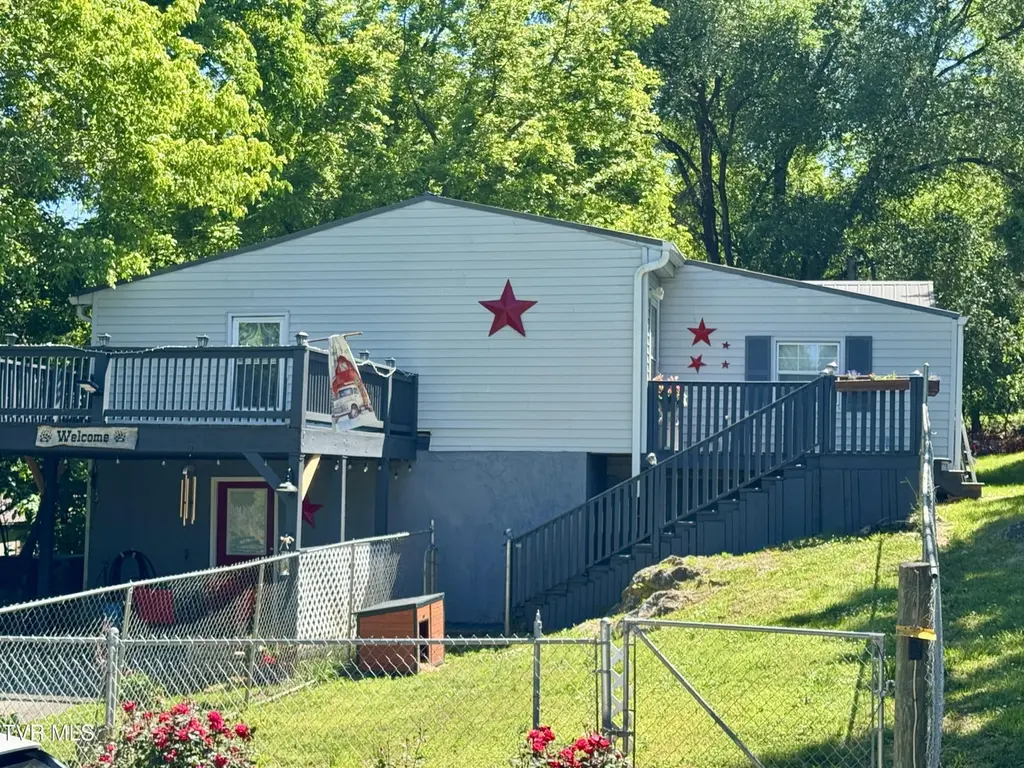
401 Minga Store Rd · Oak Grove, TN
Flood risk 1/10 · Minimal
- FEMA flood zone
- X (unshaded)
- Chance of flooding over 30 yrs
- 0.0%
- Est. flood insurance / yr
- $473 – $860
Fire risk 4/10 · Minor
- Est. fire insurance / yr
- $949 – $1,763
Heat risk 4/10 · Minor
- Hot days now (above 99°F)
- 7 days/yr
- Hot days in 30 yrs
- 20 days/yr
Wind risk 2/10 · Minimal
- Chance of severe wind over 30 yrs
- —
Air-quality risk 2/10 · Minimal
- Unhealthy air days now
- 1 days/yr
- Unhealthy air days in 30 yrs
- 2 days/yr
Risk factors via First Street. Map © Google.
Why this score? — see what drove the C- grade
The composite is a weighted blend of 9 inputs, each scored 0–100. Each bar is that input's sub-score; the figure is the points it added to the 100-point composite (weight × sub-score).
- Cash flow +17.2/30.0
- ARV discount +15.0/15.0
- DSCR +5.4/10.0
- 1% rule +3.4/10.0
- Livability +2.9/5.0
- Rent growth +2.5/5.0
- Condition / age +2.5/5.0
- Schools +1.8/10.0
- Appreciation +0.0/10.0
$204,900
🖨 Deal sheet 📄 Offer letter ✓ Due diligence
Listing remarks
Priced to sell now!! This inviting 3 bedroom home offers comfort, space, and an unbeatable location just a short walk from the beautiful Boone Lake. Whether you're seeking peaceful everyday living or a weekend retreat, this property delivers the perfect blend of convenience and tranquility. Sitting on a generous half-acre lot, the home features a welcoming covered porch ideal for morning coffee, evening relaxation, or hosting friends outdoors. Inside, you'll find a functional layout with 1 full bath and an additional half bath, plus an eat-in kitchen, walk-in closets, and a dedicated laundry room for everyday ease. The partially finished basement offers flexible space for a den, hobby room,
Key facts
- Covered porch
- In-law suite
- Half-acre lot
Tags
Property features AI
Finance
- Other: Zoning: A 1; Lot size: 0.34 acres (irregular)
Exterior
- Parking: Concrete parking
- Utilities: Public water; Septic tank; Cable available
- Home design: Single-family house; One level; Residential property; Facing information not provided
- Construction: Vinyl siding; Metal roof; Concrete perimeter foundation; Built-in below-grade finished area (336 sq ft) -- informational
- Exterior features: Covered patio/porch; Deck; Side porch; Shed(s); Sloped topography
Interior
- Kitchen: Refrigerator
- Bathrooms: 1 full bathroom; 1 half bathroom
- Heating & cooling: Central heating; Central air conditioning; Ceiling fan(s)
- Interior features: Double-pane windows; Basement (concrete)
- Laundry & utility: Washer; Dryer
Neighborhood map
What this means for you Summary
Snapshot
- This is a 3-bed/2.0-bath single-family listed at $205k.
Deal economics
- At list price, monthly cash flow is $147 ($2k/yr) — positive.
- The deal already cash-flows at list — no discount required.
- To meet the 1% rule (rent ≥ 1% of price), the offer needs to be $172k (15.9% below list).
- Recommended offer: $172k (15.9% below list) — sets the bar for 1% rule.
- Cap rate 7.2% vs local median 3.1% in Oak Grove — top-decile yield for the area; either an underpriced asset or a hidden risk that comps aren't pricing in. Stress-test before assuming the spread holds.
Location & tenants
- Location reads 58/100 on livability (#318 in TN) — a working-class tenant base; expect higher turnover. Strengths: cost of living A+, housing A; Watch: amenities F, commute F, employment D-.
- Sullivan County (suburban): math 17% / reading 24% proficiency, ranked #109 of 139 in TN (top 78%) — low school quality limits family demand, transient renter base, plan for 1-2y turnover.
- Zoned schools: Holston Elementary (math 37% / reading 32%, grade F, #319 of 952 statewide, top 37%, 635 students, 0% FRL); Sullivan East Middle School (math 8% / reading 11%, grade F, #260 of 333 statewide, top 79%, 573 students, 0% FRL); West Ridge High School (1,683 students, 0% FRL) — zoned schools average 0% FRL vs 45% district-wide (45 pts lower); this property's tenant base skews higher-income than the district average.
- Market conditions: 99 active listings in the ZIP; 7 comparable units currently listed for rent nearby; rentals at typical pace (median 21d on market — plan ~3-4 weeks tenant-placement turnaround); solid renter incomes; 453 units permitted in Sullivan County in 2024 (6 in 5+ unit buildings).
Forward outlook
- Local home prices are declining (-3.0%/yr); year-one equity from $1k of loan paydown is wiped out by about $6k of value loss. Plan a longer hold.
- Sullivan County population projected to shrink 5% by 2050 — rents likely to lag national; underwrite the cash flow, not the appreciation.
Negotiation context
- It's been on market 34 days — a 3% lower offer ($199k) is reasonable based on typical stale-listing flexibility.
- 4 sale attempts since 3y ago; this cycle's ask has dropped $15k (7%) from the opening price — seller is motivated, your offer sets the floor, not the list.
- Current owner paid $135k; list at $205k implies a 52% gain — meaningful room to come down on a strong offer.
Questions for the listing agent
- It's been on market 34 days. Have you received any prior offers? Is the seller open to a 16% concession, seller financing, or rate buy-down credit?
- Built in 1968 — when were the roof, HVAC, electrical panel, plumbing, and water heater last replaced?
- Is there a deadline driving the sale (1031 exchange, divorce, estate, relocation)? That informs how much negotiation room exists.
- Schools are F-rated, which usually means shorter tenancies and higher turnover. Who's the typical renter profile here, and what's been the actual vacancy rate?
- What's the average days-on-market for RENTAL listings here right now (not sales)? A rising rental-DOM trend means longer vacancies and softer asking-rent achievability than the comps imply.
- What's the recent tenant-quality profile in this submarket — average credit score on applications, eviction rate, late-payment / NSF rate, and stable-employment percentage? A property-management company in the area should have these aggregated.
- How much new for-sale + rental construction is in the pipeline within 1–3 miles? Heavy new supply typically softens prices + rents 12–24 months out; constrained supply supports both.
Investment metrics
- 1% rule
- 0.84% ✗
- Cap rate
- 7.15%
- Cash-on-cash
- 3.07%
- DSCR
- 1.14
- GRM
- 9.9
CMA / ARV
- ARV (median comp)
- $301,268
- List price
- $204,900
- Delta
- -31.99%
- Verdict
- UNDERPRICED
- Comps
- 8 within 1.0 mi
Projected returns pro-forma
-3.0% appreciation · 3.0% rent growth · sell at horizon
- IRR
- -11.5%
- Equity multiple
- 0.58×
- Total profit
- $-23,940
- Equity at exit
- $30,551
- IRR
- -2.4%
- Equity multiple
- 0.84×
- Total profit
- $-9,189
- Equity at exit
- $17,716
Cash invested: $57,372 (down + closing). Projections, not guarantees.
Landlord ↔ Tenant lean methodology
- Overall (STATE)
- 87 Strongly Landlord-Friendly
- State Tennessee
- 87 Strongly Landlord-Friendly · R+13
- County
- — inherits STATE
- City
- — inherits STATE
ZIP-level market 37663
- Home prices YoY
- -26.1%
- Active inventory
- 99
- Price-to-rent
- 9.9×
Monthly cashflow live
- Estimated rent
- $1,724 high interval (Pro) →
- Mortgage (P&I)
- −$1,075
- Tax from tax record
- −$55 /mo · $661/yr
- Insurance
- −$85
- HOA
- −$0
- Vacancy / Maint / Mgmt
- −$362
- Net cashflow
- $147
Break-even live
UW: 25.0% down · 7.5% · 30yr · 1.5% tax · 5.0% vac · 8.0% maint · 8.0% mgmt
Financing live
Cash to close
- Down payment
- $51,225
- Closing costs
- $6,147
- Reserves months
- —
- Total cash needed
- —
Loan-product check · same deal, 3 products live
Conventional
25% down · 7.5% · 30yr
- Down + closing
- —
- Monthly P&I
- —
- Monthly cashflow
- —
- DSCR
- —
- Eligible?
- —
Personal DTI + credit; lowest rate.
DSCR
20% down · 8.5% · 30yr
- Down + closing
- —
- Monthly P&I
- —
- Monthly cashflow
- —
- DSCR
- —
- Eligible?
- —
No personal income docs; deal must DSCR.
Hard money
10% down · 12.0% · 12mo
- Down + closing
- —
- Monthly P&I
- —
- Monthly cashflow
- —
- DSCR
- —
- Eligible?
- —
Short-term bridge; refi at stabilization.
Rent comps 7 comps
| Address | Beds | Baths | Sqft | Rent | $/sqft | DOM | Units | Dist |
|---|---|---|---|---|---|---|---|---|
| 392 Minga Rd Kingsport, TN | 3.0 | 1.0 | 1056 | $2,250 | $2.13 | 43d | 1 | 0.82mi |
| 516 Lakeside Dock Dr #6 Kingsport, TN | 2.0 | 1.5 | 1120 | $2,000 | $1.79 | 13d | 1 | 1.24mi |
| 148 Gray Station Rd #202 Johnson City, TN | 2.0 | 2.0 | 1200 | $1,225 | $1.02 | 20d | 1 | 1.30mi |
| 148 Gray Station Rd Johnson City, TN | 2.0 | 2.0 | 1200 | $1,185 | $0.99 | 13d | 2 | 1.33mi |
| 30 Hiddenbrook Ln Gray, TN | 3.0 | 2.5 | 1630 | $1,700 | $1.04 | 20d | 1 | 1.35mi |
| 194 Gray Station Rd #194 Johnson City, TN | 2.0 | 2.5 | 1224 | $1,500 | $1.23 | 20d | 1 | 1.45mi |
| 200 Gray Station Rd Johnson City, TN | 2.0 | 1.5 | 1224 | $1,200 | $0.98 | 20d | 1 | 1.46mi |
Listing history 28 events
-
2026-06-17status $204,900 Pending 34 DOM
-
2026-06-16days on market $204,900 Active 34 DOM
-
2026-06-15days on market $204,900 Active 33 DOM
-
2026-06-14days on market $204,900 Active 31 DOM
-
2026-06-13days on market $204,900 Active 30 DOM
-
2026-06-10days on market $204,900 Active 28 DOM
-
2026-06-09days on market $204,900 Active 27 DOM
-
2026-06-08days on market $204,900 Active 26 DOM
-
2026-06-07days on market $204,900 Active 25 DOM
-
2026-06-02days on market $204,900 Active 20 DOM
-
2026-06-01days on market $204,900 Active 19 DOM
-
2026-05-31days on market $204,900 Active 18 DOM
-
2026-05-30days on market $204,900 Active 17 DOM
-
2026-05-13$219,900 Active 967-char remark
-
2025-10-21price $205,000
-
2025-09-09price $219,000
-
2025-08-11$229,000 Active
-
2025-05-06price $249,000
-
2023-09-14soldstatus $135,000
-
2023-09-07soldstatus $135,000 Closed
-
2023-08-31historical Active Under Contract
-
2023-08-30status Active
-
2023-08-01historical
-
2023-07-30historical Active Under Contract
-
2023-07-27price $169,900
-
2023-07-14price $184,000
-
2023-06-22price $189,000
-
2023-06-16$195,000 Active
ⓘ Source: listings_history table (triggers on properties + properties_extension) + one-shot
backfill from property_details.listing_events for pre-trigger history.
Tax reassessment forecast TN · Resets to sale price
- Current annual tax
- $661 · $55/mo
- Projected year-2 tax
- $1,455 · $121/mo
- Expected delta
- +$794/yr (+$66/mo · 120.1%)
ⓘ Screening estimate from a state-policy table — verify with the county assessor before closing.
Climate risk First Street
- Flood 1/10 Low FEMA zone X (unshaded) · 0% chance over 30 yrs
- Wildfire 4/10 Moderate
- Heat 4/10 Moderate 7 d/yr ≥99°F today · 20 d/yr by 30 yrs out
- Wind 2/10 Low
- Air quality 2/10 Low 1 unhealthy d/yr today · 2 by 30 yrs out
Nearby sold comps map
Loading sold comps map…
Walkable amenities ~0.75 mi
Loading nearby amenities…
Taxation est. · year 1
- Rental income
- $20,688
- − Mortgage interest
- −$11,478
- − Property taxes
- −$661
- − Insurance
- −$1,024
- − Repairs & maintenance
- −$1,655
- − Management
- −$1,655
- − Depreciation
- −$5,961
- Taxable loss
- −$1,746
- Est. tax savings @ 24.0%
- +$419
- After-tax cash flow
- $2,183/yr
For passive investors: Depreciation is non-cash, so a rental often shows a tax loss while cash-flowing — sheltering income. Rental losses are passive: they offset passive income freely, and up to $25,000/yr can offset ordinary (W-2) income if you actively participate and your MAGI is under $100k (phasing out to $0 by $150k); unused losses carry forward. On sale, claimed depreciation is recaptured at up to 25%, and gains may owe capital-gains tax (a 1031 exchange can defer both). Figures are a year-1 estimate at your 24.0% rate — not tax advice; consult a CPA.
Schools (NCES district)
- District
- Sullivan County
- NCES district ID
- 4703990
- Math proficiency
- 17% ▼ -15.00%
- Reading proficiency
- 24% ▼ -10.00%
- Median HH income
- $43,263
- Composite
- 17.66/100
- National rank
- #9030
- State rank
- #109 of 139 in TN
Livability — Oak Grove
- Score
- 58/100
- State rank
- #318
- US rank
- #21531
Category grades
Schools grade is shown separately in the Schools card above.
Census & demographics
- County
- Sullivan County · 121,987 people
- Metro
- Kingsport-Bristol, TN-VA
- Population (ZIP)
- 14,230
- Household income
- $76,007
- Rent vs Own
- Severe rent burden
- 173.0
Population outlook (Sullivan County) Hauer SSP2
- Today (2025)
- 157,030 people
- By 2030
- 156,415 · -0.4%
- By 2040
- 153,778 · -2.1%
- By 2050
- 149,018 · -5.1%
- By 2075
- 138,068 · -12.1%
- By 2100
- 119,927 · -23.6%
Race, ethnicity, and origin ACS 2023
- Neighborhood character
- Predominantly White (94%)
- Race & ethnicity
- White 94% Two or more races 3% Asian 2% Hispanic / Latino 2%
- Common ancestry
- Serbian 5% Italian 2% Slovak 2%
- Foreign-born
- 3% · Canada
- Languages at home
- 97% English-only · Other Indo-European 1% Spanish 1%
Political lean MEDSL · Sullivan
- 2024 margin
- Solid R (+55.0) · D 22.0% · R 77.0% · Other 1.0%
- 2008→2024 swing
- -13.6pp toward R · 2008: -41.3pp · 2024: -55.0pp
- All cycles
- 2024: R+55.0 2020: R+51.9 2016: R+56.2 2012: R+47.2 2008: R+41.3
Not yet ingested
- Civics
- —
Market trends
- HPI YoY
- ▼ -90.38%
- Current HPI
- 255.7206
- Rent YoY
- —
- Metro
- Kingsport-Bristol, TN-VA
- State GDP YoY
- ▲ 2.78%
- F500 in state
- 22
Industry mix (Fortune 500 HQ in TN)
| Industry | F500 HQs | Revenue |
|---|---|---|
| Healthcare | 3 | $91B |
|
||
| Retail | 3 | $72B |
|
||
| Transportation / Logistics | 1 | $88B |
|
||
| Paper / Packaging | 1 | $19B |
|
||
| Insurance | 1 | $13B |
|
||
| Energy | 1 | $12B |
|
||
Price history
+5.1% since first listed17 events — show timeline
- 2026-06-16 Pending — TVRMLS
- 2026-05-27 Price Changed $204,900 TVRMLS
- 2026-05-13 Listed $219,900 TVRMLS
- 2025-10-21 Price Changed $205,000 GSMAR
- 2025-09-09 Price Changed $219,000 GSMAR
- 2025-08-11 Listed $229,000 GSMAR
- 2025-05-06 Price Changed $249,000 TVRMLS
- 2023-09-14 Sold (Public Records) $135,000 Public Records
- 2023-09-07 Sold (MLS) $135,000 TVRMLS
- 2023-08-31 Contingent — TVRMLS
- 2023-08-30 Relisted — TVRMLS
- 2023-08-01 Delisted — TVRMLS
- 2023-07-30 Contingent — TVRMLS
- 2023-07-27 Price Changed $169,900 TVRMLS
- 2023-07-14 Price Changed $184,000 TVRMLS
- 2023-06-22 Price Changed $189,000 TVRMLS
- 2023-06-16 Listed $195,000 TVRMLS
Property tax history
+5.2%/yrLatest (2025): $661 · +28.3% YoY. Source: county tax records.
Cash-flow waterfall
monthlySold comps — $/sqft
last 12 mo · ≤1 miLoading sold comps…