1800 Vista Cove Rd · St. Augustine, FL
Flood risk 8/10 · Major
- FEMA flood zone
- X (shaded)
- Chance of flooding over 30 yrs
- 0.92%
- Est. flood insurance / yr
- $507 – $1,088
Fire risk 2/10 · Minimal
- Est. fire insurance / yr
- $947 – $1,759
Heat risk 10/10 · Severe
- Hot days now (above 106°F)
- 7 days/yr
- Hot days in 30 yrs
- 20 days/yr
Wind risk 10/10 · Severe
- Chance of severe wind over 30 yrs
- 99.0%
Air-quality risk 3/10 · Minor
- Unhealthy air days now
- 3 days/yr
- Unhealthy air days in 30 yrs
- 3 days/yr
Risk factors via First Street. Map © Google.
Why this score? — see what drove the D grade
The composite is a weighted blend of 9 inputs, each scored 0–100. Each bar is that input's sub-score; the figure is the points it added to the 100-point composite (weight × sub-score).
- ARV discount +15.0/15.0
- Cash flow +7.7/30.0
- Schools +6.4/10.0
- 1% rule +4.2/10.0
- Rent growth +2.6/5.0
- Livability +2.5/5.0
- Condition / age +2.5/5.0
- DSCR +1.8/10.0
- Appreciation +0.0/10.0
$254,000
🖨 Deal sheet (PDF) 📄 Offer letter ✓ Due diligence
Listing remarks MLS
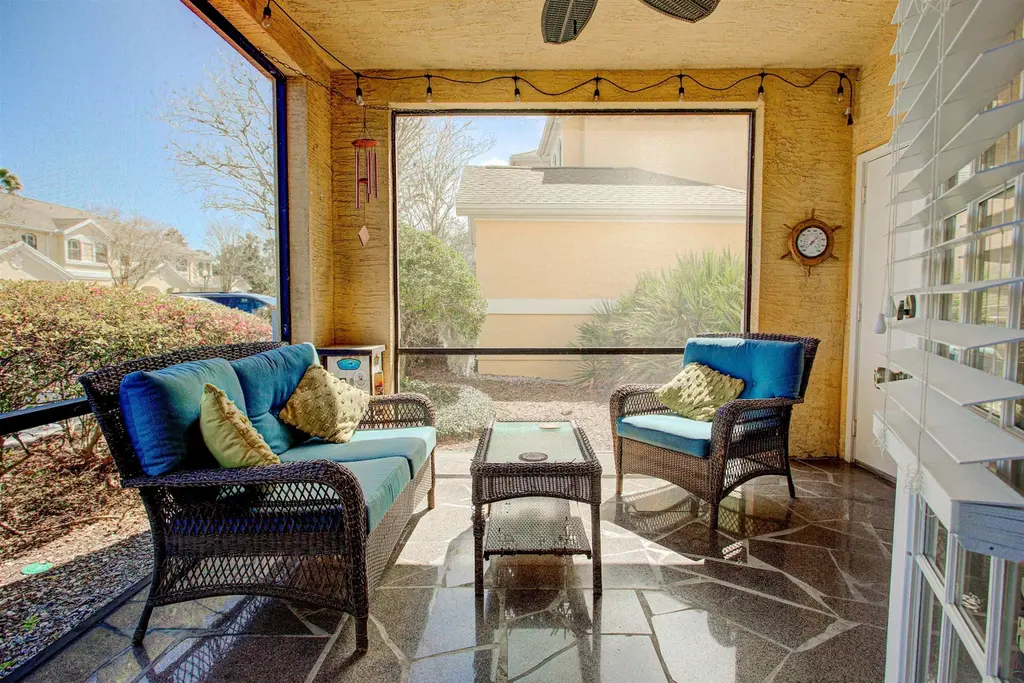
Riverfront Elegance at Vista Cove
Key facts
- Fishing pier
- Waterfront amenities
- Stone flooring
Tags
Neighborhood map
What this means for you Summary
Snapshot
- This is a 3-bed/2.0-bath condo listed at $254k.
Deal economics
- At list price, monthly cash flow is $-361 ($-4k/yr) — negative.
- To cash-flow at today's rent, offer at most $190k (25.1% below list).
- To meet the 1% rule (rent ≥ 1% of price), the offer needs to be $234k (7.8% below list).
- Recommended offer: $190k (25.1% below list) — sets the bar for cash-flow.
- Cap rate 4.9% vs local median 3.1% in St. Augustine — top-decile yield for the area; either an underpriced asset or a hidden risk that comps aren't pricing in. Stress-test before assuming the spread holds.
Location & tenants
- Location reads: area grade D — affects rentability + tenant quality, not the cash-flow math above.
- St. Johns (rural): math 75% / reading 73% proficiency, ranked #2 of 73 in FL (top 3%) — strong family-tenant draw, lease renewals of 3-5y typical; only 20% free/reduced lunch — higher-income household profile.
- Zoned schools: Crookshank Elementary School (math 64% / reading 62%, grade B, #582 of 2,144 statewide, top 28%, 704 students, 64% FRL); Sebastian Middle School (math 59% / reading 59%, grade B, #144 of 571 statewide, top 26%, 654 students, 42% FRL); St. Augustine High School (math 54% / reading 62%, grade C, #120 of 667 statewide, top 18%, 1,784 students, 38% FRL) — zoned schools average 48% FRL vs 20% district-wide (28 pts higher); higher-poverty schools than district average — tighter screening recommended.
- Zoned-school proficiency averages 60% at this address vs 74% district-wide (-14 pts) — the specific schools serving this property underperform the St. Johns average; the district grade overstates school quality for this exact location.
- Market conditions: Rents flat; 636 active listings in the ZIP; 39 comparable units currently listed for rent nearby; rentals at typical pace (median 14d on market — plan ~3-4 weeks tenant-placement turnaround); 5,575 units permitted in St. Johns County in 2024 (584 in 5+ unit buildings).
- This rent runs 38% of the median local income ($74k/yr) — at the standard rent-burdened threshold; future hikes will face affordability resistance.
Forward outlook
- Local home prices are declining (-3.0%/yr); year-one equity from $2k of loan paydown is wiped out by about $8k of value loss. Plan a longer hold.
- St. Johns County population projected at +60% by 2050 — long-run rental-demand tailwind backs the buy-and-hold thesis.
Negotiation context
- It's been on market 150 days — a 12% lower offer ($224k) is reasonable based on typical stale-listing flexibility.
- Current owner paid $113k; list at $254k implies a 125% gain — meaningful room to come down on a strong offer.
Risks & watch-outs
- Watch-outs: flood insurance adds $66/mo; HOA is 25% of rent.
- Climate carrying-cost: severe flood risk; severe wind risk, 99% chance of damaging wind over 30y; extreme-heat days projected 7→20/yr by 2055 (HVAC capex compounding) — expect insurance premiums to compound above CPI over the hold.
Questions for the listing agent
- What do current leases actually rent for vs. the listed asking? Can we see a recent rent roll and the last 12 months of T-12 income?
- It's been on market 150 days. Have you received any prior offers? Is the seller open to a 25% concession, seller financing, or rate buy-down credit?
- What's the actual annual flood-insurance premium (NFIP or private), and is the property in a SFHA with mandatory coverage?
- What does the HOA fee cover, when was the last increase, and are there any pending special assessments or reserve-fund shortfalls?
- Any open or pending special assessments — roof, HVAC, plumbing, elevator, façade? What's the per-unit balance and payoff schedule, and is the seller paying it off at close or rolling it to the buyer?
- Why hasn't it sold? Are there any deal-killer items the seller is aware of (foundation, flood, title, zoning, code violations)?
- Is there a deadline driving the sale (1031 exchange, divorce, estate, relocation)? That informs how much negotiation room exists.
- The area grade is low — what's the realistic commute time and amenity access for the typical tenant pool here? Any planned neighborhood developments (good or bad) we should know about?
- What's the average days-on-market for RENTAL listings here right now (not sales)? A rising rental-DOM trend means longer vacancies and softer asking-rent achievability than the comps imply.
- What's the recent tenant-quality profile in this submarket — average credit score on applications, eviction rate, late-payment / NSF rate, and stable-employment percentage? A property-management company in the area should have these aggregated.
- How much new apartment / multifamily construction is in the pipeline within 1–3 miles? Heavy new supply (>2% of stock underway) typically softens rents 12–24 months out; light construction supports rent growth.
Investment metrics
- 1% rule
- 0.92% ✗
- Cap rate
- 4.90%
- Cash-on-cash
- -4.98%
- DSCR
- 0.78
- GRM
- 9.0
CMA / ARV
- ARV (median comp)
- $309,108
- List price
- $254,000
- Delta
- -17.83%
- Verdict
- UNDERPRICED
- Comps
- 20 within 1.0 mi
Projected returns pro-forma
-3.0% appreciation · 0.25% rent growth · sell at horizon
- IRR
- -30.7%
- Equity multiple
- 0.01×
- Total profit
- $-70,173
- Equity at exit
- $37,872
- IRR
- -58.6%
- Equity multiple
- -0.60×
- Total profit
- $-113,964
- Equity at exit
- $21,961
Cash invested: $71,120 (down + closing). Projections, not guarantees.
Landlord ↔ Tenant lean methodology
- Overall (STATE)
- 87 Strongly Landlord-Friendly
- State Florida
- 87 Strongly Landlord-Friendly · R+3
- County
- — inherits STATE
- City
- — inherits STATE
ZIP-level market 32084
- Rents YoY
- 0.2%
- Active inventory
- 636
- Price-to-rent
- 9.0×
Monthly cashflow live
- Estimated rent
- $2,342 high interval (Pro) →
- Mortgage (P&I)
- −$1,332
- Tax from tax record
- −$129 /mo · $1,554/yr
- Insurance
- −$106
- Flood insurance flood zone
- −$66 /mo · $798/yr
- HOA
- −$578
- Vacancy / Maint / Mgmt
- −$492
- Net cashflow
- $-361
Break-even live
Sensitivity live
| Price | -10% $-218 | -5% $-290 | +0% $-361 | +5% $-433 | +10% $-505 |
|---|---|---|---|---|---|
| Rent | -10% $-547 | -5% $-454 | +0% $-361 | +5% $-269 | +10% $-176 |
| Rate | -1.0pp $-234 | -0.5pp $-297 | base $-361 | +0.5pp $-427 | +1.0pp $-494 |
UW: 25.0% down · 7.5% · 30yr · 1.5% tax · 5.0% vac · 8.0% maint · 8.0% mgmt
Financing live
Cash to close
- Down payment
- $63,500
- Closing costs
- $7,620
- Reserves months
- —
- Total cash needed
- —
Loan-product check · same deal, 3 products live
Conventional
25% down · 7.5% · 30yr
- Down + closing
- —
- Monthly P&I
- —
- Monthly cashflow
- —
- DSCR
- —
- Eligible?
- —
Personal DTI + credit; lowest rate.
DSCR
20% down · 8.5% · 30yr
- Down + closing
- —
- Monthly P&I
- —
- Monthly cashflow
- —
- DSCR
- —
- Eligible?
- —
No personal income docs; deal must DSCR.
Hard money
10% down · 12.0% · 12mo
- Down + closing
- —
- Monthly P&I
- —
- Monthly cashflow
- —
- DSCR
- —
- Eligible?
- —
Short-term bridge; refi at stabilization.
Rent comps 39 comps
| Address | Beds | Baths | Sqft | Rent | $/sqft | DOM | Units | Dist |
|---|---|---|---|---|---|---|---|---|
| 2231 Vista Cove Rd Saint Augustine, FL | 3.0 | 2.0 | 1448 | $2,000 | $1.38 | 12d | 1 | 0.06mi |
| 3425 Haley Pointe Rd St Augustine, FL | 3.0 | 2.0 | 1393 | $2,300 | $1.65 | 25d | 1 | 0.28mi |
| 232 Nesmith Ave Saint Augustine, FL | 4.0 | 2.0 | 1405 | $2,795 | $1.99 | 5d | 1 | 0.36mi |
| 228 Nesmith Ave Saint Augustine, FL | 2.0 | 2.0 | 1080 | $2,500 | $2.31 | 16d | 1 | 0.38mi |
| 177 Palmer St Unit B St. Augustine, FL | 2.0 | 1.0 | 900 | $1,350 | $1.50 | 25d | 1 | 0.39mi |
| 15 Grant St Saint Augustine, FL | 2.0 | 2.0 | 1092 | $1,999 | $1.83 | 25d | 1 | 0.44mi |
| 32 Grant St Saint Augustine, FL | 2.0 | 1.0 | 1064 | $1,775 | $1.67 | 5d | 1 | 0.47mi |
| 14 Sanchez Ave Apt A St. Augustine, FL | 2.0 | 1.0 | 915 | $2,000 | $2.19 | 25d | 1 | 0.51mi |
| 22 Fullerwood Dr Unit 1281988P St. Augustine, FL | 3.0 | 2.0 | 1700 | $4,200 | $2.47 | 9d | 1 | 0.65mi |
| 17 Old Mission Ave Unit 1281913P St. Augustine, FL | 3.0 | 2.5 | 1291 | $3,714 | $2.88 | 3d | 1 | 0.66mi |
| 27 Fullerwood Dr Saint Augustine, FL | 3.0 | 2.0 | 1229 | $4,900 | $3.99 | 3d | 1 | 0.66mi |
| 15 Old Mission Ave Unit 1281979P St. Augustine, FL | 2.0 | 2.0 | 1097 | $3,563 | $3.25 | 9d | 1 | 0.66mi |
| 116 San Marco Ave Unit 1281934P St. Augustine, FL | 1.0–2.0 | 1.0 | 920 | $4,325 | $4.70 | 9d | 2 | 0.68mi |
| 8 Park Ave Unit 1281965P St. Augustine, FL | 3.0 | 3.5 | 1442 | $4,937 | $3.42 | 14d | 1 | 0.70mi |
| 60 Masters Dr Unit C St. Augustine, FL | 2.0 | 1.5 | 900 | $1,300 | $1.44 | 25d | 1 | 0.74mi |
| 56 Masters Dr Unit D St. Augustine, FL | 2.0 | 1.5 | 900 | $1,300 | $1.44 | 25d | 1 | 0.76mi |
| 29 Masters Dr Unit B St. Augustine, FL | 3.0 | 2.0 | 1250 | $2,500 | $2.00 | 14d | 1 | 0.88mi |
| 289 W Jayce Way Saint Augustine, FL | 3.0 | 2.0 | 1102 | $1,851 | $1.68 | 15d | 1 | 0.93mi |
| 700 Hamilton Ave Saint Augustine, FL | 3.0 | 2.0 | 1302 | $2,035 | $1.56 | 5d | 1 | 0.95mi |
| 21 Pearl St Unit 1281964P St. Augustine, FL | 3.0 | 2.0 | 1130 | $7,100 | $6.28 | 4d | 1 | 0.96mi |
| 600 Francis St Saint Augustine, FL | 3.0 | 2.0 | 1280 | $2,495 | $1.95 | 5d | 1 | 0.98mi |
| 1005 Bella Vista Blvd #205 St. Augustine, FL | 2.0 | 2.0 | 1285 | $1,850 | $1.44 | 25d | 1 | 1.02mi |
| 68 Saragossa St Saint Augustine, FL | 3.0 | 2.0 | 1704 | $3,800 | $2.23 | 25d | 1 | 1.03mi |
| 1035 Bella Vista Blvd #122 St. Augustine, FL | 2.0 | 2.0 | 1212 | $1,850 | $1.53 | 25d | 1 | 1.03mi |
| 1080 Bella Vista Blvd St Augustine, FL | 2.0 | 2.0 | 1233 | $1,798 | $1.46 | 21d | 2 | 1.04mi |
| 1160 N Saint Johns St Saint Augustine, FL | 3.0 | 2.0 | 1426 | $1,900 | $1.33 | 9d | 1 | 1.05mi |
| 1080 Bella Vista Blvd #128 St. Augustine, FL | 2.0 | 2.0 | 1284 | $1,995 | $1.55 | 5d | 1 | 1.09mi |
| 4010 Grande Vista Blvd #118 St. Augustine, FL | 2.0 | 2.0 | 1212 | $1,595 | $1.32 | 25d | 1 | 1.10mi |
| 2781 Schaller Rd Saint Augustine, FL | 3.0 | 2.0 | 1294 | $1,895 | $1.46 | 25d | 1 | 1.15mi |
| 725 Flagler Crossing Dr Saint Augustine, FL | 1.0–3.0 | 1.0–2.0 | 1002 | $2,117 | $2.11 | 4d | 37 | 1.24mi |
| 138 Oviedo St Unit A St. Augustine, FL | 2.0 | 1.0 | 995 | $1,695 | $1.70 | 5d | 1 | 1.24mi |
| 3222 Harbor Dr Saint Augustine, FL | 2.0 | 2.0 | 1466 | $3,250 | $2.22 | 3d | 1 | 1.29mi |
| 520 Florida Club Blvd #104 Saint Augustine, FL | 2.0 | 2.0 | 1131 | $1,700 | $1.50 | 18d | 1 | 1.34mi |
| 510 Florida Club Blvd #101 Saint Augustine, FL | 3.0 | 2.0 | 1285 | $1,850 | $1.44 | 21d | 1 | 1.36mi |
| 3300 Lewis Speedway Saint Augustine, FL | 4.0 | 2.0 | 1700 | $2,850 | $1.68 | 25d | 1 | 1.44mi |
| 114 Cedar St Saint Augustine, FL | 4.0 | 3.0 | 1495 | $2,895 | $1.94 | 25d | 2 | 1.45mi |
| 114 Cedar St Unit 4 St. Augustine, FL | 4.0 | 3.0 | 1495 | $2,895 | $1.94 | 25d | 1 | 1.45mi |
| 104 Cedar St Unit 1281914P St. Augustine, FL | 3.0 | 2.0 | 1399 | $7,542 | $5.39 | 4d | 1 | 1.48mi |
| 100 Lasa Dr Saint Augustine, FL | 1.0–3.0 | 1.0–2.0 | 1013 | $1,959 | $1.93 | 4d | 46 | 1.49mi |
HOA detail condo
- Monthly dues
- $578 · $6,936/yr
- Assessments
- None detected in remarks — confirm with the listing agent.
Listing history 19 events
-
2026-06-21days on market $254,000 Active 150 DOM
-
2026-06-18days on market $254,000 Active 147 DOM
-
2026-06-17days on market $254,000 Active 146 DOM
-
2026-06-16days on market $254,000 Active 145 DOM
-
2026-06-15days on market $254,000 Active 144 DOM
-
2026-06-13days on market $254,000 Active 142 DOM
-
2026-06-13days on market $254,000 Active 141 DOM
-
2026-06-10days on market $254,000 Active 138 DOM
-
2026-06-08days on market $254,000 Active 137 DOM
-
2026-06-07days on market $254,000 Active 136 DOM
-
2026-06-03days on market $254,000 Active 132 DOM
-
2026-06-02days on market $254,000 Active 131 DOM
-
2026-06-01days on market $254,000 Active 130 DOM
-
2026-05-31days on market $254,000 Active 129 DOM
-
2026-04-14price $254,000 33-char remark
Show marketing remark (33 chars)
Riverfront Elegance at Vista Cove
-
2026-03-12price $269,000 33-char remark
Show marketing remark (33 chars)
Riverfront Elegance at Vista Cove
-
2026-02-24price $287,000 33-char remark
Show marketing remark (33 chars)
Riverfront Elegance at Vista Cove
-
2026-01-22$325,000 Active 33-char remark
Show marketing remark (33 chars)
Riverfront Elegance at Vista Cove
-
2011-09-08soldstatus $113,000
ⓘ Source: listings_history table (triggers on properties + properties_extension) + one-shot
backfill from property_details.listing_events for pre-trigger history.
Tax reassessment forecast FL · Resets to sale price
- Current annual tax
- $1,554 · $129/mo
- Projected year-2 tax
- $2,108 · $176/mo
- Expected delta
- +$554/yr (+$46/mo · 35.7%)
ⓘ Screening estimate from a state-policy table — verify with the county assessor before closing.
Climate risk First Street
- Flood 8/10 Severe FEMA zone X (shaded) · 92% chance over 30 yrs
- Wildfire 2/10 Low
- Heat 10/10 Extreme 7 d/yr ≥106°F today · 20 d/yr by 30 yrs out
- Wind 10/10 Extreme 99% chance of damaging wind over 30 yrs
- Air quality 3/10 Moderate 3 unhealthy d/yr today · 3 by 30 yrs out
Nearby sold comps map
Loading sold comps map…
Walkable amenities ~0.75 mi
Loading nearby amenities…
Taxation est. · year 1
- Rental income
- $28,106
- − Mortgage interest
- −$14,228
- − Property taxes
- −$1,554
- − Insurance
- −$2,068
- − Repairs & maintenance
- −$2,248
- − Management
- −$2,248
- − HOA
- −$6,936
- − Depreciation
- −$7,389
- Taxable loss
- −$8,565
- Est. tax savings @ 24.0%
- +$2,056
- After-tax cash flow
- $-2,282/yr
For passive investors: Depreciation is non-cash, so a rental often shows a tax loss while cash-flowing — sheltering income. Rental losses are passive: they offset passive income freely, and up to $25,000/yr can offset ordinary (W-2) income if you actively participate and your MAGI is under $100k (phasing out to $0 by $150k); unused losses carry forward. On sale, claimed depreciation is recaptured at up to 25%, and gains may owe capital-gains tax (a 1031 exchange can defer both). Figures are a year-1 estimate at your 24.0% rate — not tax advice; consult a CPA.
Schools (NCES district)
- District
- St. Johns
- NCES district ID
- 1201740
- Math proficiency
- 75% ▼ -5.00%
- Reading proficiency
- 73% ▼ -2.00%
- Median HH income
- $66,842
- Composite
- 64.31/100
- National rank
- #556
- State rank
- #2 of 73 in FL
Livability — St. Augustine
No livability data for this city. (Only ~50 U.S. cities are tracked.)
Census & demographics
- Census place
- St. Augustine, FL
- County
- Saint Johns County · 301,599 people
- Metro
- Jacksonville, FL
- Population (ZIP)
- 37,291
- Household income
- $73,837
- Rent vs Own
- Severe rent burden
- 1748.0
Population outlook (St. Johns County) Hauer SSP2
- Today (2025)
- 303,941 people
- By 2030
- 342,590 · +12.7%
- By 2040
- 417,328 · +37.3%
- By 2050
- 487,011 · +60.2%
- By 2075
- 635,395 · +109.1%
- By 2100
- 717,469 · +136.1%
Race, ethnicity, and origin ACS 2023
- Neighborhood character
- Predominantly White (73%)
- Race & ethnicity
- White 73% Hispanic / Latino 12% Black 11% Two or more races 8%
- Hispanic origin (detail)
- Mexican 2% Puerto Rican 4% Cuban 1%
- Common ancestry
- Lithuanian 3% Romanian 2% Slovak 2%
- Foreign-born
- 6% · Canada, Jamaica
- Languages at home
- 91% English-only · Spanish 6% Other Indo-European 1%
Political lean MEDSL · St. Johns
- 2024 margin
- Solid R (+31.4) · D 33.9% · R 65.2%
- 2008→2024 swing
- +0.2pp no change · 2008: -31.6pp · 2024: -31.4pp
- All cycles
- 2024: R+31.4 2020: R+26.7 2016: R+33.4 2012: R+37.8 2008: R+31.6
Not yet ingested
- Civics
- —
Market trends
- HPI YoY
- ▼ -287.02%
- Current HPI
- 330.9505
- Rent YoY
- ▲ 0.25%
- Metro
- Jacksonville, FL
- State GDP YoY
- ▲ 3.28%
- F500 in state
- 36
Industry mix (Fortune 500 HQ in FL)
| Industry | F500 HQs | Revenue |
|---|---|---|
| Industrial Technology | 2 | $29B |
|
||
| Insurance | 2 | $17B |
|
||
| Retail | 1 | $60B |
|
||
| Technology Distribution | 1 | $58B |
|
||
| Homebuilding | 1 | $35B |
|
||
| Technology Manufacturing | 1 | $35B |
|
||
Price history
+124.8% since first listed5 events — show timeline
- 2026-04-14 Price Changed $254,000 St. Augustine and St. Johns County Board of REALTORS®
- 2026-03-12 Price Changed $269,000 St. Augustine and St. Johns County Board of REALTORS®
- 2026-02-24 Price Changed $287,000 St. Augustine and St. Johns County Board of REALTORS®
- 2026-01-22 Listed $325,000 St. Augustine and St. Johns County Board of REALTORS®
- 2011-09-08 Sold (Public Records) $113,000 Public Records
Property tax history
+2.5%/yrLatest (2025): $1,554 · +9.3% YoY. Source: county tax records.
Cash-flow waterfall
monthlySold comps — $/sqft
last 12 mo · ≤1 miLoading sold comps…