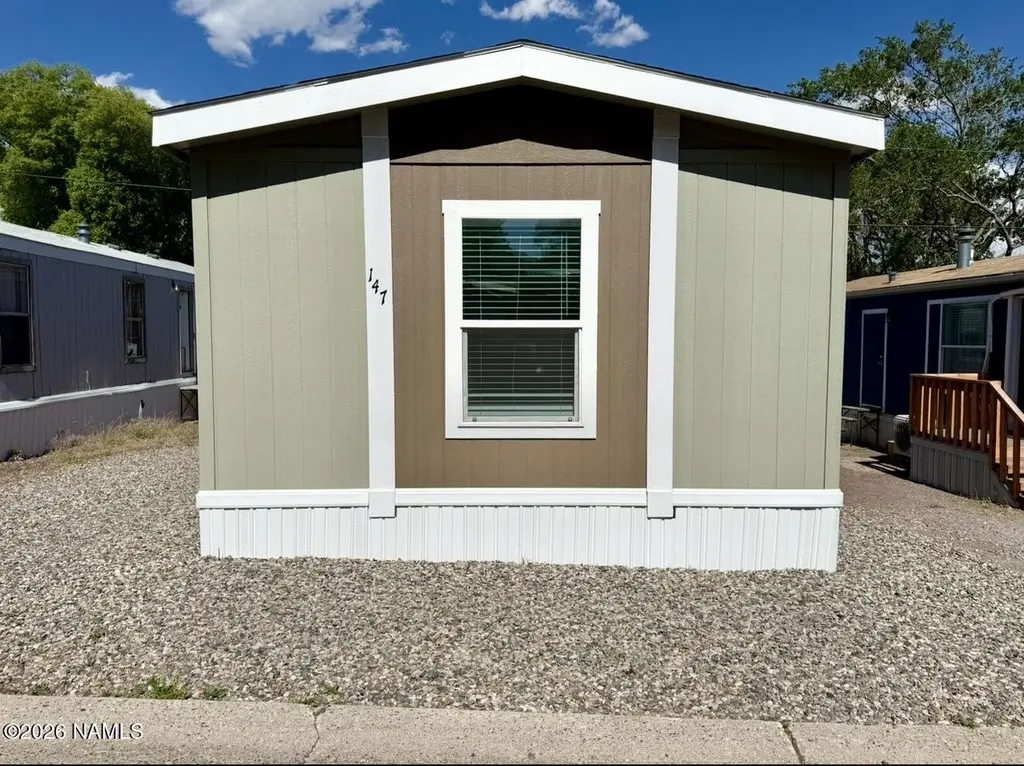
5250 N Us Highway 89 #147 · Flagstaff, AZ
Flood risk 1/10 · Minimal
- FEMA flood zone
- X (unshaded)
- Chance of flooding over 30 yrs
- 0.0%
- Est. flood insurance / yr
- $507 – $1,088
Fire risk 8/10 · Major
- Est. fire insurance / yr
- $610 – $1,132
Heat risk 2/10 · Minimal
- Hot days now (above 88°F)
- 6 days/yr
- Hot days in 30 yrs
- 16 days/yr
Wind risk 1/10 · Minimal
- Chance of severe wind over 30 yrs
- —
Air-quality risk 1/10 · Minimal
- Unhealthy air days now
- 0 days/yr
- Unhealthy air days in 30 yrs
- 0 days/yr
Risk factors via First Street. Map © Google.
Why this score? — see what drove the B grade
The composite is a weighted blend of 9 inputs, each scored 0–100. Each bar is that input's sub-score; the figure is the points it added to the 100-point composite (weight × sub-score).
- Cash flow +30.0/30.0
- 1% rule +10.0/10.0
- DSCR +10.0/10.0
- ARV discount +9.4/15.0
- Condition / age +4.0/5.0
- Livability +3.1/5.0
- Rent growth +2.9/5.0
- Schools +2.1/10.0
- Appreciation +0.0/10.0
$127,000
🖨 Deal sheet (PDF) 📄 Offer letter ✓ Due diligence
Listing remarks
Welcome home to this beautifully maintained 2023 manufactured home offering 2 bedrooms, 2 bathrooms, and a desirable split floor plan for added privacy. Designed with modern comfort in mind, this home features an open concept living area with abundant natural light, and attractive wood look flooring throughout. The spacious kitchen is the heart of the home, with a center island, ample cabinetry, and plenty of counter space for cooking and entertaining. The primary suite offers a private bath and comfortable retreat, while the secondary bedroom and full guest bath are located on the opposite side of the home. Enjoy contemporary finishes throughout, including neutral colors, recessed lighting
Key facts
- Built 2023
- Listed 16 days
Property features AI
Finance
- Other: Located in a mobile home park (land lease: yes)
- HOA & community: Has association; Community clubhouse
Exterior
- Security: Smoke detector(s)
- Utilities: Electricity available; Natural gas available; Cable available; Phone available
- Home design: Single wide mobile home
- Construction: Built as reported by county; Crawl space
- Exterior features: Level lot; Paved road; Private maintained road; Smoke detector(s)
Interior
- Kitchen: Gas Range
- Flooring: Laminate flooring
- Bathrooms: 2 bathrooms
- Heating & cooling: Natural gas heating; Central air conditioning; Ceiling fan(s)
- Interior features: Kitchen island; Satellite dish
- Laundry & utility: Laundry in hall
Neighborhood map
What this means for you Summary
Snapshot
- This is a 2-bed/2.0-bath manufactured listed at $127k. Condition is rated good.
Deal economics
- At list price, monthly cash flow is $924 ($11k/yr) — positive.
- The deal already cash-flows at list — no discount required.
- Meets the 1% rule at list price ($2k rent vs $127k).
- Recommended offer: $125k (1.5% below list) — sets the bar for market timing.
- Cap rate 15.0% vs local median 2.1% in Flagstaff — top-decile yield for the area; either an underpriced asset or a hidden risk that comps aren't pricing in. Stress-test before assuming the spread holds.
Location & tenants
- Location reads 61/100 on livability (#167 in AZ) — a middle-class / working-renter tenant base. Strengths: housing B; Watch: employment C-, crime D-, amenities F.
- Flagstaff Unified District (4192) (urban): math 18% / reading 29% proficiency, ranked #158 of 249 in AZ (top 64%) — low school quality limits family demand, transient renter base, plan for 1-2y turnover.
- Zoned schools: Weitzel'S Puente De Hozho Bilingual Magnet School (math 27% / reading 37%, grade F, #505 of 1,109 statewide, top 47%, 438 students, 42% FRL); Sinagua Middle School (math 12% / reading 22%, grade F, #147 of 218 statewide, top 69%, 1,016 students, 40% FRL); Coconino High School (math 12% / reading 17%, grade F, #267 of 381 statewide, top 72%, 1,528 students, 33% FRL) — zoned schools at 38% FRL track the district average.
- Market conditions: Rents rising (+1.6%/yr); 311 active listings in the ZIP; 8 comparable units currently listed for rent nearby; rentals lingering (median 46d on market — plan ~5-8 weeks vacancy on turnover, expect pricing pressure); 100% of comp listings sitting > 30 days — soft ceiling on asking rent; solid renter incomes; 698 units permitted in Coconino County in 2024 (354 in 5+ unit buildings).
- This rent runs 34% of the median local income ($81k/yr) — at the standard rent-burdened threshold; future hikes will face affordability resistance.
Forward outlook
- Local home prices are declining (-3.0%/yr); year-one equity from $878 of loan paydown is wiped out by about $4k of value loss. Plan a longer hold.
- Coconino County population projected at +20% by 2050 — long-run rental-demand tailwind backs the buy-and-hold thesis.
- At projected returns (-3.0% appreciation + 1.6% rent growth), your $36k cash investment doubles in ~5 years — after that, you're playing with house money.
Negotiation context
- It's been on market 17 days — a 2% lower offer ($125k) is reasonable based on typical stale-listing flexibility.
Risks & watch-outs
- Climate carrying-cost: severe wildfire risk — expect insurance premiums to compound above CPI over the hold.
Questions for the listing agent
- Is there a deadline driving the sale (1031 exchange, divorce, estate, relocation)? That informs how much negotiation room exists.
- Crime grade is D in this area — have there been break-ins, vandalism, or insurance claims at this property in the last 3 years? What carrier currently insures it and at what premium?
- What's the average days-on-market for RENTAL listings here right now (not sales)? A rising rental-DOM trend means longer vacancies and softer asking-rent achievability than the comps imply.
- What's the recent tenant-quality profile in this submarket — average credit score on applications, eviction rate, late-payment / NSF rate, and stable-employment percentage? A property-management company in the area should have these aggregated.
- How much new for-sale + rental construction is in the pipeline within 1–3 miles? Heavy new supply typically softens prices + rents 12–24 months out; constrained supply supports both.
Investment metrics
- 1% rule
- 1.80% ✓
- Cap rate
- 15.02%
- Cash-on-cash
- 31.16%
- DSCR
- 2.39
- GRM
- 4.6
CMA / ARV
- ARV (on-the-fly)
- $132,608
- Comps found
- 3
Show comp detail 3 sales within ~0.75 mi
| Address | Dist | Beds/Ba | Sqft | Sold | Price | $/sf | Match |
|---|---|---|---|---|---|---|---|
| 4940 E Dean Ave | 0.36mi | 2/1.0 | 912 (+2%) | 13mo | $135,000 | $148 | 65 |
| 5600 N Dakota #17 St #17 | 0.35mi | 3/2.0 (+1) | 960 (+7%) | 2mo | $106,500 | $111 | 65 |
| 4834 E Merriam Dr | 0.16mi | 3/2.0 (+1) | 972 (+8%) | 17mo | $373,000 | $384 | 59 |
Match score weights: distance 35% · size 25% · config 20% · recency 20%. Top-matched comps best support the ARV.
Projected returns pro-forma
-3.0% appreciation · 1.59% rent growth · sell at horizon
- IRR
- 24.4%
- Equity multiple
- 1.99×
- Total profit
- $35,084
- Equity at exit
- $18,936
- IRR
- 31.3%
- Equity multiple
- 3.64×
- Total profit
- $93,706
- Equity at exit
- $10,981
Cash invested: $35,560 (down + closing). Projections, not guarantees.
Landlord ↔ Tenant lean methodology
- Overall (STATE)
- 87 Strongly Landlord-Friendly
- State Arizona
- 87 Strongly Landlord-Friendly · R+3
- County
- — inherits STATE
- City
- — inherits STATE
ZIP-level market 86004
- Rents YoY
- 1.6%
- Active inventory
- 311
- Price-to-rent
- 4.6×
Monthly cashflow live
- Estimated rent
- $2,280 high interval (Pro) →
- Mortgage (P&I)
- −$666
- Tax est. 1.5%
- −$159 /mo · $1,905/yr
- Insurance
- −$53
- HOA
- −$0
- Vacancy / Maint / Mgmt
- −$479
- Net cashflow
- $924
Break-even live
Sensitivity live
| Price | -10% $1,011 | -5% $967 | +0% $924 | +5% $880 | +10% $836 |
|---|---|---|---|---|---|
| Rent | -10% $743 | -5% $833 | +0% $924 | +5% $1,014 | +10% $1,104 |
| Rate | -1.0pp $987 | -0.5pp $956 | base $924 | +0.5pp $891 | +1.0pp $857 |
UW: 25.0% down · 7.5% · 30yr · 1.5% tax · 5.0% vac · 8.0% maint · 8.0% mgmt
Financing live
Cash to close
- Down payment
- $31,750
- Closing costs
- $3,810
- Reserves months
- —
- Total cash needed
- —
Loan-product check · same deal, 3 products live
Conventional
25% down · 7.5% · 30yr
- Down + closing
- —
- Monthly P&I
- —
- Monthly cashflow
- —
- DSCR
- —
- Eligible?
- —
Personal DTI + credit; lowest rate.
DSCR
20% down · 8.5% · 30yr
- Down + closing
- —
- Monthly P&I
- —
- Monthly cashflow
- —
- DSCR
- —
- Eligible?
- —
No personal income docs; deal must DSCR.
Hard money
10% down · 12.0% · 12mo
- Down + closing
- —
- Monthly P&I
- —
- Monthly cashflow
- —
- DSCR
- —
- Eligible?
- —
Short-term bridge; refi at stabilization.
Rent comps 8 comps
| Address | Beds | Baths | Sqft | Rent | $/sqft | DOM | Units | Dist |
|---|---|---|---|---|---|---|---|---|
| 5000 N Mall Way Flagstaff, AZ | 1.0–2.0 | 1.0–2.0 | 880 | $2,299 | $2.61 | 45d | 7 | 0.11mi |
| 5404 E Cortland Blvd Flagstaff, AZ | 1.0–2.0 | 1.0–2.0 | 763 | $2,240 | $2.94 | 45d | 1 | 0.77mi |
| 5250 E Cortland Blvd Flagstaff, AZ | 1.0–2.0 | 1.0–2.0 | 731 | $2,160 | $2.95 | 45d | 1 | 0.88mi |
| 5303 E Cortland Blvd Flagstaff, AZ | 1.0–2.0 | 1.0–2.0 | 763 | $2,520 | $3.30 | 45d | 1 | 0.91mi |
| 5205 E Cortland Blvd Flagstaff, AZ | 1.0–2.0 | 1.0–1.5 | 712 | $2,162 | $3.03 | 45d | 16 | 1.06mi |
| 4343 E Soliere Ave Flagstaff, AZ | 1.0–3.0 | 1.0–2.0 | 1000 | $2,362 | $2.36 | 45d | 12 | 1.10mi |
| 4255 E Soliere Ave Flagstaff, AZ | 1.0–3.0 | 1.0–2.0 | 967 | $2,258 | $2.33 | 45d | 24 | 1.38mi |
| 4015 E Soliere Ave Flagstaff, AZ | 2.0 | 1.0–2.0 | 800 | $3,505 | $4.38 | 45d | 1 | 1.46mi |
Listing history 13 events
-
2026-06-21days on market $127,000 Active 17 DOM
-
2026-06-19days on market $127,000 Active 15 DOM
-
2026-06-18days on market $127,000 Active 14 DOM
-
2026-06-17days on market $127,000 Active 13 DOM
-
2026-06-16days on market $127,000 Active 12 DOM
-
2026-06-15days on market $127,000 Active 11 DOM
-
2026-06-14days on market $127,000 Active 9 DOM
-
2026-06-13days on market $127,000 Active 8 DOM
-
2026-06-10days on market $127,000 Active 6 DOM
-
2026-06-09days on market $127,000 Active 5 DOM
-
2026-06-08days on market $127,000 Active 4 DOM
-
2026-06-07remarks 699-char remark
-
2026-06-07$127,000 Active 3 DOM
ⓘ Source: listings_history table (triggers on properties + properties_extension) + one-shot
backfill from property_details.listing_events for pre-trigger history.
Climate risk First Street
- Flood 1/10 Low FEMA zone X (unshaded) · 0% chance over 30 yrs
- Wildfire 8/10 Severe
- Heat 2/10 Low 6 d/yr ≥88°F today · 16 d/yr by 30 yrs out
- Wind 1/10 Low
- Air quality 1/10 Low 0 unhealthy d/yr today · 0 by 30 yrs out
Nearby sold comps map
Loading sold comps map…
Walkable amenities ~0.75 mi
Loading nearby amenities…
Taxation est. · year 1
- Rental income
- $27,360
- − Mortgage interest
- −$7,114
- − Property taxes
- −$1,905
- − Insurance
- −$635
- − Repairs & maintenance
- −$2,189
- − Management
- −$2,189
- − Depreciation
- −$3,695
- Taxable income
- $9,634
- Est. tax owed @ 24.0%
- −$2,312
- After-tax cash flow
- $8,770/yr
For passive investors: Depreciation is non-cash, so a rental often shows a tax loss while cash-flowing — sheltering income. Rental losses are passive: they offset passive income freely, and up to $25,000/yr can offset ordinary (W-2) income if you actively participate and your MAGI is under $100k (phasing out to $0 by $150k); unused losses carry forward. On sale, claimed depreciation is recaptured at up to 25%, and gains may owe capital-gains tax (a 1031 exchange can defer both). Figures are a year-1 estimate at your 24.0% rate — not tax advice; consult a CPA.
Condition & rehab AI · 11 photos
This 2023 manufactured home is in good condition with modern updates and a good curb appeal. Minor cosmetic improvements can further enhance its value.
Value-add opportunities
- Both Paint exterior siding — Enhances curb appeal and value
- Both Replace ceiling fans — Improves air circulation and aesthetics
- Both Install smart home devices — Enhances convenience and energy efficiency
Renovation cost estimate screening
Value-add ROI direction
- Both Paint exterior siding — Enhances curb appeal and value ↑
- Both Replace ceiling fans — Improves air circulation and aesthetics ↑
- Both Install smart home devices — Enhances convenience and energy efficiency ↑
ⓘ Cost ranges are severity-bucket heuristics (US national rule-of-thumb). Get contractor quotes + a written scope before underwriting a rehab budget.
Schools (NCES district)
- District
- Flagstaff Unified District (4192)
- NCES district ID
- 0402860
- Math proficiency
- 18% ▼ -16.00%
- Reading proficiency
- 29% ▼ -10.00%
- Median HH income
- $53,510
- Composite
- 21.11/100
- National rank
- #8437
- State rank
- #158 of 249 in AZ
Livability — Flagstaff
- Score
- 61/100
- State rank
- #167
- US rank
- #18308
Category grades
Schools grade is shown separately in the Schools card above.
Census & demographics
- Census place
- Flagstaff, AZ
- County
- Coconino County · 91,667 people
- City population
- 91,667
- Metro
- Flagstaff, AZ
- Population (ZIP)
- 36,394
- Household income
- $81,172
- Rent vs Own
- Severe rent burden
- 1475.0
Population outlook (Coconino County) Hauer SSP2
- Today (2025)
- 150,645 people
- By 2030
- 156,857 · +4.1%
- By 2040
- 168,714 · +12.0%
- By 2050
- 181,082 · +20.2%
- By 2075
- 218,399 · +45.0%
- By 2100
- 238,853 · +58.6%
Race, ethnicity, and origin ACS 2023
- Neighborhood character
- Diverse neighborhood (Simpson 0.61)
- Race & ethnicity
- White 59% Hispanic / Latino 21% Two or more races 13% Native American 12% Asian 1% Black 1%
- Hispanic origin (detail)
- Mexican 15%
- Common ancestry
- Italian 4% Romanian 3% Slovak 2%
- Foreign-born
- 7% · Canada
- Languages at home
- 80% English-only · Spanish 12% German/W. Germanic 1% Other Asian/Pacific 1%
Political lean MEDSL · Coconino
- 2024 margin
- D (+19.9) · D 59.2% · R 39.4% · Other 1.4%
- 2008→2024 swing
- +2.9pp toward D · 2008: 17.0pp · 2024: 19.9pp
- All cycles
- 2024: D+19.9 2020: D+24.1 2016: D+19.4 2012: D+14.9 2008: D+17.0
Not yet ingested
- Civics
- —
Market trends
- HPI YoY
- ▼ -454.67%
- Current HPI
- 411.8577
- Rent YoY
- ▲ 1.59%
- Metro
- Flagstaff, AZ
- State GDP YoY
- ▲ 4.54%
- F500 in state
- 20
Industry mix (Fortune 500 HQ in AZ)
| Industry | F500 HQs | Revenue |
|---|---|---|
| Technology | 2 | $13B |
|
||
| Mining / Metals | 1 | $23B |
|
||
| Environmental Services | 1 | $16B |
|
||
| Metals / Steel | 1 | $14B |
|
||
| Technology Distribution | 1 | $9B |
|
||
| Homebuilding | 1 | $8B |
|
||
Price history
1 event — show timeline
- 2026-06-05 Listed $127,000 NAZMLS
Cash-flow waterfall
monthlySold comps — $/sqft
last 12 mo · ≤1 miLoading sold comps…