1405 S Trimble Rd · Stockton, MO
Flood risk 1/10 · Minimal
- FEMA flood zone
- X (unshaded)
- Chance of flooding over 30 yrs
- 0.0%
- Est. flood insurance / yr
- $507 – $1,088
Fire risk 4/10 · Minor
- Est. fire insurance / yr
- $1,054 – $1,958
Heat risk 5/10 · Moderate
- Hot days now (above 108°F)
- 7 days/yr
- Hot days in 30 yrs
- 19 days/yr
Wind risk 2/10 · Minimal
- Chance of severe wind over 30 yrs
- 1.0%
Air-quality risk 2/10 · Minimal
- Unhealthy air days now
- 1 days/yr
- Unhealthy air days in 30 yrs
- 1 days/yr
Risk factors via First Street. Map © Google.
Why this score? — see what drove the C+ grade
The composite is a weighted blend of 9 inputs, each scored 0–100. Each bar is that input's sub-score; the figure is the points it added to the 100-point composite (weight × sub-score).
- Cash flow +17.1/30.0
- ARV discount +15.0/15.0
- Appreciation +10.0/10.0
- DSCR +5.3/10.0
- Schools +3.9/10.0
- 1% rule +3.5/10.0
- Livability +3.1/5.0
- Rent growth +2.5/5.0
- Condition / age +2.5/5.0
$149,000
🖨 Deal sheet 📄 Offer letter ✓ Due diligence
Listing remarks MLS
Come see your next lake home! This well kept home sits on 4 city lots and is just down the road from the lake. The 1st boat ramp and beach is to the east and Orleans Trail is to the west. Take your pick! This home has a beautifully landscaped yard with a detached garage, shed, storm shelter and a small detached guest space. You will feel like you are in secluded woods while living in town
Key facts
- 0.31 acre lot
- 2 garage spots
- Built 1997
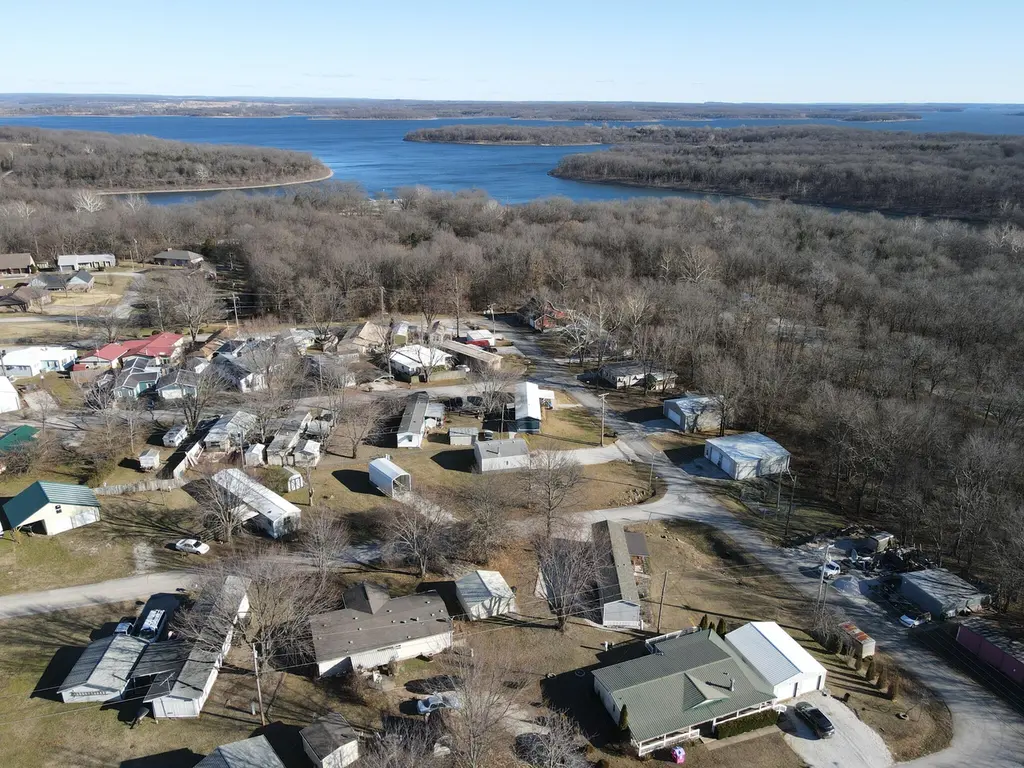
Neighborhood map
What this means for you Summary
Snapshot
- This is a 3-bed/2.0-bath single-family listed at $149k.
Deal economics
- At list price, monthly cash flow is $103 ($1k/yr) — positive.
- The deal already cash-flows at list — no discount required.
- To meet the 1% rule (rent ≥ 1% of price), the offer needs to be $127k (15.0% below list).
- Recommended offer: $127k (15.0% below list) — sets the bar for 1% rule.
- Cap rate 7.1% vs local median 3.5% in Stockton — top-decile yield for the area; either an underpriced asset or a hidden risk that comps aren't pricing in. Stress-test before assuming the spread holds.
Location & tenants
- Location reads 61/100 on livability (#456 in MO) — a middle-class / working-renter tenant base. Strengths: cost of living A+, crime A-, housing A-; Watch: amenities F, commute F, employment F.
- Stockton R-I (rural): math 45% / reading 50% proficiency, ranked #77 of 324 in MO (top 24%) — families likely to look elsewhere, expect single-tenant / working-renter base with shorter leases.
- Market conditions: 106 active listings in the ZIP; 4 units permitted in Cedar County in 2024 (0 in 5+ unit buildings).
Forward outlook
- In year one you build about $16k of equity ($1k loan paydown + $15k appreciation (10.0% local appreciation)).
- Cedar County population projected at -12% by 2050 — secular population decline; favor cash flow + early exit over multi-decade hold.
- At projected returns (10.0% appreciation + 3.0% rent growth), your $42k cash investment doubles in ~3 years — after that, you're playing with house money.
- By year 3, paydown + projected appreciation supports a ~$40k cash-out refi (75% LTV) — recoverable capital for the next deal without selling this one.
Negotiation context
- It's been on market 33 days — a 3% lower offer ($145k) is reasonable based on typical stale-listing flexibility.
- 3 sale attempts since 10y ago with the ask held roughly flat each time — persistent listings suggest the price (not the market) is what's stuck; bring a comps-based counter.
Risks & watch-outs
- Climate carrying-cost: extreme-heat days projected 7→19/yr by 2055 (HVAC capex compounding) — expect insurance premiums to compound above CPI over the hold.
Questions for the listing agent
- It's been on market 33 days. Have you received any prior offers? Is the seller open to a 15% concession, seller financing, or rate buy-down credit?
- Is there a deadline driving the sale (1031 exchange, divorce, estate, relocation)? That informs how much negotiation room exists.
- What's the average days-on-market for RENTAL listings here right now (not sales)? A rising rental-DOM trend means longer vacancies and softer asking-rent achievability than the comps imply.
- What's the recent tenant-quality profile in this submarket — average credit score on applications, eviction rate, late-payment / NSF rate, and stable-employment percentage? A property-management company in the area should have these aggregated.
- How much new for-sale + rental construction is in the pipeline within 1–3 miles? Heavy new supply typically softens prices + rents 12–24 months out; constrained supply supports both.
Investment metrics
- 1% rule
- 0.85% ✗
- Cap rate
- 7.12%
- Cash-on-cash
- 2.95%
- DSCR
- 1.13
- GRM
- 9.8
CMA / ARV
- ARV (median comp)
- $228,265
- List price
- $149,000
- Delta
- -34.73%
- Verdict
- UNDERPRICED
- Comps
- 20 within 1.0 mi
Show comp detail 6 sales within ~0.75 mi
| Address | Dist | Beds/Ba | Sqft | Sold | Price | $/sf | Match |
|---|---|---|---|---|---|---|---|
| 1308 Lakeview Cir | 0.15mi | 3/2.0 | 1,736 (+5%) | 8mo | $249,000 | $143 | 77 |
| 310 W Vern Ave | 0.49mi | 3/2.0 | 1,567 (-5%) | 11mo | $279,900 | $179 | 60 |
| 910 S Ward St | 0.52mi | 3/2.0 | 1,621 (-2%) | 21mo | $205,900 | $127 | 56 |
| 1315 Lakeview Cir | 0.12mi | 3/2.5 | 1,852 (+12%) | 23mo | $319,900 | $173 | 52 |
| 908 S Ward St | 0.53mi | 3/2.0 | 1,565 (-5%) | 22mo | $199,500 | $127 | 48 |
| 502 S Cherry St | 0.71mi | 3/2.0 | 1,849 (+12%) | 12mo | $254,900 | $138 | 36 |
Match score weights: distance 35% · size 25% · config 20% · recency 20%. Top-matched comps best support the ARV.
Projected returns pro-forma
10.0% appreciation · 3.0% rent growth · sell at horizon
- IRR
- 26.4%
- Equity multiple
- 3.10×
- Total profit
- $87,627
- Equity at exit
- $134,231
- IRR
- 23.1%
- Equity multiple
- 7.06×
- Total profit
- $252,782
- Equity at exit
- $289,474
Cash invested: $41,720 (down + closing). Projections, not guarantees.
Landlord ↔ Tenant lean methodology
- Overall (STATE)
- 81 Strongly Landlord-Friendly
- State Missouri
- 81 Strongly Landlord-Friendly · R+10
- County
- — inherits STATE
- City
- — inherits STATE
ZIP-level market 65785
- Home prices YoY
- 6.0%
- Active inventory
- 106
- Price-to-rent
- 9.8×
Monthly cashflow live
- Estimated rent
- $1,266 medium interval (Pro) →
- Mortgage (P&I)
- −$781
- Tax from tax record
- −$54 /mo · $651/yr
- Insurance
- −$62
- HOA
- −$0
- Vacancy / Maint / Mgmt
- −$266
- Net cashflow
- $103
Break-even live
UW: 25.0% down · 7.5% · 30yr · 1.5% tax · 5.0% vac · 8.0% maint · 8.0% mgmt
Financing live
Cash to close
- Down payment
- $37,250
- Closing costs
- $4,470
- Reserves months
- —
- Total cash needed
- —
Loan-product check · same deal, 3 products live
Conventional
25% down · 7.5% · 30yr
- Down + closing
- —
- Monthly P&I
- —
- Monthly cashflow
- —
- DSCR
- —
- Eligible?
- —
Personal DTI + credit; lowest rate.
DSCR
20% down · 8.5% · 30yr
- Down + closing
- —
- Monthly P&I
- —
- Monthly cashflow
- —
- DSCR
- —
- Eligible?
- —
No personal income docs; deal must DSCR.
Hard money
10% down · 12.0% · 12mo
- Down + closing
- —
- Monthly P&I
- —
- Monthly cashflow
- —
- DSCR
- —
- Eligible?
- —
Short-term bridge; refi at stabilization.
Listing history 6 events
-
2026-04-24$149,000 Active
-
2026-01-30price $160,000
-
2026-01-14$180,000 Active
-
2017-02-08soldstatus
-
2017-02-07soldstatus
Show marketing remark (391 chars)
Come see your next lake home! This well kept home sits on 4 city lots and is just down the road from the lake. The 1st boat ramp and beach is to the east and Orleans Trail is to the west. Take your pick! This home has a beautifully landscaped yard with a detached garage, shed, storm shelter and a small detached guest space. You will feel like you are in secluded woods while living in town
-
2016-09-15$59,000
Show marketing remark (391 chars)
Come see your next lake home! This well kept home sits on 4 city lots and is just down the road from the lake. The 1st boat ramp and beach is to the east and Orleans Trail is to the west. Take your pick! This home has a beautifully landscaped yard with a detached garage, shed, storm shelter and a small detached guest space. You will feel like you are in secluded woods while living in town
ⓘ Source: listings_history table (triggers on properties + properties_extension) + one-shot
backfill from property_details.listing_events for pre-trigger history.
Tax reassessment forecast MO · Resets to sale price
- Current annual tax
- $651 · $54/mo
- Projected year-2 tax
- $1,445 · $120/mo
- Expected delta
- +$794/yr (+$66/mo · 121.9%)
ⓘ Screening estimate from a state-policy table — verify with the county assessor before closing.
Climate risk First Street
- Flood 1/10 Low FEMA zone X (unshaded) · 0% chance over 30 yrs
- Wildfire 4/10 Moderate
- Heat 5/10 Major 7 d/yr ≥108°F today · 19 d/yr by 30 yrs out
- Wind 2/10 Low 100% chance of damaging wind over 30 yrs
- Air quality 2/10 Low 1 unhealthy d/yr today · 1 by 30 yrs out
Nearby sold comps map
Loading sold comps map…
Walkable amenities ~0.75 mi
Loading nearby amenities…
Taxation est. · year 1
- Rental income
- $15,196
- − Mortgage interest
- −$8,346
- − Property taxes
- −$651
- − Insurance
- −$745
- − Repairs & maintenance
- −$1,216
- − Management
- −$1,216
- − Depreciation
- −$4,335
- Taxable loss
- −$1,312
- Est. tax savings @ 24.0%
- +$315
- After-tax cash flow
- $1,547/yr
For passive investors: Depreciation is non-cash, so a rental often shows a tax loss while cash-flowing — sheltering income. Rental losses are passive: they offset passive income freely, and up to $25,000/yr can offset ordinary (W-2) income if you actively participate and your MAGI is under $100k (phasing out to $0 by $150k); unused losses carry forward. On sale, claimed depreciation is recaptured at up to 25%, and gains may owe capital-gains tax (a 1031 exchange can defer both). Figures are a year-1 estimate at your 24.0% rate — not tax advice; consult a CPA.
Schools (NCES district)
- District
- Stockton R-I
- NCES district ID
- 2929520
- Math proficiency
- 45% ▲ 2.00%
- Reading proficiency
- 50% ▼ -1.00%
- Median HH income
- $35,609
- Composite
- 39.32/100
- National rank
- #3989
- State rank
- #77 of 324 in MO
Livability — Stockton
- Score
- 61/100
- State rank
- #456
- US rank
- #18379
Category grades
Schools grade is shown separately in the Schools card above.
Census & demographics
- Census place
- Stockton, MO
- Population (ZIP)
- 5,538
Population outlook (Cedar County) Hauer SSP2
- Today (2025)
- 13,424 people
- By 2030
- 13,080 · -2.6%
- By 2040
- 12,434 · -7.4%
- By 2050
- 11,841 · -11.8%
- By 2075
- 10,171 · -24.2%
- By 2100
- 7,744 · -42.3%
Race, ethnicity, and origin ACS 2023
- Neighborhood character
- Predominantly White (92%)
- Race & ethnicity
- White 92% Two or more races 4% Hispanic / Latino 3%
- Common ancestry
- Italian 4% Lithuanian 2% Serbian 2%
- Foreign-born
- 1% · Canada
- Languages at home
- 96% English-only · Spanish 1% Other Indo-European 1% German/W. Germanic 1%
Political lean MEDSL · Cedar
- 2024 margin
- Solid R (+69.6) · D 14.8% · R 84.4%
- 2008→2024 swing
- -36.0pp toward R · 2008: -33.6pp · 2024: -69.6pp
- All cycles
- 2024: R+69.6 2020: R+65.9 2016: R+63.9 2012: R+47.0 2008: R+33.6
Not yet ingested
- Civics
- —
Market trends
- HPI YoY
- ▲ 16.72%
- Current HPI
- 293.8984
- Rent YoY
- —
- Metro
- —
- State GDP YoY
- ▲ 1.84%
- F500 in state
- 20
Industry mix (Fortune 500 HQ in MO)
| Industry | F500 HQs | Revenue |
|---|---|---|
| Healthcare | 1 | $163B |
|
||
| Insurance | 1 | $21B |
|
||
| Industrial Technology | 1 | $17B |
|
||
| Retail | 1 | $16B |
|
||
| Industrial Distribution | 1 | $10B |
|
||
| Utilities | 1 | $9B |
|
||
Price history
+152.5% since first listed6 events — show timeline
- 2026-04-24 Listed $149,000 SOMO
- 2026-01-30 Price Changed $160,000 SOMO
- 2026-01-14 Listed $180,000 SOMO
- 2017-02-08 Sold (Public Records) — Public Records
- 2017-02-07 Sold (MLS) — SOMO
- 2016-09-15 Listed $59,000 SOMO
Property tax history
+3.0%/yrLatest (2025): $651 · +7.4% YoY. Source: county tax records.
Cash-flow waterfall
monthlySold comps — $/sqft
last 12 mo · ≤1 miLoading sold comps…