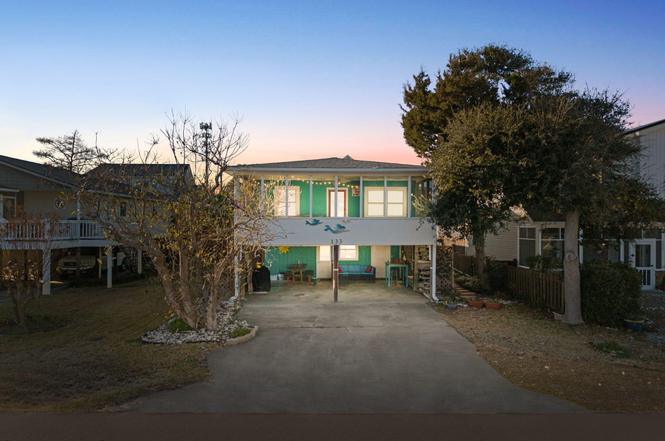
133 Fourth Ave N · Kure Beach, NC
Flood risk 1/10 · Minimal
- FEMA flood zone
- X (unshaded)
- Chance of flooding over 30 yrs
- 0.0%
- Est. flood insurance / yr
- $507 – $1,088
Fire risk 3/10 · Minor
- Est. fire insurance / yr
- $906 – $1,684
Heat risk 10/10 · Severe
- Hot days now (above 104°F)
- 7 days/yr
- Hot days in 30 yrs
- 19 days/yr
Wind risk 9/10 · Severe
- Chance of severe wind over 30 yrs
- 99.0%
Air-quality risk 2/10 · Minimal
- Unhealthy air days now
- 1 days/yr
- Unhealthy air days in 30 yrs
- 1 days/yr
Risk factors via First Street. Map © Google.
Why this score? — see what drove the F grade
The composite is a weighted blend of 9 inputs, each scored 0–100. Each bar is that input's sub-score; the figure is the points it added to the 100-point composite (weight × sub-score).
- Schools +4.3/10.0
- Livability +3.2/5.0
- Cash flow +3.1/30.0
- Rent growth +2.5/5.0
- Condition / age +2.5/5.0
- 1% rule +0.0/10.0
- DSCR +0.0/10.0
- ARV discount +0.0/15.0
- Appreciation +0.0/10.0
$747,500
🖨 Deal sheet (PDF) 📄 Offer letter ✓ Due diligence
Listing remarks MLS
Great location in in.Old Kure Beach in., walk 3 blocks to Downtown. Or enjoy pier/ocean views from rooftop deck! Multi-family potential with 2 existing kitchens. Nice remodel - add a floor for ocean views, has existing elevator. Lush landscaping, private back yard. Not in Flood Zone.
Key facts
- 5,009 sq ft lot
- Garage
- Built 1965
Property features AI
Finance
- Other: Zoning: RA-2
Exterior
- Parking: Attached covered parking/garage
- Security: Smoke detector(s)
- Utilities: Sewer connected; Water connected
- Home design: Residential single-family home; Two levels
- Construction: Built with block, asbestos, wood siding, and frame materials; Shingle roof; Block/raised/pillar-post-pier foundation
- Exterior features: Covered, enclosed, and screened patio; Patio; Interior lot; City street and state road frontage; Has view
Interior
- Kitchen: Electric oven; Electric cooktop; Refrigerator
- Bedrooms: Total rooms: 8
- Flooring: Tile flooring
- Bathrooms: 2 full bathrooms
- Heating & cooling: Heat pump; Baseboard heating; Electric heating; Cooling via heat pump and other systems
- Interior features: Elevator installed; Ceiling fan(s); Window coverings; Negotiable furnished status; Smoke detector(s)
- Laundry & utility: Washer (hookup available); Dryer; Electric water heater; Washer hookup
Neighborhood map
What this means for you Summary
Snapshot
- This is a 3-bed/2.0-bath single-family listed at $748k.
Deal economics
- At list price, monthly cash flow is $-2k ($-29k/yr) — negative.
- To cash-flow at today's rent, offer at most $324k (56.6% below list).
- To meet the 1% rule (rent ≥ 1% of price), the offer needs to be $250k (66.6% below list).
- Recommended offer: $250k (66.6% below list) — sets the bar for 1% rule.
Location & tenants
- Location reads 65/100 on livability (#303 in NC) — a middle-class / working-renter tenant base. Strengths: crime A+, employment A+, housing A; Watch: health & safety D, amenities F, commute F.
- New Hanover County Schools (urban): math 48% / reading 53% proficiency, ranked #61 of 178 in NC (top 34%) — acceptable for families but not a draw, mixed tenant base, ~2y average lease.
- Zoned schools: Carolina Beach Elementary (math 55% / reading 59%, grade C+, #249 of 1,410 statewide, top 20%, 431 students, 32% FRL); Charles P Murray Middle (math 59% / reading 59%, grade B, #54 of 475 statewide, top 12%, 882 students, 34% FRL); Eugene Ashley High (math 48% / reading 68%, grade C, #243 of 535 statewide, top 46%, 1,975 students, 34% FRL).
- Market conditions: 94 active listings in the ZIP; 1 comparable units currently listed for rent nearby; 2,581 units permitted in New Hanover County in 2024 (1,185 in 5+ unit buildings).
Forward outlook
- Local home prices are declining (-3.0%/yr); year-one equity from $5k of loan paydown is wiped out by about $22k of value loss. Plan a longer hold.
- New Hanover County population projected at +37% by 2050 — long-run rental-demand tailwind backs the buy-and-hold thesis.
Negotiation context
- It's been on market 152 days — a 12% lower offer ($658k) is reasonable based on typical stale-listing flexibility.
- 5 sale attempts since 20y ago; this cycle's ask has dropped $48k (6%) from the opening price — seller is motivated, your offer sets the floor, not the list.
- Current owner paid $295k; list at $748k implies a 153% gain — meaningful room to come down on a strong offer.
Risks & watch-outs
- Climate carrying-cost: severe wind risk, 99% chance of damaging wind over 30y; extreme-heat days projected 7→19/yr by 2055 (HVAC capex compounding) — expect insurance premiums to compound above CPI over the hold.
Questions for the listing agent
- What do current leases actually rent for vs. the listed asking? Can we see a recent rent roll and the last 12 months of T-12 income?
- It's been on market 152 days. Have you received any prior offers? Is the seller open to a 67% concession, seller financing, or rate buy-down credit?
- Built in 1965 — when were the roof, HVAC, electrical panel, plumbing, and water heater last replaced?
- Why hasn't it sold? Are there any deal-killer items the seller is aware of (foundation, flood, title, zoning, code violations)?
- Is there a deadline driving the sale (1031 exchange, divorce, estate, relocation)? That informs how much negotiation room exists.
- Schools are D-rated, which usually means shorter tenancies and higher turnover. Who's the typical renter profile here, and what's been the actual vacancy rate?
- The area grade is low — what's the realistic commute time and amenity access for the typical tenant pool here? Any planned neighborhood developments (good or bad) we should know about?
- What's the average days-on-market for RENTAL listings here right now (not sales)? A rising rental-DOM trend means longer vacancies and softer asking-rent achievability than the comps imply.
- What's the recent tenant-quality profile in this submarket — average credit score on applications, eviction rate, late-payment / NSF rate, and stable-employment percentage? A property-management company in the area should have these aggregated.
- How much new for-sale + rental construction is in the pipeline within 1–3 miles? Heavy new supply typically softens prices + rents 12–24 months out; constrained supply supports both.
Investment metrics
- 1% rule
- 0.33% ✗
- Cap rate
- 2.45%
- Cash-on-cash
- -13.74%
- DSCR
- 0.39
- GRM
- 24.9
CMA / ARV
- ARV (on-the-fly)
- $579,348
- Comps found
- 5
Show comp detail 5 sales within ~0.75 mi
| Address | Dist | Beds/Ba | Sqft | Sold | Price | $/sf | Match |
|---|---|---|---|---|---|---|---|
| 513 K Ave | 0.12mi | 3/2.0 | 1,637 (-3%) | 17mo | $560,000 | $342 | 74 |
| 516 N Fifth Ave N | 0.23mi | 3/2.0 | 1,901 (+12%) | 16mo | $650,000 | $342 | 56 |
| 417 Settlers Ln | 0.34mi | 3/2.0 | 1,485 (-12%) | 10mo | $578,000 | $389 | 55 |
| 734 Sloop Pointe Ln | 0.70mi | 3/2.0 | 1,523 (-10%) | 6mo | $515,000 | $338 | 46 |
| 630 S Fourth Ave | 0.71mi | 4/2.0 (+1) | 1,815 (+7%) | 7mo | $765,000 | $421 | 44 |
Match score weights: distance 35% · size 25% · config 20% · recency 20%. Top-matched comps best support the ARV.
Projected returns pro-forma
-3.0% appreciation · 3.0% rent growth · sell at horizon
- IRR
- -42.4%
- Equity multiple
- -0.31×
- Total profit
- $-274,165
- Equity at exit
- $111,455
- IRR
- -73.3%
- Equity multiple
- -1.09×
- Total profit
- $-437,049
- Equity at exit
- $64,630
Cash invested: $209,300 (down + closing). Projections, not guarantees.
Landlord ↔ Tenant lean methodology
- Overall (STATE)
- 85 Strongly Landlord-Friendly
- State North Carolina
- 85 Strongly Landlord-Friendly · R+3
- County
- — inherits STATE
- City
- — inherits STATE
ZIP-level market 28449
- Active inventory
- 94
- Price-to-rent
- 24.9×
Monthly cashflow live
- Estimated rent
- $2,500 medium interval (Pro) →
- Mortgage (P&I)
- −$3,920
- Tax from tax record
- −$139 /mo · $1,672/yr
- Insurance
- −$311
- HOA
- −$0
- Vacancy / Maint / Mgmt
- −$525
- Net cashflow
- $-2,396
Break-even live
Sensitivity live
| Price | -10% $-1,973 | -5% $-2,184 | +0% $-2,396 | +5% $-2,607 | +10% $-2,819 |
|---|---|---|---|---|---|
| Rent | -10% $-2,593 | -5% $-2,494 | +0% $-2,396 | +5% $-2,297 | +10% $-2,198 |
| Rate | -1.0pp $-2,019 | -0.5pp $-2,206 | base $-2,396 | +0.5pp $-2,589 | +1.0pp $-2,786 |
UW: 25.0% down · 7.5% · 30yr · 1.5% tax · 5.0% vac · 8.0% maint · 8.0% mgmt
Financing live
Cash to close
- Down payment
- $186,875
- Closing costs
- $22,425
- Reserves months
- —
- Total cash needed
- —
Loan-product check · same deal, 3 products live
Conventional
25% down · 7.5% · 30yr
- Down + closing
- —
- Monthly P&I
- —
- Monthly cashflow
- —
- DSCR
- —
- Eligible?
- —
Personal DTI + credit; lowest rate.
DSCR
20% down · 8.5% · 30yr
- Down + closing
- —
- Monthly P&I
- —
- Monthly cashflow
- —
- DSCR
- —
- Eligible?
- —
No personal income docs; deal must DSCR.
Hard money
10% down · 12.0% · 12mo
- Down + closing
- —
- Monthly P&I
- —
- Monthly cashflow
- —
- DSCR
- —
- Eligible?
- —
Short-term bridge; refi at stabilization.
Rent comps 1 comps
| Address | Beds | Baths | Sqft | Rent | $/sqft | DOM | Units | Dist |
|---|---|---|---|---|---|---|---|---|
| 1606 Bonito Ln Carolina Beach, NC | 3.0 | 2.0 | 1100 | $2,500 | $2.27 | 22d | 1 | 1.13mi |
Listing history 29 events
-
2026-06-21days on market $747,500 Active 152 DOM
-
2026-06-18days on market $747,500 Active 149 DOM
-
2026-06-17days on market $747,500 Active 148 DOM
-
2026-06-16days on market $747,500 Active 147 DOM
-
2026-06-15days on market $747,500 Active 146 DOM
-
2026-06-14days on market $747,500 Active 144 DOM
-
2026-06-13days on market $747,500 Active 143 DOM
-
2026-06-10days on market $747,500 Active 141 DOM
-
2026-06-09days on market $747,500 Active 140 DOM
-
2026-06-08days on market $747,500 Active 139 DOM
-
2026-06-07days on market $747,500 Active 138 DOM
-
2026-06-05days on market $747,500 Active 135 DOM
-
2026-06-03days on market $747,500 Active 134 DOM
-
2026-06-03days on market $747,500 Active 133 DOM
-
2026-05-31days on market $747,500 Active 131 DOM
-
2026-05-30days on market $747,500 Active 130 DOM
-
2026-04-29price $747,500
-
2026-02-16price $765,000
-
2026-01-20$795,000 Active
-
2020-07-22soldstatus $295,000
-
2009-08-12soldstatus $240,000
-
2009-08-07soldstatus $240,000 284-char remark
Show marketing remark (284 chars)
Great location in in.Old Kure Beach in., walk 3 blocks to Downtown. Or enjoy pier/ocean views from rooftop deck! Multi-family potential with 2 existing kitchens. Nice remodel - add a floor for ocean views, has existing elevator. Lush landscaping, private back yard. Not in Flood Zone.
-
2008-11-17$274,900 284-char remark
Show marketing remark (284 chars)
Great location in in.Old Kure Beach in., walk 3 blocks to Downtown. Or enjoy pier/ocean views from rooftop deck! Multi-family potential with 2 existing kitchens. Nice remodel - add a floor for ocean views, has existing elevator. Lush landscaping, private back yard. Not in Flood Zone.
-
2008-11-17historical
Show marketing remark (284 chars)
Great location in in.Old Kure Beach in., walk 3 blocks to Downtown. Or enjoy pier/ocean views from rooftop deck! Multi-family potential with 2 existing kitchens. Nice remodel - add a floor for ocean views, has existing elevator. Lush landscaping, private back yard. Not in Flood Zone.
-
2008-05-20$329,900
-
2006-08-12historical
-
2006-08-12historical
-
2006-06-25$449,000
-
2006-06-25$449,000
ⓘ Source: listings_history table (triggers on properties + properties_extension) + one-shot
backfill from property_details.listing_events for pre-trigger history.
Tax reassessment forecast NC · Resets to sale price
- Current annual tax
- $1,672 · $139/mo
- Projected year-2 tax
- $6,130 · $511/mo
- Expected delta
- +$4,458/yr (+$371/mo · 266.6%)
ⓘ Screening estimate from a state-policy table — verify with the county assessor before closing.
Climate risk First Street
- Flood 1/10 Low FEMA zone X (unshaded) · 0% chance over 30 yrs
- Wildfire 3/10 Moderate
- Heat 10/10 Extreme 7 d/yr ≥104°F today · 19 d/yr by 30 yrs out
- Wind 9/10 Extreme 99% chance of damaging wind over 30 yrs
- Air quality 2/10 Low 1 unhealthy d/yr today · 1 by 30 yrs out
Nearby sold comps map
Loading sold comps map…
Walkable amenities ~0.75 mi
Loading nearby amenities…
Taxation est. · year 1
- Rental income
- $30,000
- − Mortgage interest
- −$41,872
- − Property taxes
- −$1,672
- − Insurance
- −$3,738
- − Repairs & maintenance
- −$2,400
- − Management
- −$2,400
- − Depreciation
- −$21,745
- Taxable loss
- −$43,826
- Est. tax savings @ 24.0%
- +$10,518
- After-tax cash flow
- $-18,231/yr
For passive investors: Depreciation is non-cash, so a rental often shows a tax loss while cash-flowing — sheltering income. Rental losses are passive: they offset passive income freely, and up to $25,000/yr can offset ordinary (W-2) income if you actively participate and your MAGI is under $100k (phasing out to $0 by $150k); unused losses carry forward. On sale, claimed depreciation is recaptured at up to 25%, and gains may owe capital-gains tax (a 1031 exchange can defer both). Figures are a year-1 estimate at your 24.0% rate — not tax advice; consult a CPA.
Schools (NCES district)
- District
- New Hanover County Schools
- NCES district ID
- 3703330
- Math proficiency
- 48% ▼ -3.00%
- Reading proficiency
- 53% ▬ 0.00%
- Median HH income
- $49,406
- Composite
- 43.13/100
- National rank
- #3081
- State rank
- #61 of 178 in NC
Livability — Kure Beach
- Score
- 65/100
- State rank
- #303
- US rank
- #12563
Category grades
Schools grade is shown separately in the Schools card above.
Census & demographics
- Census place
- Kure Beach, NC
- Population (ZIP)
- 2,017
Population outlook (New Hanover County) Hauer SSP2
- Today (2025)
- 259,517 people
- By 2030
- 279,586 · +7.7%
- By 2040
- 318,223 · +22.6%
- By 2050
- 354,831 · +36.7%
- By 2075
- 437,158 · +68.5%
- By 2100
- 486,769 · +87.6%
Race, ethnicity, and origin ACS 2023
- Neighborhood character
- Predominantly White (97%)
- Race & ethnicity
- White 97% Two or more races 3%
- Common ancestry
- Romanian 6% Serbian 5% Lithuanian 4%
- Foreign-born
- 3% · Canada
- Languages at home
- 98% English-only · French/Haitian/Cajun 2% Other Indo-European 1%
Political lean MEDSL · New Hanover
- 2024 margin
- Toss-up / Even · D 49.8% · R 49.1% · Other 1.1%
- 2008→2024 swing
- +2.0pp toward D · 2008: -1.4pp · 2024: 0.6pp
- All cycles
- 2024: D+0.6 2020: D+2.1 2016: R+4.1 2012: R+4.7 2008: R+1.4
Not yet ingested
- Civics
- —
Market trends
- HPI YoY
- ▼ -197.31%
- Current HPI
- 246.571
- Rent YoY
- —
- Metro
- —
- State GDP YoY
- ▲ 3.28%
- F500 in state
- 26
Industry mix (Fortune 500 HQ in NC)
| Industry | F500 HQs | Revenue |
|---|---|---|
| Financial Services | 2 | $213B |
|
||
| Retail | 2 | $95B |
|
||
| Industrial Conglomerate | 1 | $38B |
|
||
| Metals / Steel | 1 | $35B |
|
||
| Utilities | 1 | $30B |
|
||
| Industrial Machinery | 1 | $19B |
|
||
Price history
+66.5% since first listed13 events — show timeline
- 2026-04-29 Price Changed $747,500 Hive MLS
- 2026-02-16 Price Changed $765,000 Hive MLS
- 2026-01-20 Listed $795,000 Hive MLS
- 2020-07-22 Sold (Public Records) $295,000 Public Records
- 2009-08-12 Sold (Public Records) $240,000 Public Records
- 2009-08-07 Sold (MLS) $240,000 Hive MLS
- 2008-11-17 Listing Removed — Hive MLS
- 2008-11-17 Listed $274,900 Hive MLS
- 2008-05-20 Listed $329,900 Hive MLS
- 2006-08-12 Listing Removed — Hive MLS
- 2006-08-12 Listing Removed — Hive MLS
- 2006-06-25 Listed $449,000 Hive MLS
- 2006-06-25 Listed $449,000 Hive MLS
Property tax history
+0.2%/yrLatest (2025): $1,672 · -36.7% YoY. Source: county tax records.
Cash-flow waterfall
monthlySold comps — $/sqft
last 12 mo · ≤1 miLoading sold comps…