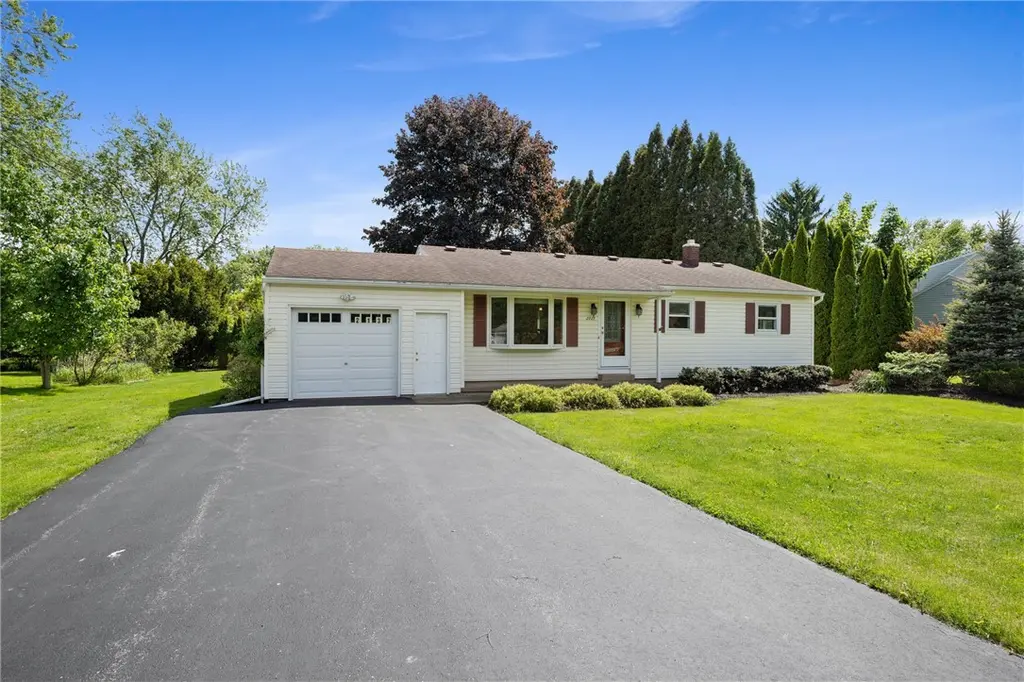
2137 Westside Dr · Spencerport, NY
Flood risk No data
- FEMA flood zone
- —
- Chance of flooding over 30 yrs
- —
- Est. flood insurance / yr
- —
Fire risk No data
- Est. fire insurance / yr
- —
Heat risk No data
- Hot days now (above threshold)
- —
- Hot days in 30 yrs
- —
Wind risk No data
- Chance of severe wind over 30 yrs
- —
Air-quality risk No data
- Unhealthy air days now
- —
- Unhealthy air days in 30 yrs
- —
Risk factors via First Street. Map © Google.
Why this score? — see what drove the C grade
The composite is a weighted blend of 9 inputs, each scored 0–100. Each bar is that input's sub-score; the figure is the points it added to the 100-point composite (weight × sub-score).
- Cash flow +19.4/30.0
- ARV discount +14.5/15.0
- DSCR +6.1/10.0
- 1% rule +5.8/10.0
- Schools +4.8/10.0
- Livability +3.8/5.0
- Rent growth +2.5/5.0
- Condition / age +2.5/5.0
- Appreciation +0.0/10.0
$199,900
🖨 Deal sheet (PDF) 📄 Offer letter ✓ Due diligence
Listing remarks
Lovingly maintained by the same family for many years, this charming 3 bedroom, 1.5 bath ranch offers warmth, space, and timeless comfort throughout. First-floor living with spacious rooms, functional living space, and a convenient location close to everyday amenities. Natural light fills the main living areas, while the beautifully updated full bath and generously sized bedrooms add comfort and functionality throughout. The oversized eat-in kitchen is a standout feature, offering an abundance of cabinetry and counter space, warm wood finishes, recessed lighting, and plenty of room to gather, cook, and entertain. Just off the dining area, a separate door leads into the enclosed three-season
Key facts
- Private backyard
- First floor living
- Convenient location
Tags
Property features AI
Finance
- Other: Irregular lot with approximately 90 x 167 dimensions; Road frontage on a main thoroughfare
Exterior
- Parking: Attached garage; Driveway
- Utilities: Public water connected; Sewer connected
- Home design: Single-story home; Existing construction; Shingle roof
- Construction: Aluminum siding; Vinyl siding; Blown-in insulation; Block foundation; Built as existing (year built details noted as existing)
- Exterior features: Blacktop driveway; Open patio and porch; Patio; Porch
Interior
- Kitchen: Gas oven; Gas range; Range hood; Refrigerator; Pantry; Solid surface counters
- Bedrooms: 3 main-level bedrooms
- Flooring: Carpet; Hardwood; Laminate; Vinyl; Varies
- Bathrooms: 1 full bathroom; 1 half bathroom
- Heating & cooling: Gas forced-air heating; Central air conditioning
- Interior features: Ceiling fans; Dining area; Eat-in kitchen; Separate/formal living room; Pantry; Pull-down attic stairs; Solid surface counters; Programmable thermostat; Main level primary bedroom; Bedroom on main level
- Laundry & utility: Washer and dryer in basement; Gas water heater; Humidifier; Exhaust fan
Neighborhood map
What this means for you Summary
Snapshot
- This is a 3-bed/1.5-bath single-family listed at $200k.
Deal economics
- At list price, monthly cash flow is $223 ($3k/yr) — positive.
- The deal already cash-flows at list — no discount required.
- Meets the 1% rule at list price ($2k rent vs $200k).
- Cap rate 7.6% vs local median 3.3% in Spencerport — top-decile yield for the area; either an underpriced asset or a hidden risk that comps aren't pricing in. Stress-test before assuming the spread holds.
Location & tenants
- Location reads 76/100 on livability (#237 in NY, #3,718 nationally) — a middle-class / working-renter tenant base. Strengths: housing A+, health & safety A, crime B+; Watch: amenities F, commute F.
- Churchville-Chili Central School District (rural): math 53% / reading 57% proficiency, ranked #291 of 590 in NY (top 49%) — acceptable for families but not a draw, mixed tenant base, ~2y average lease.
- Zoned schools: Churchville-Chili Middle School (math 39% / reading 50%, grade D, #348 of 729 statewide, top 50%, 1,156 students, 34% FRL); Churchville-Chili Senior High School (math 95% / reading 98%, grade A+, #59 of 1,100 statewide, top 6%, 1,192 students, 30% FRL).
- Zoned-school proficiency averages 70% at this address vs 55% district-wide (+15 pts) — the actual schools serving this property are materially stronger than the Churchville-Chili Central School District average implies; a family-tenant draw the district grade alone would hide.
- Market conditions: 127 active listings in the ZIP; 3 comparable units currently listed for rent nearby; rentals leasing fast (median 4d on market — plan ~1-2 weeks tenant-placement turnaround); solid renter incomes; 1,169 units permitted in Monroe County in 2024 (591 in 5+ unit buildings).
Forward outlook
- Local home prices are declining (-3.0%/yr); year-one equity from $1k of loan paydown is wiped out by about $6k of value loss. Plan a longer hold.
- Monroe County population projected to shrink 6% by 2050 — rents likely to lag national; underwrite the cash flow, not the appreciation.
Negotiation context
- Only 9 days on market — expect competitive offers; lowballing is unlikely to land.
Questions for the listing agent
- Built in 1961 — when were the roof, HVAC, electrical panel, plumbing, and water heater last replaced?
- Is there a deadline driving the sale (1031 exchange, divorce, estate, relocation)? That informs how much negotiation room exists.
- Schools are B-rated — typically a magnet for longer-tenancy family renters. What's the average tenant stay here, and is there a school-zone premium baked into asking?
- What's the average days-on-market for RENTAL listings here right now (not sales)? A rising rental-DOM trend means longer vacancies and softer asking-rent achievability than the comps imply.
- What's the recent tenant-quality profile in this submarket — average credit score on applications, eviction rate, late-payment / NSF rate, and stable-employment percentage? A property-management company in the area should have these aggregated.
- How much new for-sale + rental construction is in the pipeline within 1–3 miles? Heavy new supply typically softens prices + rents 12–24 months out; constrained supply supports both.
Investment metrics
- 1% rule
- 1.08% ✓
- Cap rate
- 7.63%
- Cash-on-cash
- 4.78%
- DSCR
- 1.21
- GRM
- 7.7
CMA / ARV
- ARV (on-the-fly)
- $236,930
- Comps found
- 12
Show comp detail 12 sales within ~0.75 mi
| Address | Dist | Beds/Ba | Sqft | Sold | Price | $/sf | Match |
|---|---|---|---|---|---|---|---|
| 2191 Westside Dr | 0.29mi | 3/1.0 | 1,325 (+6%) | 2mo | $252,000 | $190 | 73 |
| 91 Emerald Pt | 0.34mi | 3/1.0 | 1,176 (-6%) | 1mo | $345,000 | $293 | 72 |
| 12 Lilly Pond Cir | 0.47mi | 3/2.0 | 1,309 (+5%) | 2mo | $330,000 | $252 | 66 |
| 2060 Westside Dr | 0.25mi | 3/1.5 | 1,330 (+7%) | 17mo | $201,000 | $151 | 63 |
| 31 College Greene Dr | 0.56mi | 2/2.0 (-1) | 1,255 (+1%) | 9mo | $235,000 | $187 | 58 |
| 2044 Westside Dr | 0.42mi | 3/2.0 | 1,364 (+9%) | 6mo | $240,001 | $176 | 58 |
| 12 Freedom Pond Ln | 0.64mi | 2/1.5 (-1) | 1,239 (-1%) | 14mo | $308,500 | $249 | 53 |
| 7 Baylor Cir | 0.40mi | 3/1.5 | 1,432 (+15%) | 7mo | $142,500 | $100 | 50 |
| 6 Freedom Pond Ln | 0.62mi | 2/2.0 (-1) | 1,294 (+4%) | 11mo | $255,000 | $197 | 49 |
| 4 Stillmeadow Dr | 0.51mi | 3/1.5 | 1,080 (-13%) | 9mo | $220,000 | $204 | 47 |
| 2017 Westside Dr | 0.58mi | 3/2.0 | 1,420 (+14%) | 8mo | $230,000 | $162 | 41 |
| 3 Pleasant St | 0.50mi | 2/2.0 (-1) | 1,087 (-13%) | 11mo | $195,000 | $179 | 39 |
Match score weights: distance 35% · size 25% · config 20% · recency 20%. Top-matched comps best support the ARV.
Projected returns pro-forma
-3.0% appreciation · 3.0% rent growth · sell at horizon
- IRR
- -8.8%
- Equity multiple
- 0.68×
- Total profit
- $-18,112
- Equity at exit
- $29,806
- IRR
- 0.7%
- Equity multiple
- 1.05×
- Total profit
- $2,883
- Equity at exit
- $17,284
Cash invested: $55,972 (down + closing). Projections, not guarantees.
Landlord ↔ Tenant lean methodology
- Overall (STATE)
- 15 Strongly Tenant-Friendly
- State New York
- 15 Strongly Tenant-Friendly · D+10
- County
- — inherits STATE
- City
- — inherits STATE
ZIP-level market 14624
- Active inventory
- 127
- Price-to-rent
- 7.7×
Monthly cashflow live
- Estimated rent
- $2,160 medium interval (Pro) →
- Mortgage (P&I)
- −$1,048
- Tax from tax record
- −$352 /mo · $4,228/yr
- Insurance
- −$83
- HOA
- −$0
- Vacancy / Maint / Mgmt
- −$454
- Net cashflow
- $223
Break-even live
Sensitivity live
| Price | -10% $336 | -5% $279 | +0% $223 | +5% $166 | +10% $110 |
|---|---|---|---|---|---|
| Rent | -10% $52 | -5% $137 | +0% $223 | +5% $308 | +10% $393 |
| Rate | -1.0pp $323 | -0.5pp $274 | base $223 | +0.5pp $171 | +1.0pp $118 |
UW: 25.0% down · 7.5% · 30yr · 1.5% tax · 5.0% vac · 8.0% maint · 8.0% mgmt
Financing live
Cash to close
- Down payment
- $49,975
- Closing costs
- $5,997
- Reserves months
- —
- Total cash needed
- —
Loan-product check · same deal, 3 products live
Conventional
25% down · 7.5% · 30yr
- Down + closing
- —
- Monthly P&I
- —
- Monthly cashflow
- —
- DSCR
- —
- Eligible?
- —
Personal DTI + credit; lowest rate.
DSCR
20% down · 8.5% · 30yr
- Down + closing
- —
- Monthly P&I
- —
- Monthly cashflow
- —
- DSCR
- —
- Eligible?
- —
No personal income docs; deal must DSCR.
Hard money
10% down · 12.0% · 12mo
- Down + closing
- —
- Monthly P&I
- —
- Monthly cashflow
- —
- DSCR
- —
- Eligible?
- —
Short-term bridge; refi at stabilization.
Rent comps 3 comps
| Address | Beds | Baths | Sqft | Rent | $/sqft | DOM | Units | Dist |
|---|---|---|---|---|---|---|---|---|
| 1 Meadow Farm N North Chili, NY | 3.0 | 1.0–1.5 | 1047 | $2,130 | $2.03 | 4d | 1 | 1.13mi |
| 111 Whittier Rd Rochester, NY | 1.0–3.0 | 1.0–2.5 | 1112 | $2,500 | $2.25 | 4d | 23 | 1.40mi |
| 2431 Westside Dr North Chili, NY | 2.0 | 1.0 | 882 | $1,600 | $1.81 | 4d | 1 | 1.49mi |
Listing history 7 events
-
2026-06-07statusdays on market $199,900 Pending 9 DOM
-
2026-06-05days on market $199,900 Active 8 DOM
-
2026-06-03days on market $199,900 Active 7 DOM
-
2026-06-03days on market $199,900 Active 6 DOM
-
2026-06-01days on market $199,900 Active 5 DOM
-
2026-05-31days on market $199,900 Active 4 DOM
-
2026-05-27$199,900 Active
ⓘ Source: listings_history table (triggers on properties + properties_extension) + one-shot
backfill from property_details.listing_events for pre-trigger history.
Tax reassessment forecast NY · Partial reset (capped growth)
- Current annual tax
- $4,228 · $352/mo
- Projected year-2 tax
- $4,228 · $352/mo
- Expected delta
- $0/yr ($0/mo · 0.0%)
ⓘ Screening estimate from a state-policy table — verify with the county assessor before closing.
Nearby sold comps map
Loading sold comps map…
Walkable amenities ~0.75 mi
Loading nearby amenities…
Taxation est. · year 1
- Rental income
- $25,923
- − Mortgage interest
- −$11,198
- − Property taxes
- −$4,228
- − Insurance
- −$1,000
- − Repairs & maintenance
- −$2,074
- − Management
- −$2,074
- − Depreciation
- −$5,815
- Taxable loss
- −$464
- Est. tax savings @ 24.0%
- +$111
- After-tax cash flow
- $2,784/yr
For passive investors: Depreciation is non-cash, so a rental often shows a tax loss while cash-flowing — sheltering income. Rental losses are passive: they offset passive income freely, and up to $25,000/yr can offset ordinary (W-2) income if you actively participate and your MAGI is under $100k (phasing out to $0 by $150k); unused losses carry forward. On sale, claimed depreciation is recaptured at up to 25%, and gains may owe capital-gains tax (a 1031 exchange can defer both). Figures are a year-1 estimate at your 24.0% rate — not tax advice; consult a CPA.
Schools (NCES district)
- District
- Churchville-Chili Central School District
- NCES district ID
- 3607530
- Math proficiency
- 53% ▼ -13.00%
- Reading proficiency
- 57% ▲ 3.00%
- Median HH income
- $61,997
- Composite
- 48.07/100
- National rank
- #2191
- State rank
- #291 of 590 in NY
Livability — Spencerport
- Score
- 76/100
- State rank
- #237
- US rank
- #3718
Category grades
Schools grade is shown separately in the Schools card above.
Census & demographics
- County
- Monroe County · 674,131 people
- City population
- 17,200
- Metro
- Rochester, NY
- Population (ZIP)
- 38,626
- Household income
- $87,989
- Rent vs Own
- Severe rent burden
- 584.0
Population outlook (Monroe County) Hauer SSP2
- Today (2025)
- 759,460 people
- By 2030
- 757,154 · -0.3%
- By 2040
- 740,644 · -2.5%
- By 2050
- 714,443 · -5.9%
- By 2075
- 645,883 · -15.0%
- By 2100
- 547,084 · -28.0%
Race, ethnicity, and origin ACS 2023
- Neighborhood character
- Predominantly White (78%)
- Race & ethnicity
- White 78% Black 9% Hispanic / Latino 6% Two or more races 5% Asian 3%
- Hispanic origin (detail)
- Puerto Rican 4%
- Common ancestry
- Romanian 6% Iranian 2% Lithuanian 2%
- Foreign-born
- 7% · Canada, China, India
- Languages at home
- 90% English-only · Spanish 3% Other Indo-European 3% Russian/Polish/Slavic 1%
Political lean MEDSL · Monroe
- 2024 margin
- D (+19.1) · D 59.5% · R 40.5%
- 2008→2024 swing
- +1.4pp toward D · 2008: 17.7pp · 2024: 19.1pp
- All cycles
- 2024: D+19.1 2020: D+21.0 2016: D+14.1 2012: D+17.4 2008: D+17.7
Not yet ingested
- Civics
- —
Market trends
- HPI YoY
- ▼ -151.26%
- Current HPI
- 267.356
- Rent YoY
- —
- Metro
- Rochester, NY
- State GDP YoY
- ▲ 2.60%
- F500 in state
- 92
Industry mix (Fortune 500 HQ in NY)
| Industry | F500 HQs | Revenue |
|---|---|---|
| Financial Services | 10 | $950B |
|
||
| Consumer Goods | 9 | $162B |
|
||
| Insurance | 4 | $225B |
|
||
| Telecommunications | 2 | $144B |
|
||
| Pharmaceuticals | 2 | $112B |
|
||
| Media / Entertainment | 2 | $69B |
|
||
Price history
1 event — show timeline
- 2026-05-27 Listed $199,900 UNYREIS
Property tax history
+9.3%/yrLatest (2025): $4,228 · +121.2% YoY. Source: county tax records.
Cash-flow waterfall
monthlySold comps — $/sqft
last 12 mo · ≤1 miLoading sold comps…