10 Arlington Dr · Rotonda, FL
Flood risk 8/10 · Major
- FEMA flood zone
- AE
- Chance of flooding over 30 yrs
- 0.99%
- Est. flood insurance / yr
- $1,737 – $8,500
Fire risk 1/10 · Minimal
- Est. fire insurance / yr
- $947 – $1,759
Heat risk 10/10 · Severe
- Hot days now (above 107°F)
- 7 days/yr
- Hot days in 30 yrs
- 28 days/yr
Wind risk 10/10 · Severe
- Chance of severe wind over 30 yrs
- 99.0%
Air-quality risk 2/10 · Minimal
- Unhealthy air days now
- 1 days/yr
- Unhealthy air days in 30 yrs
- 1 days/yr
Risk factors via First Street. Map © Google.
Why this score? — see what drove the C- grade
The composite is a weighted blend of 9 inputs, each scored 0–100. Each bar is that input's sub-score; the figure is the points it added to the 100-point composite (weight × sub-score).
- Cash flow +15.0/30.0
- ARV discount +15.0/15.0
- DSCR +4.6/10.0
- Schools +4.6/10.0
- Appreciation +4.0/10.0
- Livability +3.4/5.0
- 1% rule +3.3/10.0
- Rent growth +2.5/5.0
- Condition / age +2.5/5.0
$625,000
🖨 Deal sheet (PDF) 📄 Offer letter ✓ Due diligence
Listing remarks
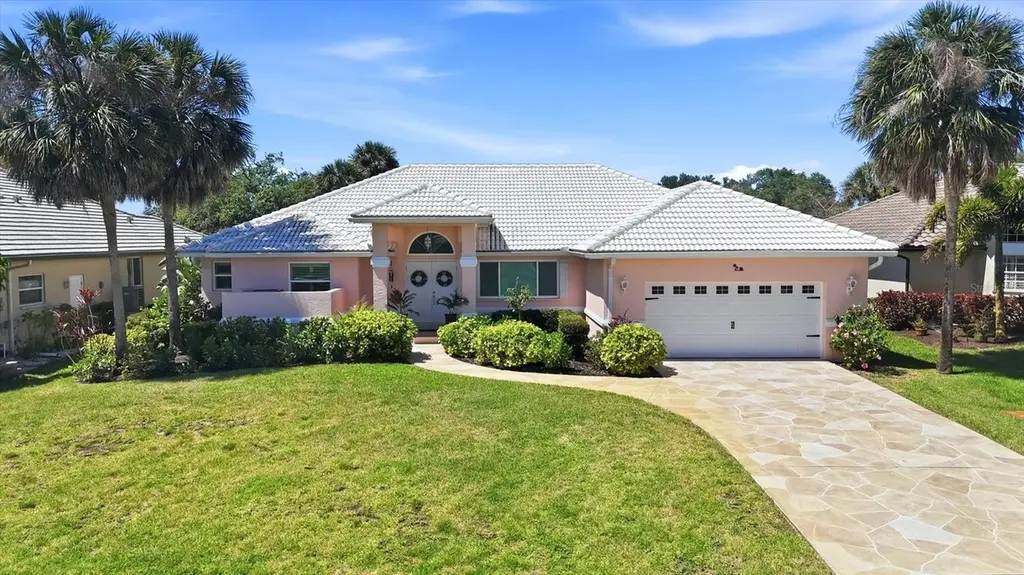
Experience the ultimate waterfront lifestyle in paradise with this beautifully updated, coastal-inspired home perfectly positioned along the scenic Amberjack Waterway. Offering shallow boating access to Coral Creek, Lemon Bay, and the Gulf of Mexico, this property is ideal for those who love to kayak, paddleboard, or cruise the backwaters right from their own backyard. With highly sought-after southwest rear exposure, you’ll enjoy stunning sunsets over the water, all from your oversized lot featuring a spacious backyard and a private 5’ x 20’ dock. Designed for relaxed coastal living, the home showcases a light, airy interior with a serene beachy vibe and numerous high-qua
Key facts
- Private dock
- Oversized lot
- 0.28 acre lot
Tags
Property features AI
Finance
- Other: Lease restrictions apply; Partially furnished; Irrigation equipment included
- HOA & community: HOA managed by Grande Property Services/Barbara Thomas; HOA fees required: $255 annually ($21.25 monthly equivalent); Association approval required; Community features include deed restrictions and sidewalks; Pets allowed
Exterior
- Parking: Attached oversized 2-car garage (25x23) with garage door opener; Driveway
- Utilities: Public water; Public sewer; Electricity available and connected; Broadband/high-speed internet available; Water and sewer available and connected
- Home design: Single family residence; One story; Northeast facing
- Construction: Block and stucco construction; Tile roof; Stem wall foundation; Built with living area per public records
- Exterior features: Rear porch; Sidewalk; Sliding doors; Fenced (other); Flood zone; Oversized, private lot; Paved road access; Trees and landscaping
Interior
- Kitchen: Dishwasher; Disposal; Microwave; Range; Refrigerator; Stone counters; Eat-in kitchen
- Bedrooms: 3 bedrooms
- Flooring: Ceramic tile
- Bathrooms: 2 full bathrooms
- Heating & cooling: Central heating; Central air conditioning
- Interior features: Ceiling fans; Crown molding; Eat-in kitchen; Living room/dining room combo; Split bedroom floorplan; Stone counters; Vaulted ceilings; Walk-in closets; Window treatments; Inside utility room
- Laundry & utility: Inside laundry room; Washer; Dryer; Electric water heater
Neighborhood map
What this means for you Summary
Snapshot
- This is a 3-bed/2.0-bath single-family listed at $625k.
Deal economics
- At list price, monthly cash flow is $-230 ($-3k/yr) — negative.
- To cash-flow at today's rent, offer at most $584k (6.5% below list).
- To meet the 1% rule (rent ≥ 1% of price), the offer needs to be $518k (17.2% below list).
- Recommended offer: $518k (17.2% below list) — sets the bar for 1% rule.
- Cap rate 6.7% vs local median 3.1% in Rotonda — top-decile yield for the area; either an underpriced asset or a hidden risk that comps aren't pricing in. Stress-test before assuming the spread holds.
Location & tenants
- Location reads 67/100 on livability (#548 in FL) — a middle-class / working-renter tenant base. Strengths: crime A+, housing A-, cost of living B+; Watch: amenities F, commute F, health & safety D-.
- Charlotte (suburban): math 54% / reading 54% proficiency, ranked #22 of 73 in FL (top 30%) — acceptable for families but not a draw, mixed tenant base, ~2y average lease.
- Zoned schools: Vineland Elementary School (math 74% / reading 67%, grade A-, #333 of 2,144 statewide, top 16%, 579 students, 45% FRL); L. A. Ainger Middle School (math 65% / reading 53%, grade B, #144 of 571 statewide, top 26%, 720 students, 40% FRL); Lemon Bay High School (math 50% / reading 56%, grade C-, #148 of 667 statewide, top 23%, 1,360 students, 28% FRL) — zoned schools average 38% FRL vs 54% district-wide (16 pts lower); this property's tenant base skews higher-income than the district average.
- Market conditions: 916 active listings in the ZIP; 16 comparable units currently listed for rent nearby; rentals at typical pace (median 23d on market — plan ~3-4 weeks tenant-placement turnaround); 4,585 units permitted in Charlotte County in 2024 (703 in 5+ unit buildings).
Forward outlook
- Local home prices are declining (-1.9%/yr); year-one equity from $4k of loan paydown is wiped out by about $12k of value loss. Plan a longer hold.
- Charlotte County population projected at +24% by 2050 — long-run rental-demand tailwind backs the buy-and-hold thesis.
Negotiation context
- It's been on market 17 days — a 2% lower offer ($616k) is reasonable based on typical stale-listing flexibility.
- Current owner paid $162k; list at $625k implies a 287% gain — meaningful room to come down on a strong offer.
Risks & watch-outs
- Watch-outs: flood insurance adds $427/mo.
- Climate carrying-cost: in FEMA flood zone AE (mandatory federal flood insurance); severe wind risk, 99% chance of damaging wind over 30y; extreme-heat days projected 7→28/yr by 2055 (HVAC capex compounding) — expect insurance premiums to compound above CPI over the hold.
Questions for the listing agent
- What do current leases actually rent for vs. the listed asking? Can we see a recent rent roll and the last 12 months of T-12 income?
- What's the actual annual flood-insurance premium (NFIP or private), and is the property in a SFHA with mandatory coverage?
- What does the HOA fee cover, when was the last increase, and are there any pending special assessments or reserve-fund shortfalls?
- Is there a deadline driving the sale (1031 exchange, divorce, estate, relocation)? That informs how much negotiation room exists.
- Schools are D-rated, which usually means shorter tenancies and higher turnover. Who's the typical renter profile here, and what's been the actual vacancy rate?
- What's the average days-on-market for RENTAL listings here right now (not sales)? A rising rental-DOM trend means longer vacancies and softer asking-rent achievability than the comps imply.
- What's the recent tenant-quality profile in this submarket — average credit score on applications, eviction rate, late-payment / NSF rate, and stable-employment percentage? A property-management company in the area should have these aggregated.
- How much new for-sale + rental construction is in the pipeline within 1–3 miles? Heavy new supply typically softens prices + rents 12–24 months out; constrained supply supports both.
Investment metrics
- 1% rule
- 0.83% ✗
- Cap rate
- 6.67%
- Cash-on-cash
- 1.35%
- DSCR
- 1.06
- GRM
- 10.1
CMA / ARV
- ARV (on-the-fly)
- $762,450
- Comps found
- 5
Show comp detail 5 sales within ~0.75 mi
| Address | Dist | Beds/Ba | Sqft | Sold | Price | $/sf | Match |
|---|---|---|---|---|---|---|---|
| 4663 Arlington Dr | 0.42mi | 3/2.0 | 2,174 (-2%) | 12mo | $750,000 | $345 | 68 |
| 4652 Arlington Dr | 0.32mi | 3/3.0 | 2,355 (+7%) | 19mo | $870,000 | $369 | 55 |
| 4 Coral Creek Cir | 0.44mi | 3/3.0 | 2,410 (+9%) | 18mo | $1,024,000 | $425 | 46 |
| 440 Spaniards Rd | 0.71mi | 3/3.0 | 2,251 (+2%) | 22mo | $566,500 | $252 | 42 |
| 2 Windward Ter | 0.40mi | 3/3.0 | 1,953 (-12%) | 23mo | $390,000 | $200 | 39 |
Match score weights: distance 35% · size 25% · config 20% · recency 20%. Top-matched comps best support the ARV.
Projected returns pro-forma
-1.9% appreciation · 3.0% rent growth · sell at horizon
- IRR
- -12.5%
- Equity multiple
- 0.50×
- Total profit
- $-86,700
- Equity at exit
- $124,189
- IRR
- -4.9%
- Equity multiple
- 0.61×
- Total profit
- $-67,914
- Equity at exit
- $108,817
Cash invested: $175,000 (down + closing). Projections, not guarantees.
Landlord ↔ Tenant lean methodology
- Overall (STATE)
- 87 Strongly Landlord-Friendly
- State Florida
- 87 Strongly Landlord-Friendly · R+3
- County
- — inherits STATE
- City
- — inherits STATE
ZIP-level market 33946
- Home prices YoY
- -0.7%
- Active inventory
- 916
- Price-to-rent
- 10.1×
Monthly cashflow live
- Estimated rent
- $5,176 high interval (Pro) →
- Mortgage (P&I)
- −$3,278
- Tax from tax record
- −$334 /mo · $4,002/yr
- Insurance
- −$260
- Flood insurance flood zone
- −$427 /mo · $5,118/yr
- HOA
- −$21
- Vacancy / Maint / Mgmt
- −$1,087
- Net cashflow
- $-230
Break-even live
Sensitivity live
| Price | -10% $124 | -5% $-53 | +0% $-230 | +5% $-407 | +10% $-584 |
|---|---|---|---|---|---|
| Rent | -10% $-639 | -5% $-434 | +0% $-230 | +5% $-25 | +10% $179 |
| Rate | -1.0pp $85 | -0.5pp $-71 | base $-230 | +0.5pp $-392 | +1.0pp $-557 |
UW: 25.0% down · 7.5% · 30yr · 1.5% tax · 5.0% vac · 8.0% maint · 8.0% mgmt
Financing live
Cash to close
- Down payment
- $156,250
- Closing costs
- $18,750
- Reserves months
- —
- Total cash needed
- —
Loan-product check · same deal, 3 products live
Conventional
25% down · 7.5% · 30yr
- Down + closing
- —
- Monthly P&I
- —
- Monthly cashflow
- —
- DSCR
- —
- Eligible?
- —
Personal DTI + credit; lowest rate.
DSCR
20% down · 8.5% · 30yr
- Down + closing
- —
- Monthly P&I
- —
- Monthly cashflow
- —
- DSCR
- —
- Eligible?
- —
No personal income docs; deal must DSCR.
Hard money
10% down · 12.0% · 12mo
- Down + closing
- —
- Monthly P&I
- —
- Monthly cashflow
- —
- DSCR
- —
- Eligible?
- —
Short-term bridge; refi at stabilization.
Rent comps 16 comps
| Address | Beds | Baths | Sqft | Rent | $/sqft | DOM | Units | Dist |
|---|---|---|---|---|---|---|---|---|
| 11 Amberjack Ter Placida, FL | 3.0 | 2.0 | 2209 | $7,985 | $3.61 | 22d | 1 | 0.21mi |
| 50 Barracuda Dr Placida, FL | 3.0 | 2.0 | 2154 | $3,000 | $1.39 | 22d | 1 | 0.31mi |
| 2 Windward Ter Placida, FL | 3.0 | 3.0 | 1953 | $2,500 | $1.28 | 22d | 1 | 0.37mi |
| 10045 Links Ln #203 Rotonda West, FL | 2.0 | 2.0 | 1543 | $1,450 | $0.94 | 15d | 1 | 0.50mi |
| 11 Amberjack Ln Placida, FL | 3.0 | 2.0 | 1786 | $2,700 | $1.51 | 15d | 1 | 0.57mi |
| 3923 Cape Haze Dr #302 Rotonda West, FL | 3.0 | 3.0 | 2044 | $3,100 | $1.52 | 22d | 1 | 0.70mi |
| 10345 Longshore Rd #29 Placida, FL | 3.0 | 3.0 | 2416 | $6,900 | $2.86 | 22d | 1 | 0.97mi |
| 10446 Coquina Ct Placida, FL | 3.0 | 2.0 | 1820 | $4,500 | $2.47 | 22d | 1 | 1.00mi |
| 550 Gaspar Dr Placida, FL | 3.0 | 3.0 | 1803 | $5,500 | $3.05 | 22d | 1 | 1.07mi |
| 11000 Placida Rd #2201 Placida, FL | 2.0 | 2.5 | 1973 | $8,750 | $4.43 | 22d | 1 | 1.09mi |
| 10425 Pilothouse Cir #131 Placida, FL | 3.0 | 3.0 | 2390 | $5,000 | $2.09 | 22d | 1 | 1.16mi |
| 8936 Scallop Way Placida, FL | 3.0 | 2.0 | 2158 | $5,200 | $2.41 | 22d | 1 | 1.20mi |
| 8400 Placida Rd Unit G202 Rental Placida, FL | 2.0 | 2.5 | 1688 | $2,500 | $1.48 | 22d | 1 | 1.26mi |
| 13045 Via Aurelia Placida, FL | 3.0 | 2.0 | 1961 | $8,200 | $4.18 | 22d | 1 | 1.43mi |
| 8581 Amberjack Cir #301 Englewood, FL | 4.0 | 3.0 | 2761 | $6,500 | $2.35 | 22d | 1 | 1.45mi |
| 8581 Amberjack Cir Unit 1 Englewood, FL | 3.0 | 4.0 | 2761 | $6,500 | $2.35 | 22d | 1 | 1.45mi |
HOA detail
- Monthly dues
- $21 · $252/yr
- Likely covers
- water
Listing history 3 events
-
2026-05-08status Pending
-
2026-04-21$625,000 Active
-
1992-04-01soldstatus $161,500
ⓘ Source: listings_history table (triggers on properties + properties_extension) + one-shot
backfill from property_details.listing_events for pre-trigger history.
Tax reassessment forecast FL · Resets to sale price
- Current annual tax
- $4,002 · $334/mo
- Projected year-2 tax
- $5,188 · $432/mo
- Expected delta
- +$1,185/yr (+$99/mo · 29.6%)
ⓘ Screening estimate from a state-policy table — verify with the county assessor before closing.
Climate risk First Street
- Flood 8/10 Severe FEMA zone AE · 99% chance over 30 yrs
- Wildfire 1/10 Low
- Heat 10/10 Extreme 7 d/yr ≥107°F today · 28 d/yr by 30 yrs out
- Wind 10/10 Extreme 99% chance of damaging wind over 30 yrs
- Air quality 2/10 Low 1 unhealthy d/yr today · 1 by 30 yrs out
Nearby sold comps map
Loading sold comps map…
Walkable amenities ~0.75 mi
Loading nearby amenities…
Taxation est. · year 1
- Rental income
- $62,114
- − Mortgage interest
- −$35,010
- − Property taxes
- −$4,002
- − Insurance
- −$8,244
- − Repairs & maintenance
- −$4,969
- − Management
- −$4,969
- − HOA
- −$252
- − Depreciation
- −$18,182
- Taxable loss
- −$13,513
- Est. tax savings @ 24.0%
- +$3,243
- After-tax cash flow
- $485/yr
For passive investors: Depreciation is non-cash, so a rental often shows a tax loss while cash-flowing — sheltering income. Rental losses are passive: they offset passive income freely, and up to $25,000/yr can offset ordinary (W-2) income if you actively participate and your MAGI is under $100k (phasing out to $0 by $150k); unused losses carry forward. On sale, claimed depreciation is recaptured at up to 25%, and gains may owe capital-gains tax (a 1031 exchange can defer both). Figures are a year-1 estimate at your 24.0% rate — not tax advice; consult a CPA.
Schools (NCES district)
- District
- Charlotte
- NCES district ID
- 1200240
- Math proficiency
- 54% ▼ -6.00%
- Reading proficiency
- 54% ▼ -1.00%
- Median HH income
- $44,864
- Composite
- 45.62/100
- National rank
- #2586
- State rank
- #22 of 73 in FL
Livability — Rotonda
- Score
- 67/100
- State rank
- #548
- US rank
- #10359
Category grades
Schools grade is shown separately in the Schools card above.
Census & demographics
- Census place
- Rotonda, FL
- City population
- 10,490
- Population (ZIP)
- 2,745
Population outlook (Charlotte County) Hauer SSP2
- Today (2025)
- 198,646 people
- By 2030
- 210,507 · +6.0%
- By 2040
- 230,857 · +16.2%
- By 2050
- 247,148 · +24.4%
- By 2075
- 281,777 · +41.8%
- By 2100
- 293,609 · +47.8%
Race, ethnicity, and origin ACS 2023
- Neighborhood character
- Predominantly White (95%)
- Race & ethnicity
- White 95% Hispanic / Latino 2% Asian 1% Two or more races 1%
- Common ancestry
- Italian 3% Romanian 2% Russian 2%
- Foreign-born
- 6% · Canada
- Languages at home
- 91% English-only · Russian/Polish/Slavic 5% Spanish 1% French/Haitian/Cajun 1%
Political lean MEDSL · Charlotte
- 2024 margin
- Solid R (+34.0) · D 32.7% · R 66.7%
- 2008→2024 swing
- -26.7pp toward R · 2008: -7.2pp · 2024: -34.0pp
- All cycles
- 2024: R+34.0 2020: R+26.6 2016: R+27.8 2012: R+14.3 2008: R+7.2
Not yet ingested
- Civics
- —
Market trends
- HPI YoY
- ▼ -1.90%
- Current HPI
- 288.559
- Rent YoY
- —
- Metro
- —
- State GDP YoY
- ▲ 3.28%
- F500 in state
- 36
Industry mix (Fortune 500 HQ in FL)
| Industry | F500 HQs | Revenue |
|---|---|---|
| Industrial Technology | 2 | $29B |
|
||
| Insurance | 2 | $17B |
|
||
| Retail | 1 | $60B |
|
||
| Technology Distribution | 1 | $58B |
|
||
| Homebuilding | 1 | $35B |
|
||
| Technology Manufacturing | 1 | $35B |
|
||
Price history
+287.0% since first listed3 events — show timeline
- 2026-05-08 Pending — Stellar MLS as Distributed by MLS Grid
- 2026-04-21 Listed $625,000 Stellar MLS as Distributed by MLS Grid
- 1992-04-01 Sold (Public Records) $161,500 Public Records
Property tax history
+2.5%/yrLatest (2025): $4,002 · +6.4% YoY. Source: county tax records.
Cash-flow waterfall
monthlySold comps — $/sqft
last 12 mo · ≤1 miLoading sold comps…