17240 Honeydew Ct · Colorado Springs, CO
Flood risk 1/10 · Minimal
- FEMA flood zone
- X (unshaded)
- Chance of flooding over 30 yrs
- 0.0%
- Est. flood insurance / yr
- $507 – $1,088
Fire risk 6/10 · Moderate
- Est. fire insurance / yr
- $939 – $1,743
Heat risk 2/10 · Minimal
- Hot days now (above 89°F)
- 7 days/yr
- Hot days in 30 yrs
- 19 days/yr
Wind risk 2/10 · Minimal
- Chance of severe wind over 30 yrs
- —
Air-quality risk 1/10 · Minimal
- Unhealthy air days now
- 0 days/yr
- Unhealthy air days in 30 yrs
- 0 days/yr
Risk factors via First Street. Map © Google.
Why this score? — see what drove the D- grade
The composite is a weighted blend of 9 inputs, each scored 0–100. Each bar is that input's sub-score; the figure is the points it added to the 100-point composite (weight × sub-score).
- ARV discount +12.1/15.0
- Cash flow +9.3/30.0
- Livability +3.9/5.0
- Schools +3.4/10.0
- Rent growth +3.3/5.0
- DSCR +2.6/10.0
- Condition / age +2.5/5.0
- 1% rule +1.7/10.0
- Appreciation +0.0/10.0
$410,000
🖨 Deal sheet 📄 Offer letter ✓ Due diligence
Listing remarks
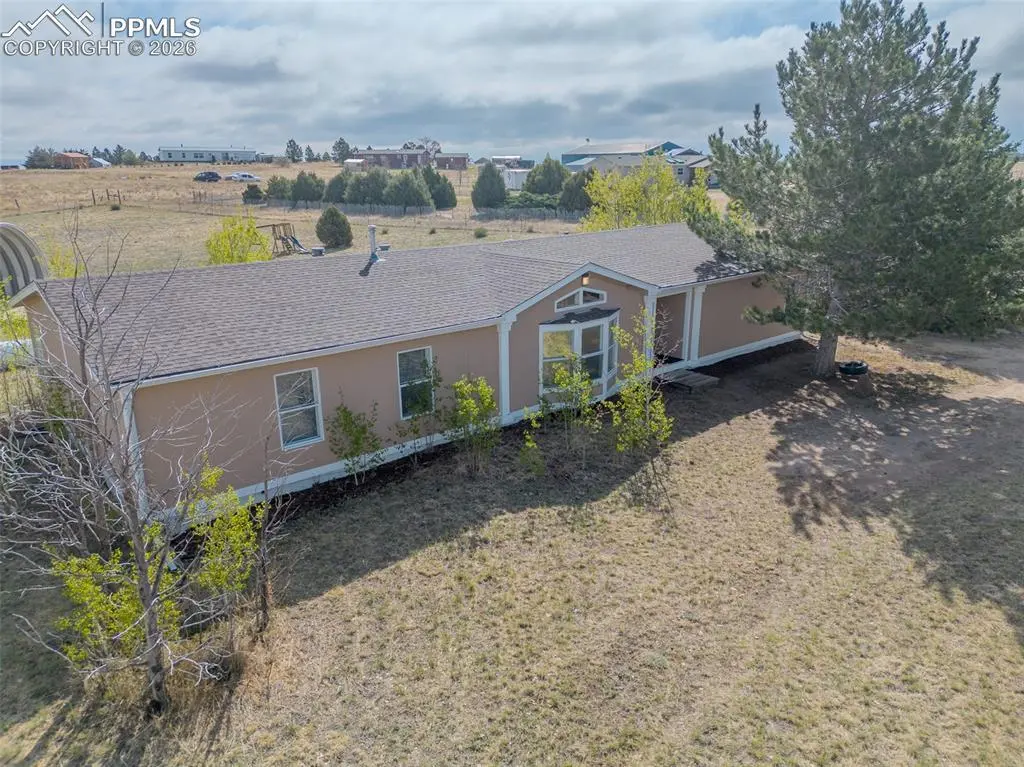
Looking for a home on acreage in Peyton, Colorado with no HOA and room to spread out? Welcome to this great 3-bedroom, 2-bath home situated on 2.45 acres in desirable School District 49. This property offers the space, flexibility, and lifestyle many Colorado buyers are searching for — whether you’re looking for your first home, a quieter setting outside the city, or a property with room for hobbies, animals, equipment, or future possibilities. Inside, you’ll find 1,848 square feet with a spacious open-concept layout connecting the living room, kitchen, and dining areas. The main living spaces feature new wood laminate flooring, fresh interior paint, and a warm, inviting f
Key facts
- Acreage
- School district 49
- Flexible use
Tags
Property features AI
Finance
- Financial info: Financing available: Cash, Conventional, FHA, USDA, VA
- HOA & community: Homeowners association exists (no applicable fee)
Exterior
- Parking: 4 garage spaces; Detached garage; Carport
- Utilities: Municipal water; Electricity available; Propane service
- Home design: Single-family home; HUD standard manufactured structure
- Construction: Wood siding; Composite shingle roof; Crawl space foundation; Existing home (not new construction)
- Exterior features: 360-degree views; Cul-de-sac lot; Level yard; Mountain views; RV parking; Outbuilding(s)
Interior
- Kitchen: Dishwasher; Disposal; Microwave; Oven; Range (Gas/Electric); Refrigerator
- Bedrooms: Main-floor bedroom
- Flooring: Carpet; Wood laminate
- Bathrooms: Two full bathrooms
- Heating & cooling: Forced air heating; Propane heating; Wood heating; Central air conditioning
- Interior features: 5-piece bathroom; Skylights; Stove-style fireplace
- Laundry & utility: Washer and dryer included; Main-floor laundry
Neighborhood map
What this means for you Summary
Snapshot
- This is a 3-bed/2.0-bath manufactured listed at $410k.
Deal economics
- At list price, monthly cash flow is $-297 ($-4k/yr) — negative.
- To cash-flow at today's rent, offer at most $357k (12.8% below list).
- To meet the 1% rule (rent ≥ 1% of price), the offer needs to be $275k (32.9% below list).
- Recommended offer: $275k (32.9% below list) — sets the bar for 1% rule.
- Cap rate 5.4% vs local median 3.3% in Colorado Springs — top-decile yield for the area; either an underpriced asset or a hidden risk that comps aren't pricing in. Stress-test before assuming the spread holds.
Location & tenants
- Location reads 78/100 on livability (#23 in CO, #2,639 nationally) — a middle-class / working-renter tenant base. Strengths: amenities A+, housing A+, health & safety A+; Watch: cost of living C-, crime F.
- El Paso County Colorado School District 49 (urban): math 27% / reading 47% proficiency, ranked #27 of 86 in CO (top 31%) — families likely to look elsewhere, expect single-tenant / working-renter base with shorter leases; only 17% free/reduced lunch — higher-income household profile.
- Market conditions: Rents rising (+3.1%/yr); 513 active listings in the ZIP; 1 comparable units currently listed for rent nearby; high-income renter base; 3,906 units permitted in El Paso County in 2024 (872 in 5+ unit buildings).
Forward outlook
- Local home prices are declining (-3.0%/yr); year-one equity from $3k of loan paydown is wiped out by about $12k of value loss. Plan a longer hold.
- El Paso County population projected at +28% by 2050 — long-run rental-demand tailwind backs the buy-and-hold thesis.
Negotiation context
- It's been on market 36 days — a 3% lower offer ($398k) is reasonable based on typical stale-listing flexibility.
Risks & watch-outs
- Climate carrying-cost: major wildfire risk — expect insurance premiums to compound above CPI over the hold.
Questions for the listing agent
- What do current leases actually rent for vs. the listed asking? Can we see a recent rent roll and the last 12 months of T-12 income?
- It's been on market 36 days. Have you received any prior offers? Is the seller open to a 33% concession, seller financing, or rate buy-down credit?
- Is there a deadline driving the sale (1031 exchange, divorce, estate, relocation)? That informs how much negotiation room exists.
- Schools are B-rated — typically a magnet for longer-tenancy family renters. What's the average tenant stay here, and is there a school-zone premium baked into asking?
- Crime grade is F in this area — have there been break-ins, vandalism, or insurance claims at this property in the last 3 years? What carrier currently insures it and at what premium?
- The area grade is low — what's the realistic commute time and amenity access for the typical tenant pool here? Any planned neighborhood developments (good or bad) we should know about?
- What's the average days-on-market for RENTAL listings here right now (not sales)? A rising rental-DOM trend means longer vacancies and softer asking-rent achievability than the comps imply.
- What's the recent tenant-quality profile in this submarket — average credit score on applications, eviction rate, late-payment / NSF rate, and stable-employment percentage? A property-management company in the area should have these aggregated.
- How much new for-sale + rental construction is in the pipeline within 1–3 miles? Heavy new supply typically softens prices + rents 12–24 months out; constrained supply supports both.
Investment metrics
- 1% rule
- 0.67% ✗
- Cap rate
- 5.42%
- Cash-on-cash
- -3.11%
- DSCR
- 0.86
- GRM
- 12.4
CMA / ARV
- ARV (median comp)
- $457,111
- List price
- $410,000
- Delta
- -10.31%
- Verdict
- UNDERPRICED
- Comps
- 15 within 1.0 mi
Projected returns pro-forma
-3.0% appreciation · 3.09% rent growth · sell at horizon
- IRR
- -21.5%
- Equity multiple
- 0.26×
- Total profit
- $-85,304
- Equity at exit
- $61,132
- IRR
- -15.1%
- Equity multiple
- 0.14×
- Total profit
- $-98,371
- Equity at exit
- $35,449
Cash invested: $114,800 (down + closing). Projections, not guarantees.
Landlord ↔ Tenant lean methodology
- Overall (STATE)
- 38 Tenant-Leaning
- State Colorado
- 38 Tenant-Leaning · D+4
- County
- — inherits STATE
- City
- — inherits STATE
ZIP-level market 80831
- Home prices YoY
- -30.4%
- Rents YoY
- 3.1%
- Active inventory
- 513
- Price-to-rent
- 12.4×
Monthly cashflow live
- Estimated rent
- $2,753 medium interval (Pro) →
- Mortgage (P&I)
- −$2,150
- Tax from tax record
- −$151 /mo · $1,813/yr
- Insurance
- −$171
- HOA
- −$0
- Vacancy / Maint / Mgmt
- −$578
- Net cashflow
- $-297
Break-even live
UW: 25.0% down · 7.5% · 30yr · 1.5% tax · 5.0% vac · 8.0% maint · 8.0% mgmt
Financing live
Cash to close
- Down payment
- $102,500
- Closing costs
- $12,300
- Reserves months
- —
- Total cash needed
- —
Loan-product check · same deal, 3 products live
Conventional
25% down · 7.5% · 30yr
- Down + closing
- —
- Monthly P&I
- —
- Monthly cashflow
- —
- DSCR
- —
- Eligible?
- —
Personal DTI + credit; lowest rate.
DSCR
20% down · 8.5% · 30yr
- Down + closing
- —
- Monthly P&I
- —
- Monthly cashflow
- —
- DSCR
- —
- Eligible?
- —
No personal income docs; deal must DSCR.
Hard money
10% down · 12.0% · 12mo
- Down + closing
- —
- Monthly P&I
- —
- Monthly cashflow
- —
- DSCR
- —
- Eligible?
- —
Short-term bridge; refi at stabilization.
Rent comps 1 comps
| Address | Beds | Baths | Sqft | Rent | $/sqft | DOM | Units | Dist |
|---|---|---|---|---|---|---|---|---|
| 16985 Sage Crest Rd Peyton, CO | 4.0 | 2.5 | 1729 | $2,795 | $1.62 | 2d | 1 | 0.73mi |
Listing history 14 events
-
2026-06-13statusdays on market $410,000 Pending 36 DOM
-
2026-06-10days on market $410,000 Active 34 DOM
-
2026-06-09days on market $410,000 Active 33 DOM
-
2026-06-08days on market $410,000 Active 32 DOM
-
2026-06-07days on market $410,000 Active 31 DOM
-
2026-06-05days on market $410,000 Active 28 DOM
-
2026-06-03days on market $410,000 Active 27 DOM
-
2026-06-03days on market $410,000 Active 26 DOM
-
2026-06-01days on market $410,000 Active 25 DOM
-
2026-05-31days on market $410,000 Active 24 DOM
-
2026-05-04$410,000 Active 1766-char remark
-
2022-05-10soldstatus $370,000
-
2022-04-09price $370,000
-
2021-10-14soldstatus $102,324
ⓘ Source: listings_history table (triggers on properties + properties_extension) + one-shot
backfill from property_details.listing_events for pre-trigger history.
Tax reassessment forecast CO · Resets to sale price
- Current annual tax
- $1,813 · $151/mo
- Projected year-2 tax
- $2,255 · $188/mo
- Expected delta
- +$442/yr (+$37/mo · 24.3%)
ⓘ Screening estimate from a state-policy table — verify with the county assessor before closing.
Climate risk First Street
- Flood 1/10 Low FEMA zone X (unshaded) · 0% chance over 30 yrs
- Wildfire 6/10 Major
- Heat 2/10 Low 7 d/yr ≥89°F today · 19 d/yr by 30 yrs out
- Wind 2/10 Low
- Air quality 1/10 Low 0 unhealthy d/yr today · 0 by 30 yrs out
Nearby sold comps map
Loading sold comps map…
Walkable amenities ~0.75 mi
Loading nearby amenities…
Taxation est. · year 1
- Rental income
- $33,034
- − Mortgage interest
- −$22,966
- − Property taxes
- −$1,813
- − Insurance
- −$2,050
- − Repairs & maintenance
- −$2,643
- − Management
- −$2,643
- − Depreciation
- −$11,927
- Taxable loss
- −$11,009
- Est. tax savings @ 24.0%
- +$2,642
- After-tax cash flow
- $-926/yr
For passive investors: Depreciation is non-cash, so a rental often shows a tax loss while cash-flowing — sheltering income. Rental losses are passive: they offset passive income freely, and up to $25,000/yr can offset ordinary (W-2) income if you actively participate and your MAGI is under $100k (phasing out to $0 by $150k); unused losses carry forward. On sale, claimed depreciation is recaptured at up to 25%, and gains may owe capital-gains tax (a 1031 exchange can defer both). Figures are a year-1 estimate at your 24.0% rate — not tax advice; consult a CPA.
Schools (NCES district)
- District
- El Paso County Colorado School District 49
- NCES district ID
- 0803870
- Math proficiency
- 27% ▼ -4.00%
- Reading proficiency
- 47% ▼ -1.00%
- Median HH income
- $75,604
- Composite
- 34.38/100
- National rank
- #5210
- State rank
- #27 of 86 in CO
Livability — Colorado Springs
- Score
- 78/100
- State rank
- #23
- US rank
- #2639
Category grades
Schools grade is shown separately in the Schools card above.
Census & demographics
- County
- El Paso County · 689,348 people
- City population
- 555,783
- Metro
- Colorado Springs, CO
- Population (ZIP)
- 33,912
- Household income
- $132,467
- Rent vs Own
- Severe rent burden
- 142.0
Population outlook (El Paso County) Hauer SSP2
- Today (2025)
- 768,926 people
- By 2030
- 815,739 · +6.1%
- By 2040
- 903,489 · +17.5%
- By 2050
- 981,204 · +27.6%
- By 2075
- 1,155,542 · +50.3%
- By 2100
- 1,202,070 · +56.3%
Race, ethnicity, and origin ACS 2023
- Neighborhood character
- Predominantly White (73%)
- Race & ethnicity
- White 73% Two or more races 14% Hispanic / Latino 12% Black 4% Asian 2% Native American 1%
- Hispanic origin (detail)
- Mexican 6% Puerto Rican 1%
- Common ancestry
- Italian 4% Slovak 3% Portuguese 3%
- Foreign-born
- 4% · Canada, South Korea
- Languages at home
- 94% English-only · Spanish 5% Other Asian/Pacific 1%
Political lean MEDSL · El Paso
- 2024 margin
- Lean R (+9.8) · D 43.8% · R 53.5% · Other 2.7%
- 2008→2024 swing
- +9.0pp toward D · 2008: -18.8pp · 2024: -9.8pp
- All cycles
- 2024: R+9.8 2020: R+10.8 2016: R+22.6 2012: R+21.4 2008: R+18.8
Not yet ingested
- Civics
- —
Market trends
- HPI YoY
- ▼ -115.34%
- Current HPI
- 264.0763
- Rent YoY
- ▲ 3.09%
- Metro
- Colorado Springs, CO
- State GDP YoY
- ▲ 1.95%
- F500 in state
- 14
Industry mix (Fortune 500 HQ in CO)
| Industry | F500 HQs | Revenue |
|---|---|---|
| Technology Distribution | 1 | $31B |
|
||
| Food / Agriculture | 1 | $18B |
|
||
| Packaging | 1 | $14B |
|
||
| Healthcare | 1 | $13B |
|
||
| Energy | 1 | $10B |
|
||
| Technology | 1 | $4B |
|
||
Price history
+300.7% since first listed5 events — show timeline
- 2026-06-12 Pending — elevateMLS
- 2026-05-04 Listed $410,000 elevateMLS
- 2022-05-10 Sold (Public Records) $370,000 Public Records
- 2022-04-09 Price Changed $370,000 elevateMLS
- 2021-10-14 Sold (Public Records) $102,324 Public Records
Property tax history
+11.6%/yrLatest (2025): $1,813 · +20.0% YoY. Source: county tax records.
Cash-flow waterfall
monthlySold comps — $/sqft
last 12 mo · ≤1 miLoading sold comps…