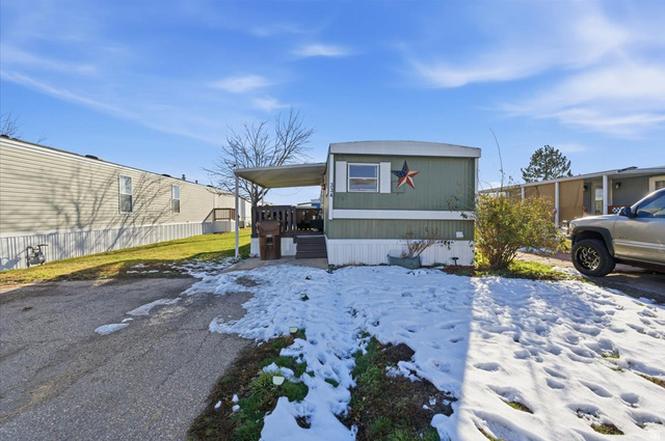
2491 N Us 89 Hwy #334 · Pleasant View, UT
Flood risk 4/10 · Minor
- FEMA flood zone
- X (unshaded)
- Chance of flooding over 30 yrs
- 0.2%
- Est. flood insurance / yr
- $507 – $1,088
Fire risk 1/10 · Minimal
- Est. fire insurance / yr
- $453 – $841
Heat risk 4/10 · Minor
- Hot days now (above 94°F)
- 7 days/yr
- Hot days in 30 yrs
- 18 days/yr
Wind risk 1/10 · Minimal
- Chance of severe wind over 30 yrs
- —
Air-quality risk 3/10 · Minor
- Unhealthy air days now
- 2 days/yr
- Unhealthy air days in 30 yrs
- 3 days/yr
Risk factors via First Street. Map © Google.
Why this score? — see what drove the D+ grade
The composite is a weighted blend of 9 inputs, each scored 0–100. Each bar is that input's sub-score; the figure is the points it added to the 100-point composite (weight × sub-score).
- Cash flow +15.0/30.0
- ARV discount +7.5/15.0
- 1% rule +5.0/10.0
- DSCR +5.0/10.0
- Livability +3.9/5.0
- Schools +3.2/10.0
- Rent growth +3.1/5.0
- Condition / age +2.5/5.0
- Appreciation +0.0/10.0
$29,000
🖨 Deal sheet 📄 Offer letter ✓ Due diligence
Listing remarks
OPEN HOUSE SATURDAY MAY 30TH 12:00PM - 3:00PM Canceled. Welcome home to a fun, yet quiet community. This is your cozy, comfortable 3 bedroom, 1 bathroom manufactured home. Featuring all the appliances including washer and dryer. A community pool, and an incredible view of the Northern Utah mountains. Buyer to very all information. CC & R available upon request. Please do not disturb tenants.
Key facts
- Community pool
- Incredible view
- 2 parking spots
Tags
Property features AI
Finance
- Other: Subdivision: Evergreen Village; Residential use; Has a view
- HOA & community: Homeowners association (Evergreen Village) with monthly fee; Association fee paid monthly; Community amenities include playground, pool, and snow removal
Exterior
- Parking: Two open/uncovered parking spaces
- Security: Video camera system
- Utilities: Natural gas connected; Electricity connected; Sewer connected; Culinary water connected
- Home design: Manufactured home; Ground-level, single-level living; Built/standing
- Construction: Aluminum exterior; Aluminum roof
- Exterior features: Covered patio; Paved road access; Mountain view; Partial landscaping with mature trees; Flat terrain
Interior
- Kitchen: Built-in range/oven; Countertop range
- Bedrooms: Three main-level bedrooms
- Flooring: Vinyl flooring
- Bathrooms: One full bathroom
- Heating & cooling: Forced air heating; Gas stove heating; Radiant floor heating; Central air conditioning; Evaporative cooling
- Interior features: Built-in range/oven with countertop range; Video camera system; Blinds on windows
- Laundry & utility: Washer and dryer included; Electric dryer hookup
Neighborhood map
What this means for you Summary
Snapshot
- This is a 3-bed/1.0-bath manufactured listed at $29k.
Deal economics
- At list price, monthly cash flow is $245 ($3k/yr) — positive.
- The deal already cash-flows at list — no discount required.
- Meets the 1% rule at list price ($2k rent vs $29k).
- Recommended offer: $26k (12.0% below list) — sets the bar for market timing.
Location & tenants
- Location reads 77/100 on livability (#51 in UT, #2,901 nationally) — a middle-class / working-renter tenant base. Strengths: crime A+, commute A+, employment A+; Watch: cost of living D, amenities F, health & safety F.
- Weber District (suburban): math 36% / reading 35% proficiency, ranked #56 of 80 in UT (top 70%) — families likely to look elsewhere, expect single-tenant / working-renter base with shorter leases.
- Zoned schools: Pioneer School (math 47% / reading 39%, grade F, #273 of 585 statewide, top 47%, 414 students, 23% FRL); Orion Jr High (math 36% / reading 37%, grade F, #88 of 138 statewide, top 66%, 1,063 students, 19% FRL); Weber High (math 33% / reading 49%, grade F, #60 of 171 statewide, top 35%, 2,037 students, 15% FRL).
- Market conditions: Rents rising (+2.3%/yr); 611 active listings in the ZIP; 3 comparable units currently listed for rent nearby; rentals at typical pace (median 15d on market — plan ~3-4 weeks tenant-placement turnaround); solid renter incomes; 1,630 units permitted in Weber County in 2024 (521 in 5+ unit buildings).
Forward outlook
- Local home prices are declining (-3.0%/yr); year-one equity from $200 of loan paydown is wiped out by about $870 of value loss. Plan a longer hold.
- Weber County population projected at +24% by 2050 — long-run rental-demand tailwind backs the buy-and-hold thesis.
- At projected returns (-3.0% appreciation + 2.3% rent growth), your $8k cash investment doubles in ~4 years — after that, you're playing with house money.
Negotiation context
- It's been on market 146 days — a 12% lower offer ($26k) is reasonable based on typical stale-listing flexibility.
Risks & watch-outs
- Watch-outs: HOA is 54% of rent.
Questions for the listing agent
- It's been on market 146 days. Have you received any prior offers? Is the seller open to a 12% concession, seller financing, or rate buy-down credit?
- Built in 1971 — when were the roof, HVAC, electrical panel, plumbing, and water heater last replaced?
- What does the HOA fee cover, when was the last increase, and are there any pending special assessments or reserve-fund shortfalls?
- Why hasn't it sold? Are there any deal-killer items the seller is aware of (foundation, flood, title, zoning, code violations)?
- Is there a deadline driving the sale (1031 exchange, divorce, estate, relocation)? That informs how much negotiation room exists.
- Schools are B-rated — typically a magnet for longer-tenancy family renters. What's the average tenant stay here, and is there a school-zone premium baked into asking?
- The area grade is low — what's the realistic commute time and amenity access for the typical tenant pool here? Any planned neighborhood developments (good or bad) we should know about?
- What's the average days-on-market for RENTAL listings here right now (not sales)? A rising rental-DOM trend means longer vacancies and softer asking-rent achievability than the comps imply.
- What's the recent tenant-quality profile in this submarket — average credit score on applications, eviction rate, late-payment / NSF rate, and stable-employment percentage? A property-management company in the area should have these aggregated.
- How much new for-sale + rental construction is in the pipeline within 1–3 miles? Heavy new supply typically softens prices + rents 12–24 months out; constrained supply supports both.
Investment metrics
- 1% rule
- 6.19% ✓
- Cap rate
- 16.42%
- Cash-on-cash
- 36.15%
- DSCR
- 2.61
- GRM
- 1.3
CMA / ARV
No comps found within radius.
Projected returns pro-forma
-3.0% appreciation · 2.33% rent growth · sell at horizon
- IRR
- 30.7%
- Equity multiple
- 2.27×
- Total profit
- $10,304
- Equity at exit
- $4,324
- IRR
- 37.3%
- Equity multiple
- 4.29×
- Total profit
- $26,708
- Equity at exit
- $2,507
Cash invested: $8,120 (down + closing). Projections, not guarantees.
Landlord ↔ Tenant lean methodology
- Overall (STATE)
- 86 Strongly Landlord-Friendly
- State Utah
- 86 Strongly Landlord-Friendly · R+15
- County
- — inherits STATE
- City
- — inherits STATE
ZIP-level market 84404
- Rents YoY
- 2.3%
- Active inventory
- 611
- Price-to-rent
- 1.3×
Monthly cashflow live
- Estimated rent
- $1,794 medium interval (Pro) →
- Mortgage (P&I)
- −$152
- Tax est. 1.5%
- −$36 /mo · $435/yr
- Insurance
- −$12
- HOA
- −$972
- Vacancy / Maint / Mgmt
- −$377
- Net cashflow
- $245
Break-even live
UW: 25.0% down · 7.5% · 30yr · 1.5% tax · 5.0% vac · 8.0% maint · 8.0% mgmt
Financing live
Cash to close
- Down payment
- $7,250
- Closing costs
- $870
- Reserves months
- —
- Total cash needed
- —
Loan-product check · same deal, 3 products live
Conventional
25% down · 7.5% · 30yr
- Down + closing
- —
- Monthly P&I
- —
- Monthly cashflow
- —
- DSCR
- —
- Eligible?
- —
Personal DTI + credit; lowest rate.
DSCR
20% down · 8.5% · 30yr
- Down + closing
- —
- Monthly P&I
- —
- Monthly cashflow
- —
- DSCR
- —
- Eligible?
- —
No personal income docs; deal must DSCR.
Hard money
10% down · 12.0% · 12mo
- Down + closing
- —
- Monthly P&I
- —
- Monthly cashflow
- —
- DSCR
- —
- Eligible?
- —
Short-term bridge; refi at stabilization.
Rent comps 3 comps
| Address | Beds | Baths | Sqft | Rent | $/sqft | DOM | Units | Dist |
|---|---|---|---|---|---|---|---|---|
| 2510 Charleston Ave Ogden, UT | 2.0–3.0 | 2.0 | 900 | $1,550 | $1.72 | 14d | 5 | 1.22mi |
| 1502 N 900 W Ogden, UT | 2.0–3.0 | 1.0–1.5 | 1050 | $1,475 | $1.40 | 14d | 8 | 1.25mi |
| 811 W 1340 N Ogden, UT | 1.0–3.0 | 1.0–2.5 | 1106 | $1,859 | $1.68 | 14d | 1 | 1.36mi |
HOA detail
- Monthly dues
- $972 · $11,664/yr
- Likely covers
- pool
Listing history 20 events
-
2026-06-18days on market $29,000 Active 146 DOM
-
2026-06-17days on market $29,000 Active 145 DOM
-
2026-06-16days on market $29,000 Active 144 DOM
-
2026-06-15days on market $29,000 Active 143 DOM
-
2026-06-14days on market $29,000 Active 141 DOM
-
2026-06-10days on market $29,000 Active 138 DOM
-
2026-06-09days on market $29,000 Active 137 DOM
-
2026-06-08days on market $29,000 Active 136 DOM
-
2026-06-07days on market $29,000 Active 135 DOM
-
2026-06-05days on market $29,000 Active 132 DOM
-
2026-06-03days on market $29,000 Active 131 DOM
-
2026-06-02days on market $29,000 Active 130 DOM
-
2026-06-01days on market $29,000 Active 129 DOM
-
2026-05-31days on market $29,000 Active 128 DOM
-
2026-05-31remarks 394-char remark
-
2026-05-31days on market $29,000 Active 127 DOM
-
2026-04-22price $29,000
-
2026-03-22price $39,900
-
2026-02-16price $45,000
-
2026-01-23$55,000 Active
ⓘ Source: listings_history table (triggers on properties + properties_extension) + one-shot
backfill from property_details.listing_events for pre-trigger history.
Climate risk First Street
- Flood 4/10 Moderate FEMA zone X (unshaded) · 20% chance over 30 yrs
- Wildfire 1/10 Low
- Heat 4/10 Moderate 7 d/yr ≥94°F today · 18 d/yr by 30 yrs out
- Wind 1/10 Low
- Air quality 3/10 Moderate 2 unhealthy d/yr today · 3 by 30 yrs out
Nearby sold comps map
Loading sold comps map…
Walkable amenities ~0.75 mi
Loading nearby amenities…
Taxation est. · year 1
- Rental income
- $21,525
- − Mortgage interest
- −$1,624
- − Property taxes
- −$435
- − Insurance
- −$145
- − Repairs & maintenance
- −$1,722
- − Management
- −$1,722
- − HOA
- −$11,664
- − Depreciation
- −$844
- Taxable income
- $3,369
- Est. tax owed @ 24.0%
- −$808
- After-tax cash flow
- $2,127/yr
For passive investors: Depreciation is non-cash, so a rental often shows a tax loss while cash-flowing — sheltering income. Rental losses are passive: they offset passive income freely, and up to $25,000/yr can offset ordinary (W-2) income if you actively participate and your MAGI is under $100k (phasing out to $0 by $150k); unused losses carry forward. On sale, claimed depreciation is recaptured at up to 25%, and gains may owe capital-gains tax (a 1031 exchange can defer both). Figures are a year-1 estimate at your 24.0% rate — not tax advice; consult a CPA.
Schools (NCES district)
- District
- Weber District
- NCES district ID
- 4901200
- Math proficiency
- 36% ▼ -4.00%
- Reading proficiency
- 35% ▼ -5.00%
- Median HH income
- $65,750
- Composite
- 32.28/100
- National rank
- #5757
- State rank
- #56 of 80 in UT
Livability — Pleasant View
- Score
- 77/100
- State rank
- #51
- US rank
- #2901
Category grades
Schools grade is shown separately in the Schools card above.
Census & demographics
- Census place
- Pleasant View, UT
- County
- Weber County · 260,557 people
- Metro
- Ogden-Clearfield, UT
- Population (ZIP)
- 66,587
- Household income
- $85,057
- Rent vs Own
- Severe rent burden
- 1201.0
Population outlook (Weber County) Hauer SSP2
- Today (2025)
- 274,329 people
- By 2030
- 288,577 · +5.2%
- By 2040
- 314,848 · +14.8%
- By 2050
- 338,710 · +23.5%
- By 2075
- 384,412 · +40.1%
- By 2100
- 409,305 · +49.2%
Race, ethnicity, and origin ACS 2023
- Neighborhood character
- Predominantly White (70%)
- Race & ethnicity
- White 70% Hispanic / Latino 24% Two or more races 7% Asian 1%
- Hispanic origin (detail)
- Mexican 20%
- Common ancestry
- Italian 5% Slovak 4% Iranian 3%
- Foreign-born
- 8% · Canada
- Languages at home
- 83% English-only · Spanish 15% Other Indo-European 1%
Political lean MEDSL · Weber
- 2024 margin
- Strong R (+23.5) · D 36.8% · R 60.3% · Other 2.9%
- 2008→2024 swing
- +4.1pp toward D · 2008: -27.6pp · 2024: -23.5pp
- All cycles
- 2024: R+23.5 2020: R+22.7 2016: R+20.0 2012: R+46.0 2008: R+27.6
Not yet ingested
- Civics
- —
Market trends
- HPI YoY
- ▼ -317.85%
- Current HPI
- 323.2499
- Rent YoY
- ▲ 2.33%
- Metro
- Ogden-Clearfield, UT
- State GDP YoY
- ▲ 3.54%
- F500 in state
- 2
Industry mix (Fortune 500 HQ in UT)
| Industry | F500 HQs | Revenue |
|---|---|---|
| Financial Services | 1 | $3B |
|
||
Price history
-47.3% since first listed4 events — show timeline
- 2026-04-22 Price Changed $29,000 WFRMLS
- 2026-03-22 Price Changed $39,900 WFRMLS
- 2026-02-16 Price Changed $45,000 WFRMLS
- 2026-01-23 Listed $55,000 WFRMLS
Cash-flow waterfall
monthlySold comps — $/sqft
last 12 mo · ≤1 miLoading sold comps…