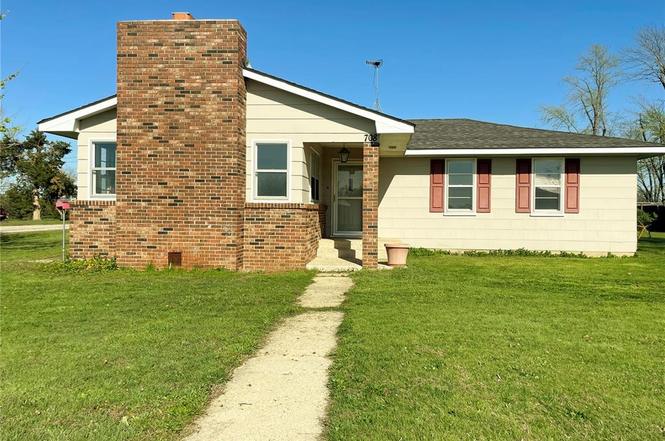
708 Locust St · Edgar Springs, MO
Flood risk 1/10 · Minimal
- FEMA flood zone
- X (unshaded)
- Chance of flooding over 30 yrs
- 0.0%
- Est. flood insurance / yr
- $507 – $1,088
Fire risk 5/10 · Moderate
- Est. fire insurance / yr
- $1,054 – $1,958
Heat risk 4/10 · Minor
- Hot days now (above 105°F)
- 7 days/yr
- Hot days in 30 yrs
- 19 days/yr
Wind risk 2/10 · Minimal
- Chance of severe wind over 30 yrs
- 1.0%
Air-quality risk 1/10 · Minimal
- Unhealthy air days now
- 0 days/yr
- Unhealthy air days in 30 yrs
- 0 days/yr
Risk factors via First Street. Map © Google.
Why this score? — see what drove the C grade
The composite is a weighted blend of 9 inputs, each scored 0–100. Each bar is that input's sub-score; the figure is the points it added to the 100-point composite (weight × sub-score).
- ARV discount +15.0/15.0
- Cash flow +14.2/30.0
- Appreciation +7.5/10.0
- Schools +5.2/10.0
- DSCR +4.3/10.0
- Livability +3.2/5.0
- 1% rule +2.8/10.0
- Rent growth +2.5/5.0
- Condition / age +2.5/5.0
$145,000
🖨 Deal sheet (PDF) 📄 Offer letter ✓ Due diligence
Key facts
- 0.67 acre lot
- Built 1959
- Listed 438 days
Property features AI
Finance
- Other: Private ownership; Seller may consider concessions
Exterior
- Parking: Off-street parking
- Utilities: Public water; Public sewer; Natural gas available
- Home design: Single-family residence; One level
- Construction: Stone veneer and brick veneer exterior; Has crawl space basement; Built above-grade living area per assessor
- Exterior features: Corner lot; Deck; Shed(s)
Interior
- Kitchen: Dishwasher; Electric cooktop; Range hood; Wall oven; Refrigerator
- Bedrooms: Three bedrooms on the main level
- Flooring: Hardwood
- Bathrooms: One full bathroom on the main level
- Heating & cooling: Forced air heating (propane); Central air conditioning (electric)
- Interior features: Breakfast bar; Pantry; Living room fireplace
- Laundry & utility: Main-level laundry; Electric water heater
Neighborhood map
What this means for you Summary
Snapshot
- This is a 3-bed/1.0-bath single-family listed at $145k.
Deal economics
- At list price, monthly cash flow is $25 ($301/yr) — positive.
- The deal already cash-flows at list — no discount required.
- To meet the 1% rule (rent ≥ 1% of price), the offer needs to be $113k (22.0% below list).
- Recommended offer: $113k (22.0% below list) — sets the bar for 1% rule.
Location & tenants
- Location reads 63/100 on livability (#333 in MO) — a middle-class / working-renter tenant base. Strengths: cost of living A+, housing A+; Watch: employment D, crime F, amenities F.
- Phelps County R-III (rural): math 55% / reading 65% proficiency, ranked #42 of 535 in MO (top 8%) — acceptable for families but not a draw, mixed tenant base, ~2y average lease.
- Zoned schools: Phelps Co. Elem. (math 42% / reading 57%, grade D, #284 of 1,115 statewide, top 30%, 157 students, 55% FRL) — zoned schools at 55% FRL track the district average.
- Market conditions: 21 active listings in the ZIP; 162 units permitted in Phelps County in 2024 (83 in 5+ unit buildings).
Forward outlook
- In year one you build about $8k of equity ($1k loan paydown + $7k appreciation (5.0% local appreciation)).
- Phelps County population projected at -12% by 2050 — secular population decline; favor cash flow + early exit over multi-decade hold.
- At projected returns (5.0% appreciation + 3.0% rent growth), your $41k cash investment doubles in ~5 years — after that, you're playing with house money.
- By year 5, paydown + projected appreciation supports a ~$36k cash-out refi (75% LTV) — recoverable capital for the next deal without selling this one.
Negotiation context
- It's been on market 438 days — a 12% lower offer ($128k) is reasonable based on typical stale-listing flexibility.
- 2 sale attempts; this cycle's ask has dropped $10k (6%) from the opening price — seller is motivated, your offer sets the floor, not the list.
Risks & watch-outs
- Watch-outs: built in 1959 — expect roof / HVAC / electrical / plumbing capex.
- Climate carrying-cost: moderate wildfire risk — expect insurance premiums to compound above CPI over the hold.
Questions for the listing agent
- It's been on market 438 days. Have you received any prior offers? Is the seller open to a 22% concession, seller financing, or rate buy-down credit?
- Built in 1959 — when were the roof, HVAC, electrical panel, plumbing, and water heater last replaced?
- Why hasn't it sold? Are there any deal-killer items the seller is aware of (foundation, flood, title, zoning, code violations)?
- Is there a deadline driving the sale (1031 exchange, divorce, estate, relocation)? That informs how much negotiation room exists.
- Crime grade is F in this area — have there been break-ins, vandalism, or insurance claims at this property in the last 3 years? What carrier currently insures it and at what premium?
- What's the average days-on-market for RENTAL listings here right now (not sales)? A rising rental-DOM trend means longer vacancies and softer asking-rent achievability than the comps imply.
- What's the recent tenant-quality profile in this submarket — average credit score on applications, eviction rate, late-payment / NSF rate, and stable-employment percentage? A property-management company in the area should have these aggregated.
- How much new for-sale + rental construction is in the pipeline within 1–3 miles? Heavy new supply typically softens prices + rents 12–24 months out; constrained supply supports both.
Investment metrics
- 1% rule
- 0.78% ✗
- Cap rate
- 6.50%
- Cash-on-cash
- 0.74%
- DSCR
- 1.03
- GRM
- 10.7
CMA / ARV
- ARV (on-the-fly)
- $239,292
- Comps found
- 1
Show comp detail 1 sale within ~0.75 mi
| Address | Dist | Beds/Ba | Sqft | Sold | Price | $/sf | Match |
|---|---|---|---|---|---|---|---|
| 15801 State Route FF | 0.35mi | 3/1.5 | 1,372 (-12%) | 15mo | $209,900 | $153 | 48 |
Match score weights: distance 35% · size 25% · config 20% · recency 20%. Top-matched comps best support the ARV.
Projected returns pro-forma
4.97% appreciation · 3.0% rent growth · sell at horizon
- IRR
- 13.4%
- Equity multiple
- 1.85×
- Total profit
- $34,710
- Equity at exit
- $81,910
- IRR
- 14.2%
- Equity multiple
- 3.55×
- Total profit
- $103,567
- Equity at exit
- $141,151
Cash invested: $40,600 (down + closing). Projections, not guarantees.
Landlord ↔ Tenant lean methodology
- Overall (STATE)
- 81 Strongly Landlord-Friendly
- State Missouri
- 81 Strongly Landlord-Friendly · R+10
- County
- — inherits STATE
- City
- — inherits STATE
ZIP-level market 65462
- Home prices YoY
- 3.1%
- Active inventory
- 21
- Price-to-rent
- 10.7×
Monthly cashflow live
- Estimated rent
- $1,130 medium interval (Pro) →
- Mortgage (P&I)
- −$760
- Tax from tax record
- −$47 /mo · $566/yr
- Insurance
- −$60
- HOA
- −$0
- Lot rent
- −$0
- Vacancy / Maint / Mgmt
- −$237
- Net cashflow
- $25
Break-even live
Sensitivity live
| Price | -10% $107 | -5% $66 | +0% $25 | +5% $-16 | +10% $-57 |
|---|---|---|---|---|---|
| Rent | -10% $-64 | -5% $-20 | +0% $25 | +5% $70 | +10% $114 |
| Rate | -1.0pp $98 | -0.5pp $62 | base $25 | +0.5pp $-12 | +1.0pp $-51 |
UW: 25.0% down · 7.5% · 30yr · 1.5% tax · 5.0% vac · 8.0% maint · 8.0% mgmt
Financing live
Cash to close
- Down payment
- $36,250
- Closing costs
- $4,350
- Reserves months
- —
- Total cash needed
- —
Loan-product check · same deal, 3 products live
Conventional
25% down · 7.5% · 30yr
- Down + closing
- —
- Monthly P&I
- —
- Monthly cashflow
- —
- DSCR
- —
- Eligible?
- —
Personal DTI + credit; lowest rate.
DSCR
20% down · 8.5% · 30yr
- Down + closing
- —
- Monthly P&I
- —
- Monthly cashflow
- —
- DSCR
- —
- Eligible?
- —
No personal income docs; deal must DSCR.
Hard money
10% down · 12.0% · 12mo
- Down + closing
- —
- Monthly P&I
- —
- Monthly cashflow
- —
- DSCR
- —
- Eligible?
- —
Short-term bridge; refi at stabilization.
Listing history 22 events
-
2026-06-22days on market $145,000 Active 438 DOM
-
2026-06-19days on market $145,000 Active 435 DOM
-
2026-06-18days on market $145,000 Active 434 DOM
-
2026-06-17days on market $145,000 Active 433 DOM
-
2026-06-16days on market $145,000 Active 432 DOM
-
2026-06-15days on market $145,000 Active 431 DOM
-
2026-06-14days on market $145,000 Active 429 DOM
-
2026-06-12days on market $145,000 Active 428 DOM
-
2026-06-09days on market $145,000 Active 425 DOM
-
2026-06-08days on market $145,000 Active 424 DOM
-
2026-06-07days on market $145,000 Active 423 DOM
-
2026-06-05days on market $145,000 Active 420 DOM
-
2026-06-02days on market $145,000 Active 418 DOM
-
2026-05-31days on market $145,000 Active 417 DOM
-
2026-05-30days on market $145,000 Active 416 DOM
-
2026-05-12price $145,000
-
2026-03-18price $147,900
-
2025-08-22status Active
-
2025-08-11historical Active Under Contract
-
2025-07-25price $149,900
-
2025-04-09$154,900 Active
-
2009-10-07soldstatus
ⓘ Source: listings_history table (triggers on properties + properties_extension) + one-shot
backfill from property_details.listing_events for pre-trigger history.
Tax reassessment forecast MO · Resets to sale price
- Current annual tax
- $566 · $47/mo
- Projected year-2 tax
- $1,406 · $117/mo
- Expected delta
- +$841/yr (+$70/mo · 148.6%)
ⓘ Screening estimate from a state-policy table — verify with the county assessor before closing.
Climate risk First Street
- Flood 1/10 Low FEMA zone X (unshaded) · 0% chance over 30 yrs
- Wildfire 5/10 Major
- Heat 4/10 Moderate 7 d/yr ≥105°F today · 19 d/yr by 30 yrs out
- Wind 2/10 Low 100% chance of damaging wind over 30 yrs
- Air quality 1/10 Low 0 unhealthy d/yr today · 0 by 30 yrs out
Nearby sold comps map
Loading sold comps map…
Walkable amenities ~0.75 mi
Loading nearby amenities…
Taxation est. · year 1
- Rental income
- $13,566
- − Mortgage interest
- −$8,122
- − Property taxes
- −$566
- − Insurance
- −$725
- − Repairs & maintenance
- −$1,085
- − Management
- −$1,085
- − Depreciation
- −$4,218
- Taxable loss
- −$2,236
- Est. tax savings @ 24.0%
- +$537
- After-tax cash flow
- $838/yr
For passive investors: Depreciation is non-cash, so a rental often shows a tax loss while cash-flowing — sheltering income. Rental losses are passive: they offset passive income freely, and up to $25,000/yr can offset ordinary (W-2) income if you actively participate and your MAGI is under $100k (phasing out to $0 by $150k); unused losses carry forward. On sale, claimed depreciation is recaptured at up to 25%, and gains may owe capital-gains tax (a 1031 exchange can defer both). Figures are a year-1 estimate at your 24.0% rate — not tax advice; consult a CPA.
Schools (NCES district)
- District
- Phelps County R-III
- NCES district ID
- 2925080
- Math proficiency
- 55% ▲ 5.00%
- Reading proficiency
- 65% ▲ 10.00%
- Median HH income
- $42,852
- Composite
- 51.99/100
- National rank
- #3531
- State rank
- #42 of 535 in MO
Livability — Edgar Springs
- Score
- 63/100
- State rank
- #333
- US rank
- #15233
Category grades
Schools grade is shown separately in the Schools card above.
Census & demographics
- Census place
- Edgar Springs, MO
- Population (ZIP)
- 1,295
Population outlook (Phelps County) Hauer SSP2
- Today (2025)
- 44,188 people
- By 2030
- 43,524 · -1.5%
- By 2040
- 41,211 · -6.7%
- By 2050
- 38,977 · -11.8%
- By 2075
- 33,846 · -23.4%
- By 2100
- 27,828 · -37.0%
Race, ethnicity, and origin ACS 2023
- Neighborhood character
- Predominantly White (86%)
- Race & ethnicity
- White 86% Two or more races 7% Black 1% Hispanic / Latino 1%
- Common ancestry
- Serbian 5% Lithuanian 5% Slovak 3%
Political lean MEDSL · Phelps
- 2024 margin
- Solid R (+42.9) · D 27.9% · R 70.8% · Other 1.3%
- 2008→2024 swing
- -20.7pp toward R · 2008: -22.2pp · 2024: -42.9pp
- All cycles
- 2024: R+42.9 2020: R+40.1 2016: R+42.9 2012: R+33.5 2008: R+22.2
Not yet ingested
- Civics
- —
Market trends
- HPI YoY
- ▲ 4.97%
- Current HPI
- 167.4148
- Rent YoY
- —
- Metro
- —
- State GDP YoY
- ▲ 1.84%
- F500 in state
- 20
Industry mix (Fortune 500 HQ in MO)
| Industry | F500 HQs | Revenue |
|---|---|---|
| Healthcare | 1 | $163B |
|
||
| Insurance | 1 | $21B |
|
||
| Industrial Technology | 1 | $17B |
|
||
| Retail | 1 | $16B |
|
||
| Industrial Distribution | 1 | $10B |
|
||
| Utilities | 1 | $9B |
|
||
Price history
-6.4% since first listed7 events — show timeline
- 2026-05-12 Price Changed $145,000 MARIS as Distributed by MLS Grid
- 2026-03-18 Price Changed $147,900 MARIS as Distributed by MLS Grid
- 2025-08-22 Relisted — MARIS as Distributed by MLS Grid
- 2025-08-11 Contingent — MARIS as Distributed by MLS Grid
- 2025-07-25 Price Changed $149,900 MARIS as Distributed by MLS Grid
- 2025-04-09 Listed $154,900 MARIS as Distributed by MLS Grid
- 2009-10-07 Sold (Public Records) — Public Records
Property tax history
+2.0%/yrLatest (2025): $566 · +10.3% YoY. Source: county tax records.
Cash-flow waterfall
monthlySold comps — $/sqft
last 12 mo · ≤1 miLoading sold comps…